Copyright
©The Author(s) 2025.
World J Clin Oncol. Oct 24, 2025; 16(10): 110511
Published online Oct 24, 2025. doi: 10.5306/wjco.v16.i10.110511
Published online Oct 24, 2025. doi: 10.5306/wjco.v16.i10.110511
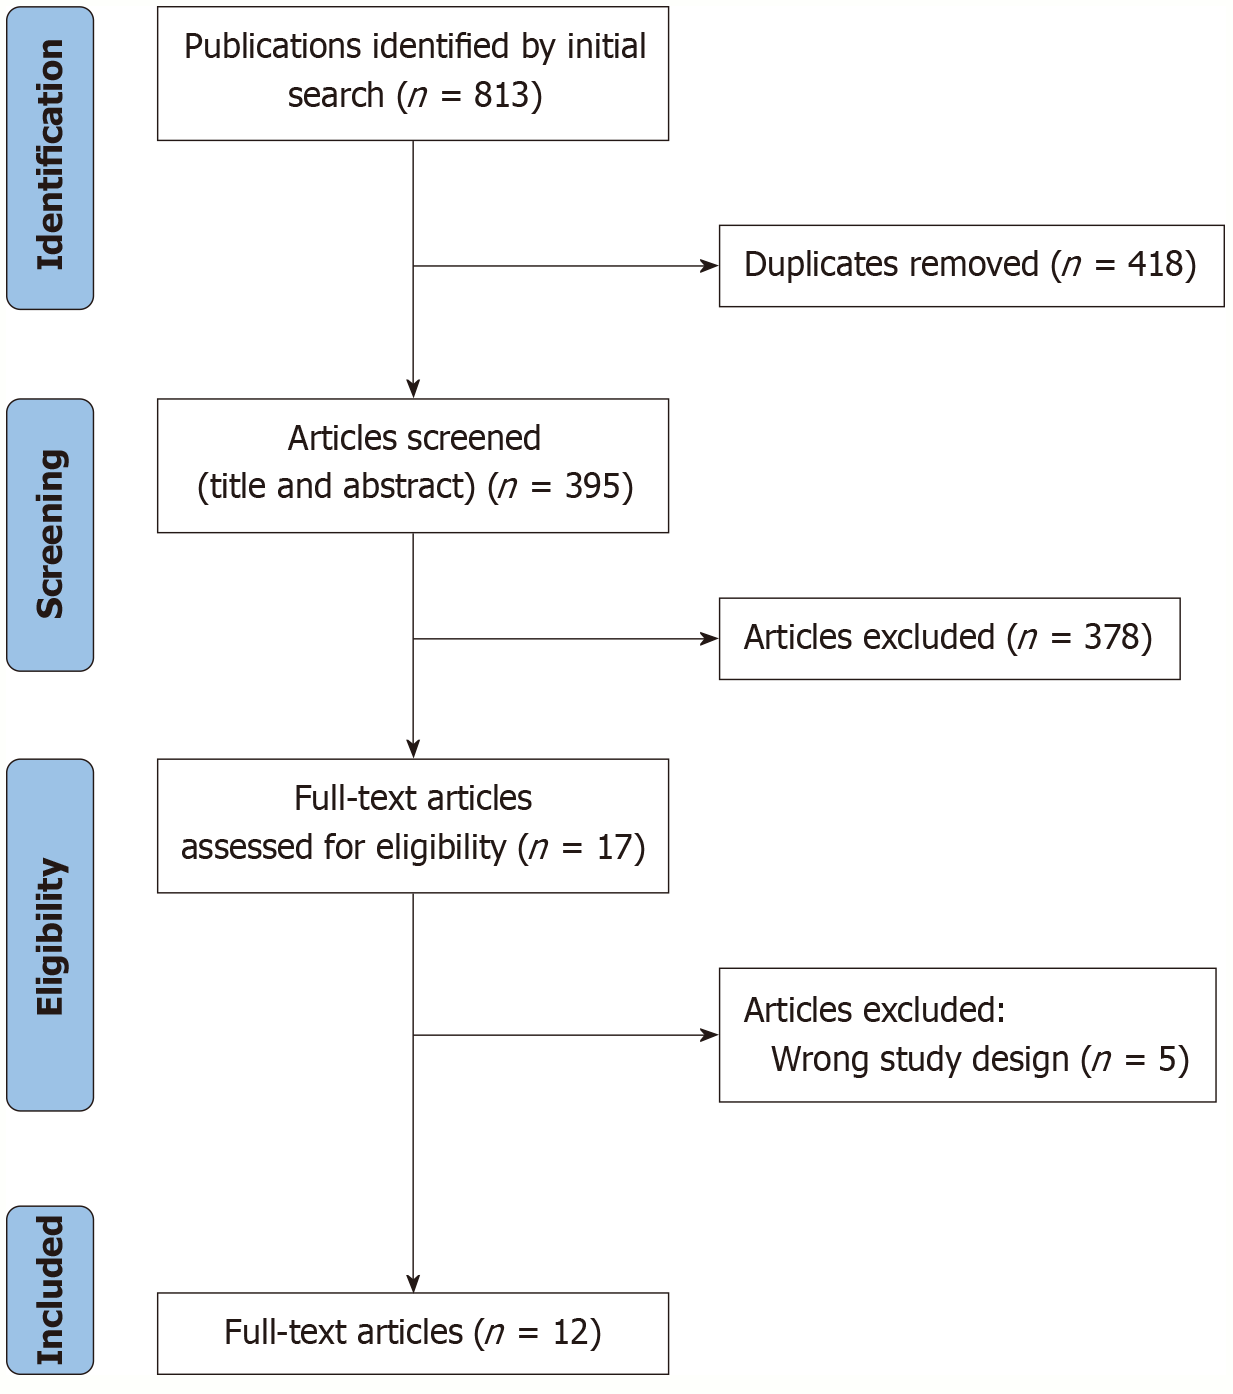
Figure 1 PRISMA flow diagram.
Flow diagram summarizing the study selection process. A total of 395 studies were initially identified, of which 12 met the inclusion criteria and were included in the final meta-analysis.
Figure 2 Forest plot.
A: Major pathological response. Log(odds) forest plot for major pathological response following neoadjuvant immunotherapy in resectable hepatocellular carcinoma. Pooled odds ratio (OR) = 0.28 [95% confidence interval (95%CI): 0.19-0.41]; B: Overall response rate (ORR). Log(odds) forest plot for ORR following neoadjuvant immunotherapy. Pooled OR = 0.54 (95%CI: 0.25-1.14); C: Pathological complete response (pCR). Log(odds) forest plot for pCR in patients treated with neoadjuvant immunotherapy. Pooled OR = 0.26 (95%CI: 0.11-0.66); D: Resection rate. Log(odds) forest plot for resection rate after neoadjuvant immunotherapy. Pooled OR: 5.37 (95%CI: 2.70-10.66); E: Treatment-related adverse events (TRAEs). Log(odds) forest plot for grade 3-4 TRAEs. Pooled OR = 0.33 (95%CI: 0.22-0.50). OR: Odds ratio; 95%CI: 95% confidence interval.
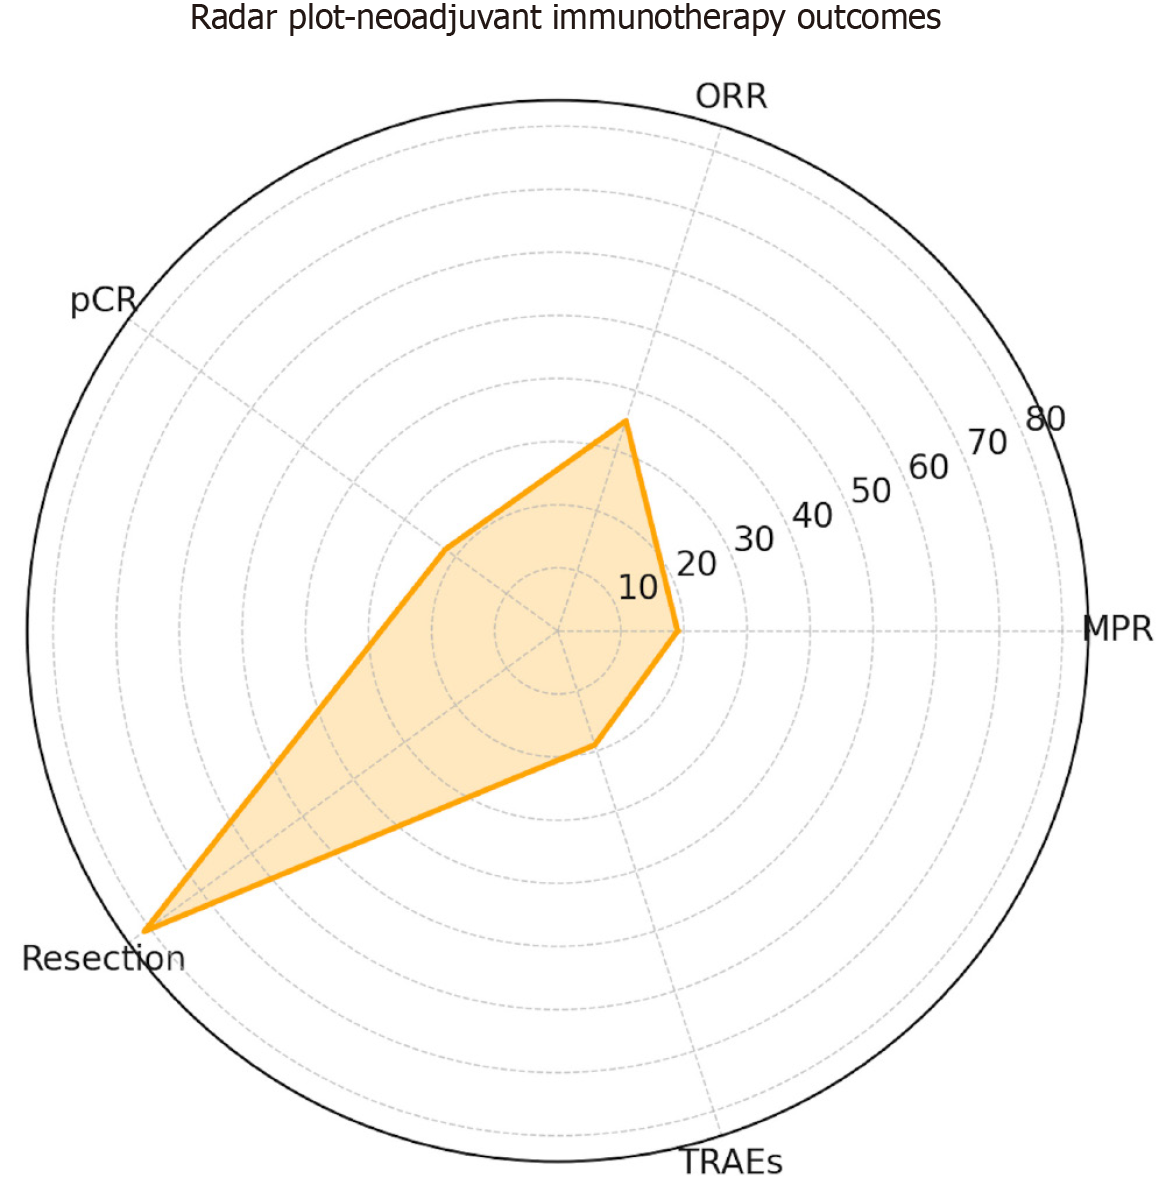
Figure 3 Radar plot of pooled event rates across clinical endpoints.
Radar plot displaying pooled event rates for key clinical endpoints: 19% for major pathological response, 35% for overall response rate, 22% for pathological complete response, 81% for resection rate, and 19% for grade 3-4 treatment-related adverse events. pCR: Pathological complete response; MPR: Major pathological response; ORR: Overall response rate; TRAE: Treatment-related adverse event.
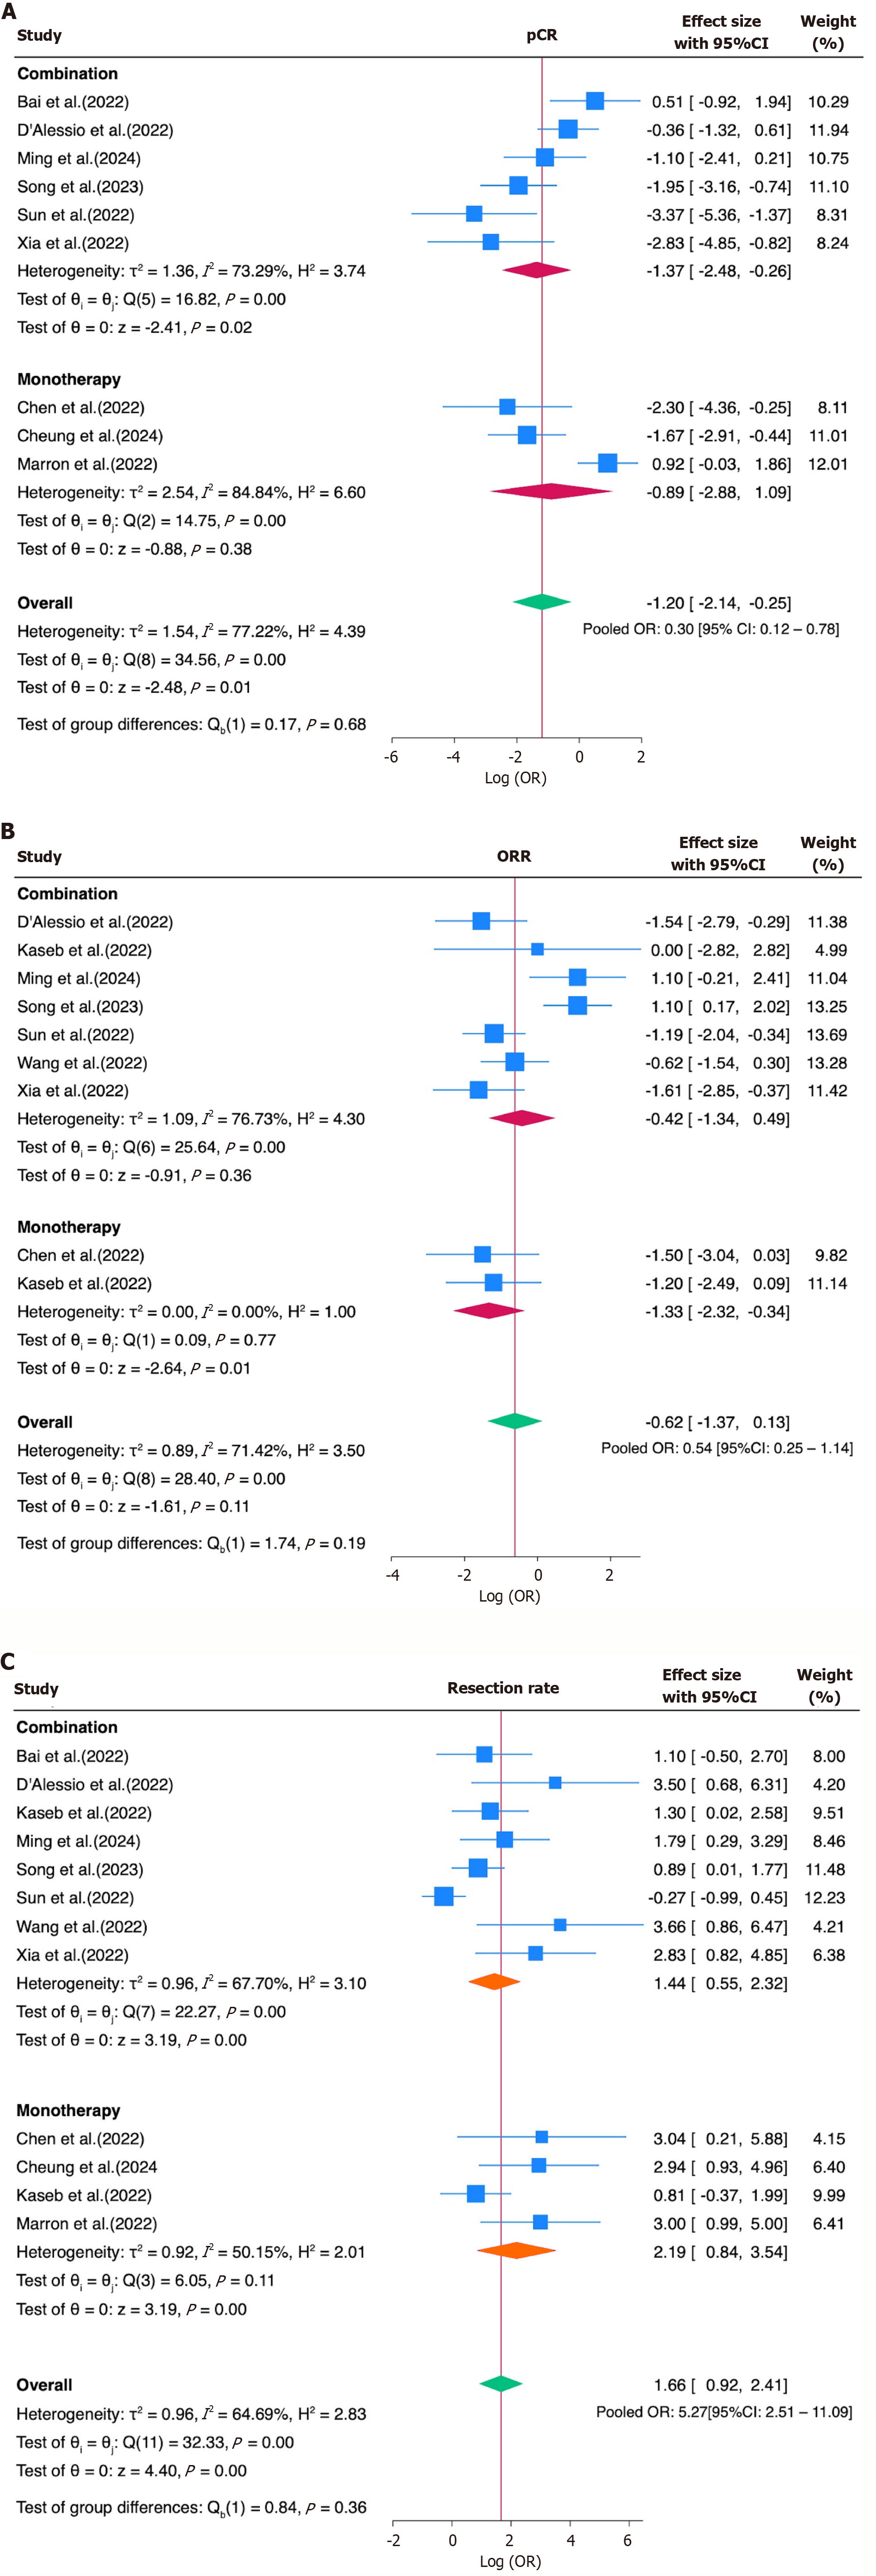
Figure 4 Subgroup analysis by immune checkpoint inhibitor regimen (monotherapy vs combination).
A-C: No significant difference was observed between the subgroups for (A) pathological complete response, (B) overall response rate and (C) resection rate. 95%CI: 95% confidence interval.
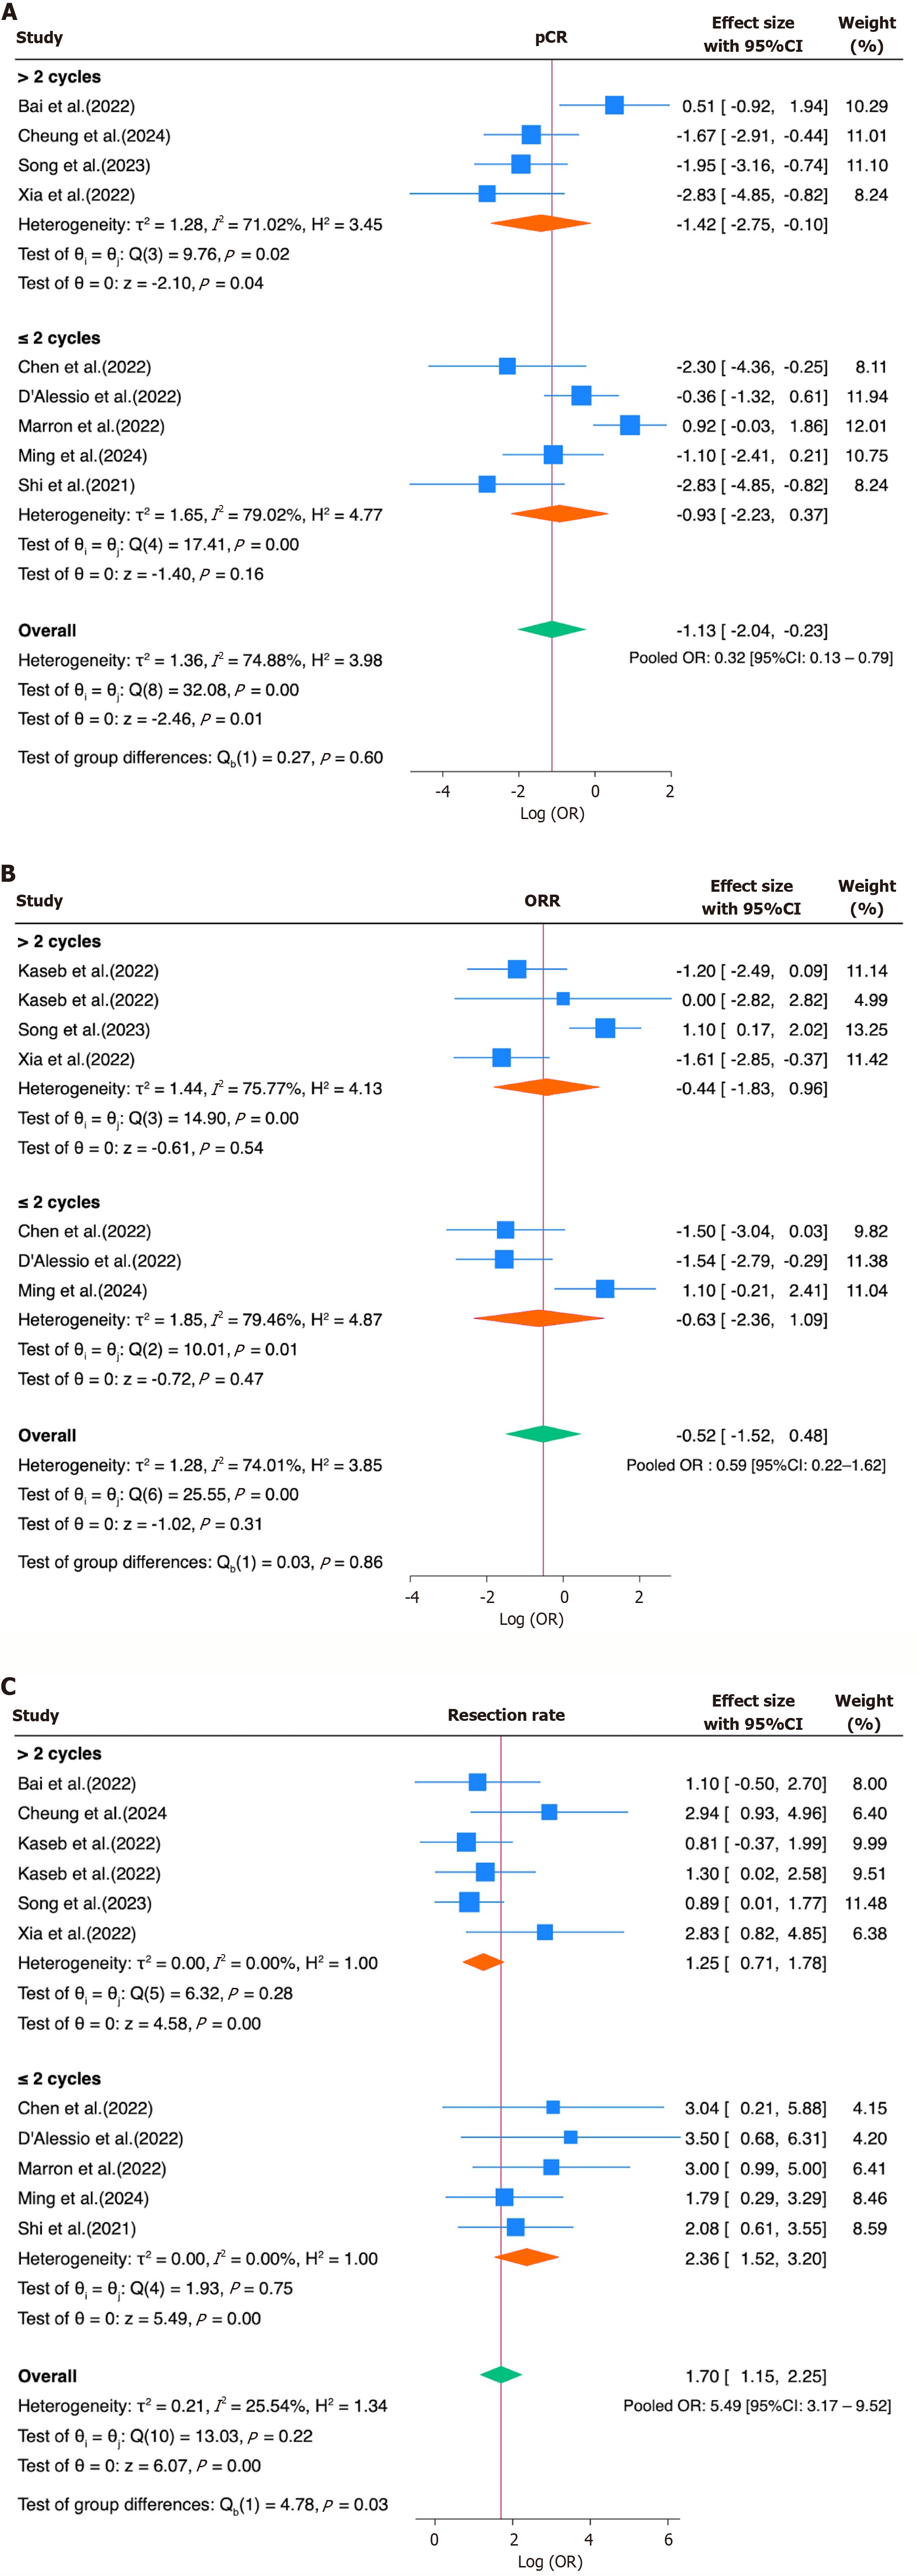
Figure 5 Subgroup analysis by number of immune checkpoint inhibitor cycles (≤ 2 vs > 2).
A and B: No significant subgroup differences were observed for (A) pathological complete response and (B) overall response rate; C: Shorter regimens (≤ 2 cycles) were associated with a significantly higher resection rate compared to longer regimens. 95%CI: 95% confidence interval.
- Citation: Cicerone O, Oliviero B, Mantovani S, Maiocchi L, Ravetta V, Berton F, Corallo S, Vanoli A, Maestri M. Neoadjuvant immunotherapy in resectable hepatocellular carcinoma: A meta-analysis of the current evidence. World J Clin Oncol 2025; 16(10): 110511
- URL: https://www.wjgnet.com/2218-4333/full/v16/i10/110511.htm
- DOI: https://dx.doi.org/10.5306/wjco.v16.i10.110511


