Copyright
©The Author(s) 2025.
World J Stem Cells. Oct 26, 2025; 17(10): 109862
Published online Oct 26, 2025. doi: 10.4252/wjsc.v17.i10.109862
Published online Oct 26, 2025. doi: 10.4252/wjsc.v17.i10.109862
Figure 1 A timeline presents all experimental procedures in the current study.
MI: Myocardial infarction.
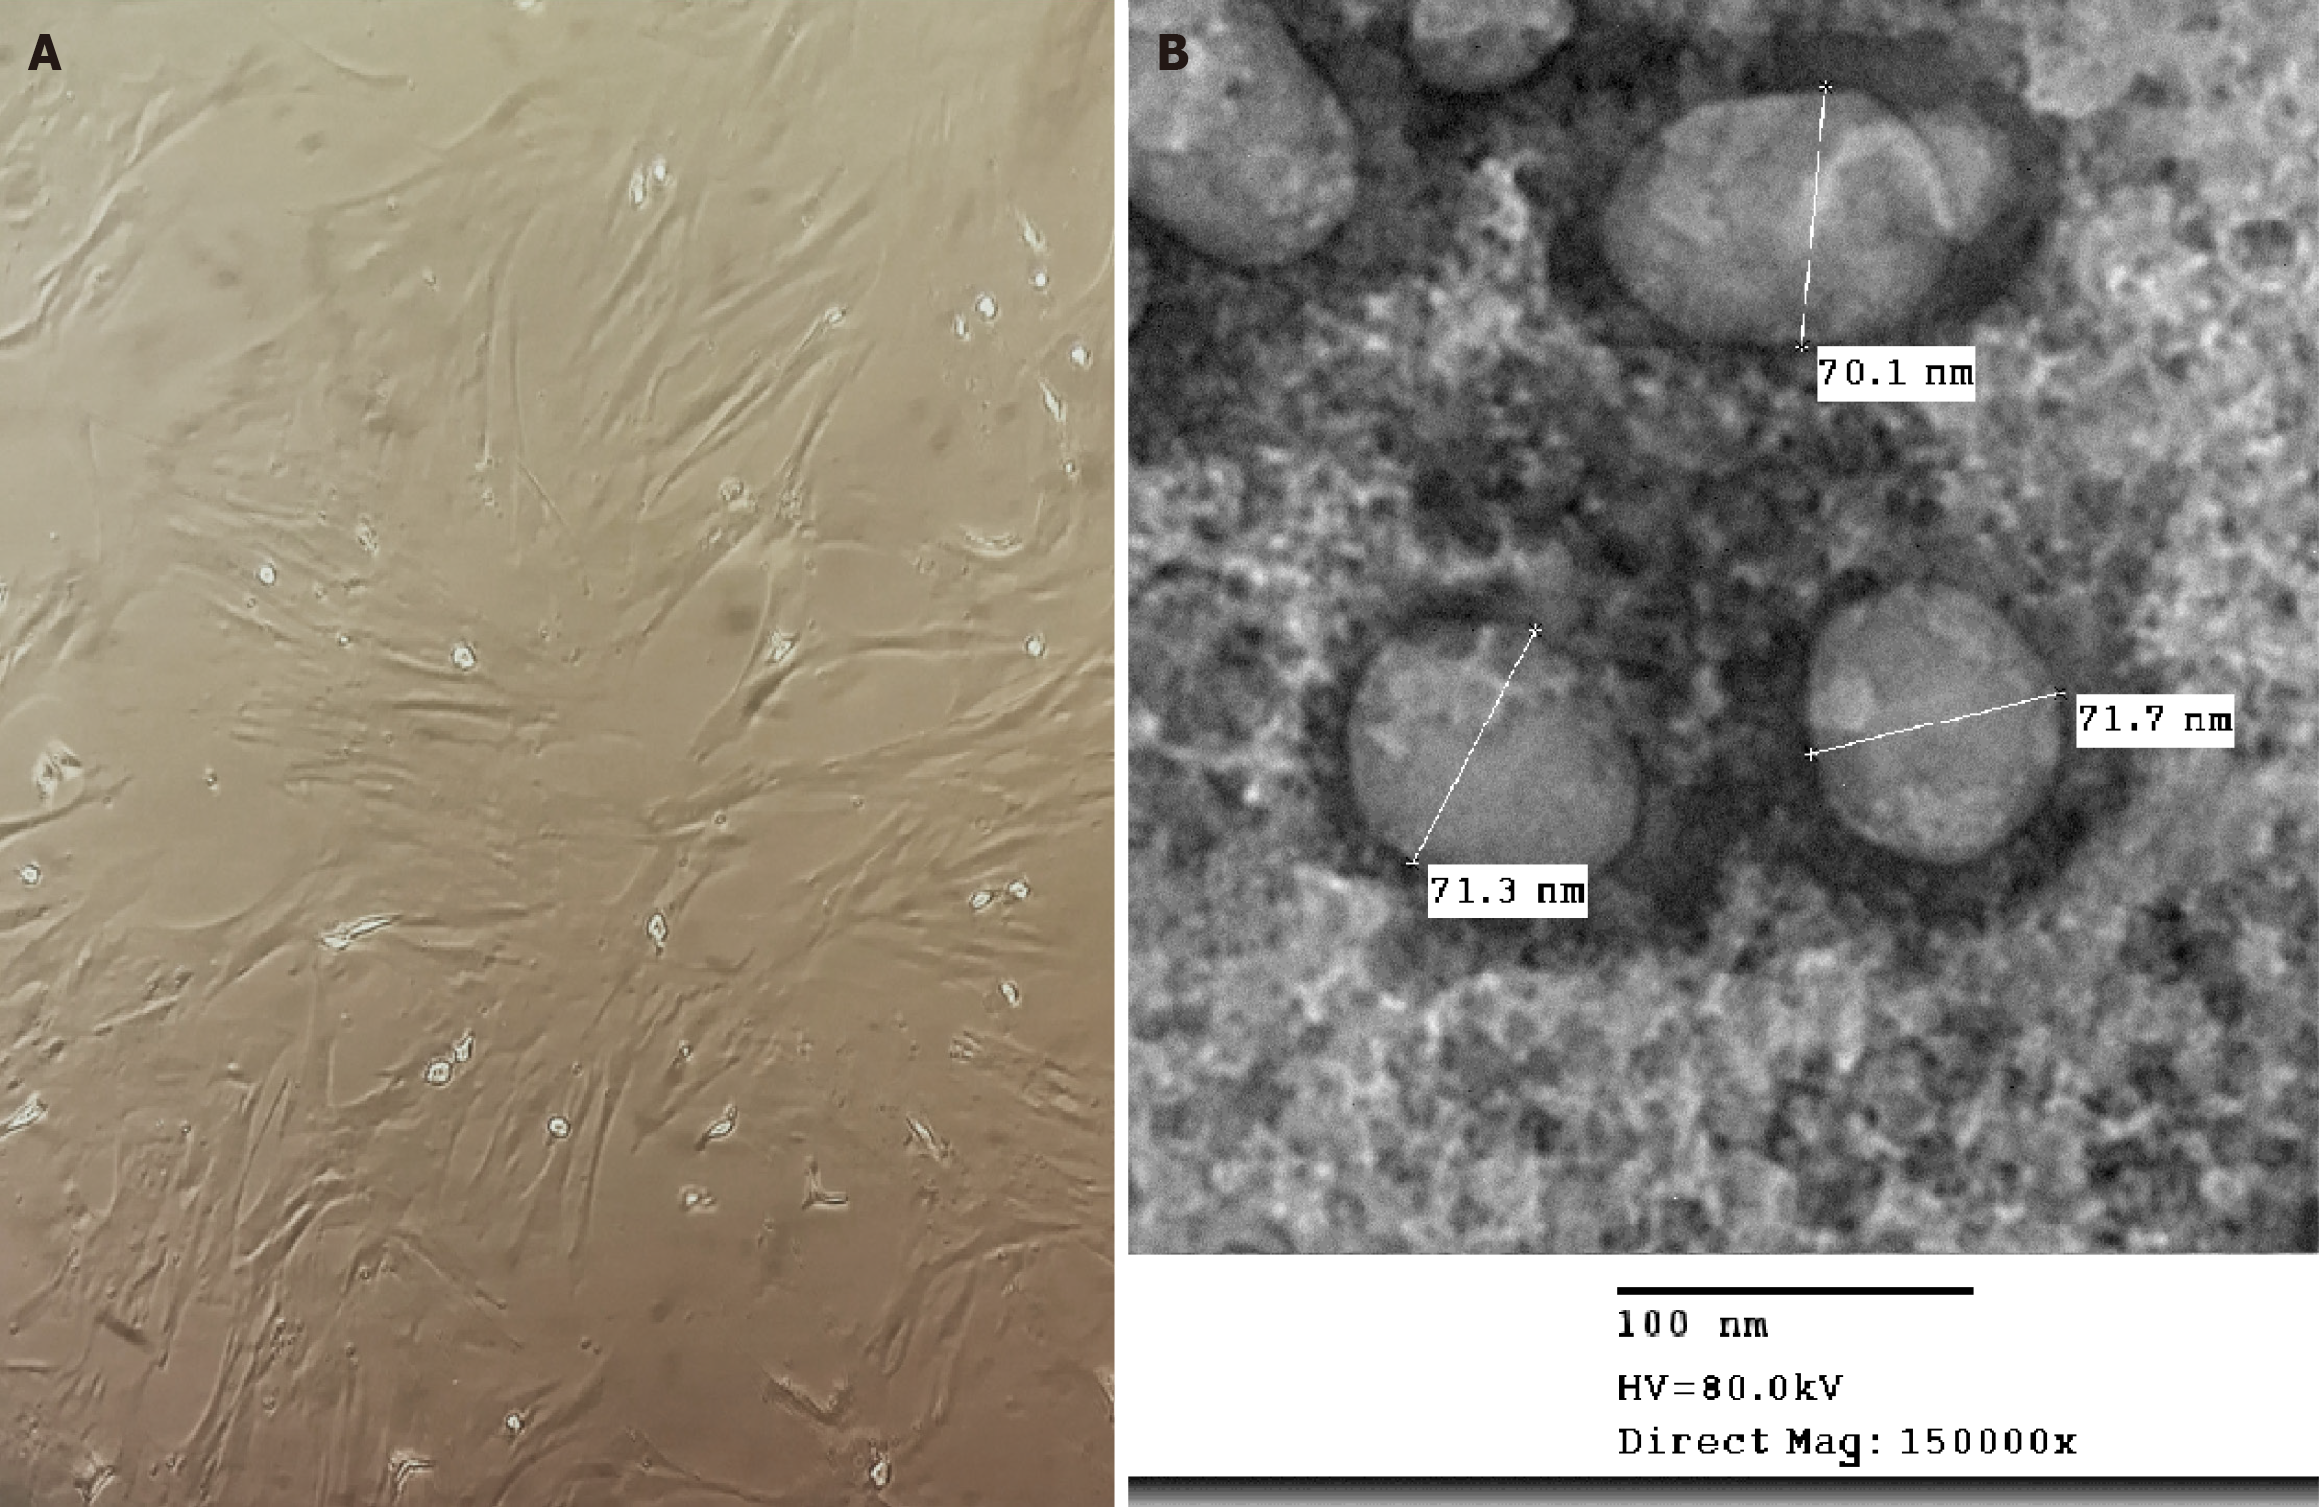
Figure 2 Identification of mesenchymal stem cell and their-derived exosomes under light and electron microscopy, respectively.
A: The cultured mesenchymal stem cell display fibroblast-like adherent appearance; B: Transmission electron microscopy of the mesenchymal stem cell-derived exosomes.
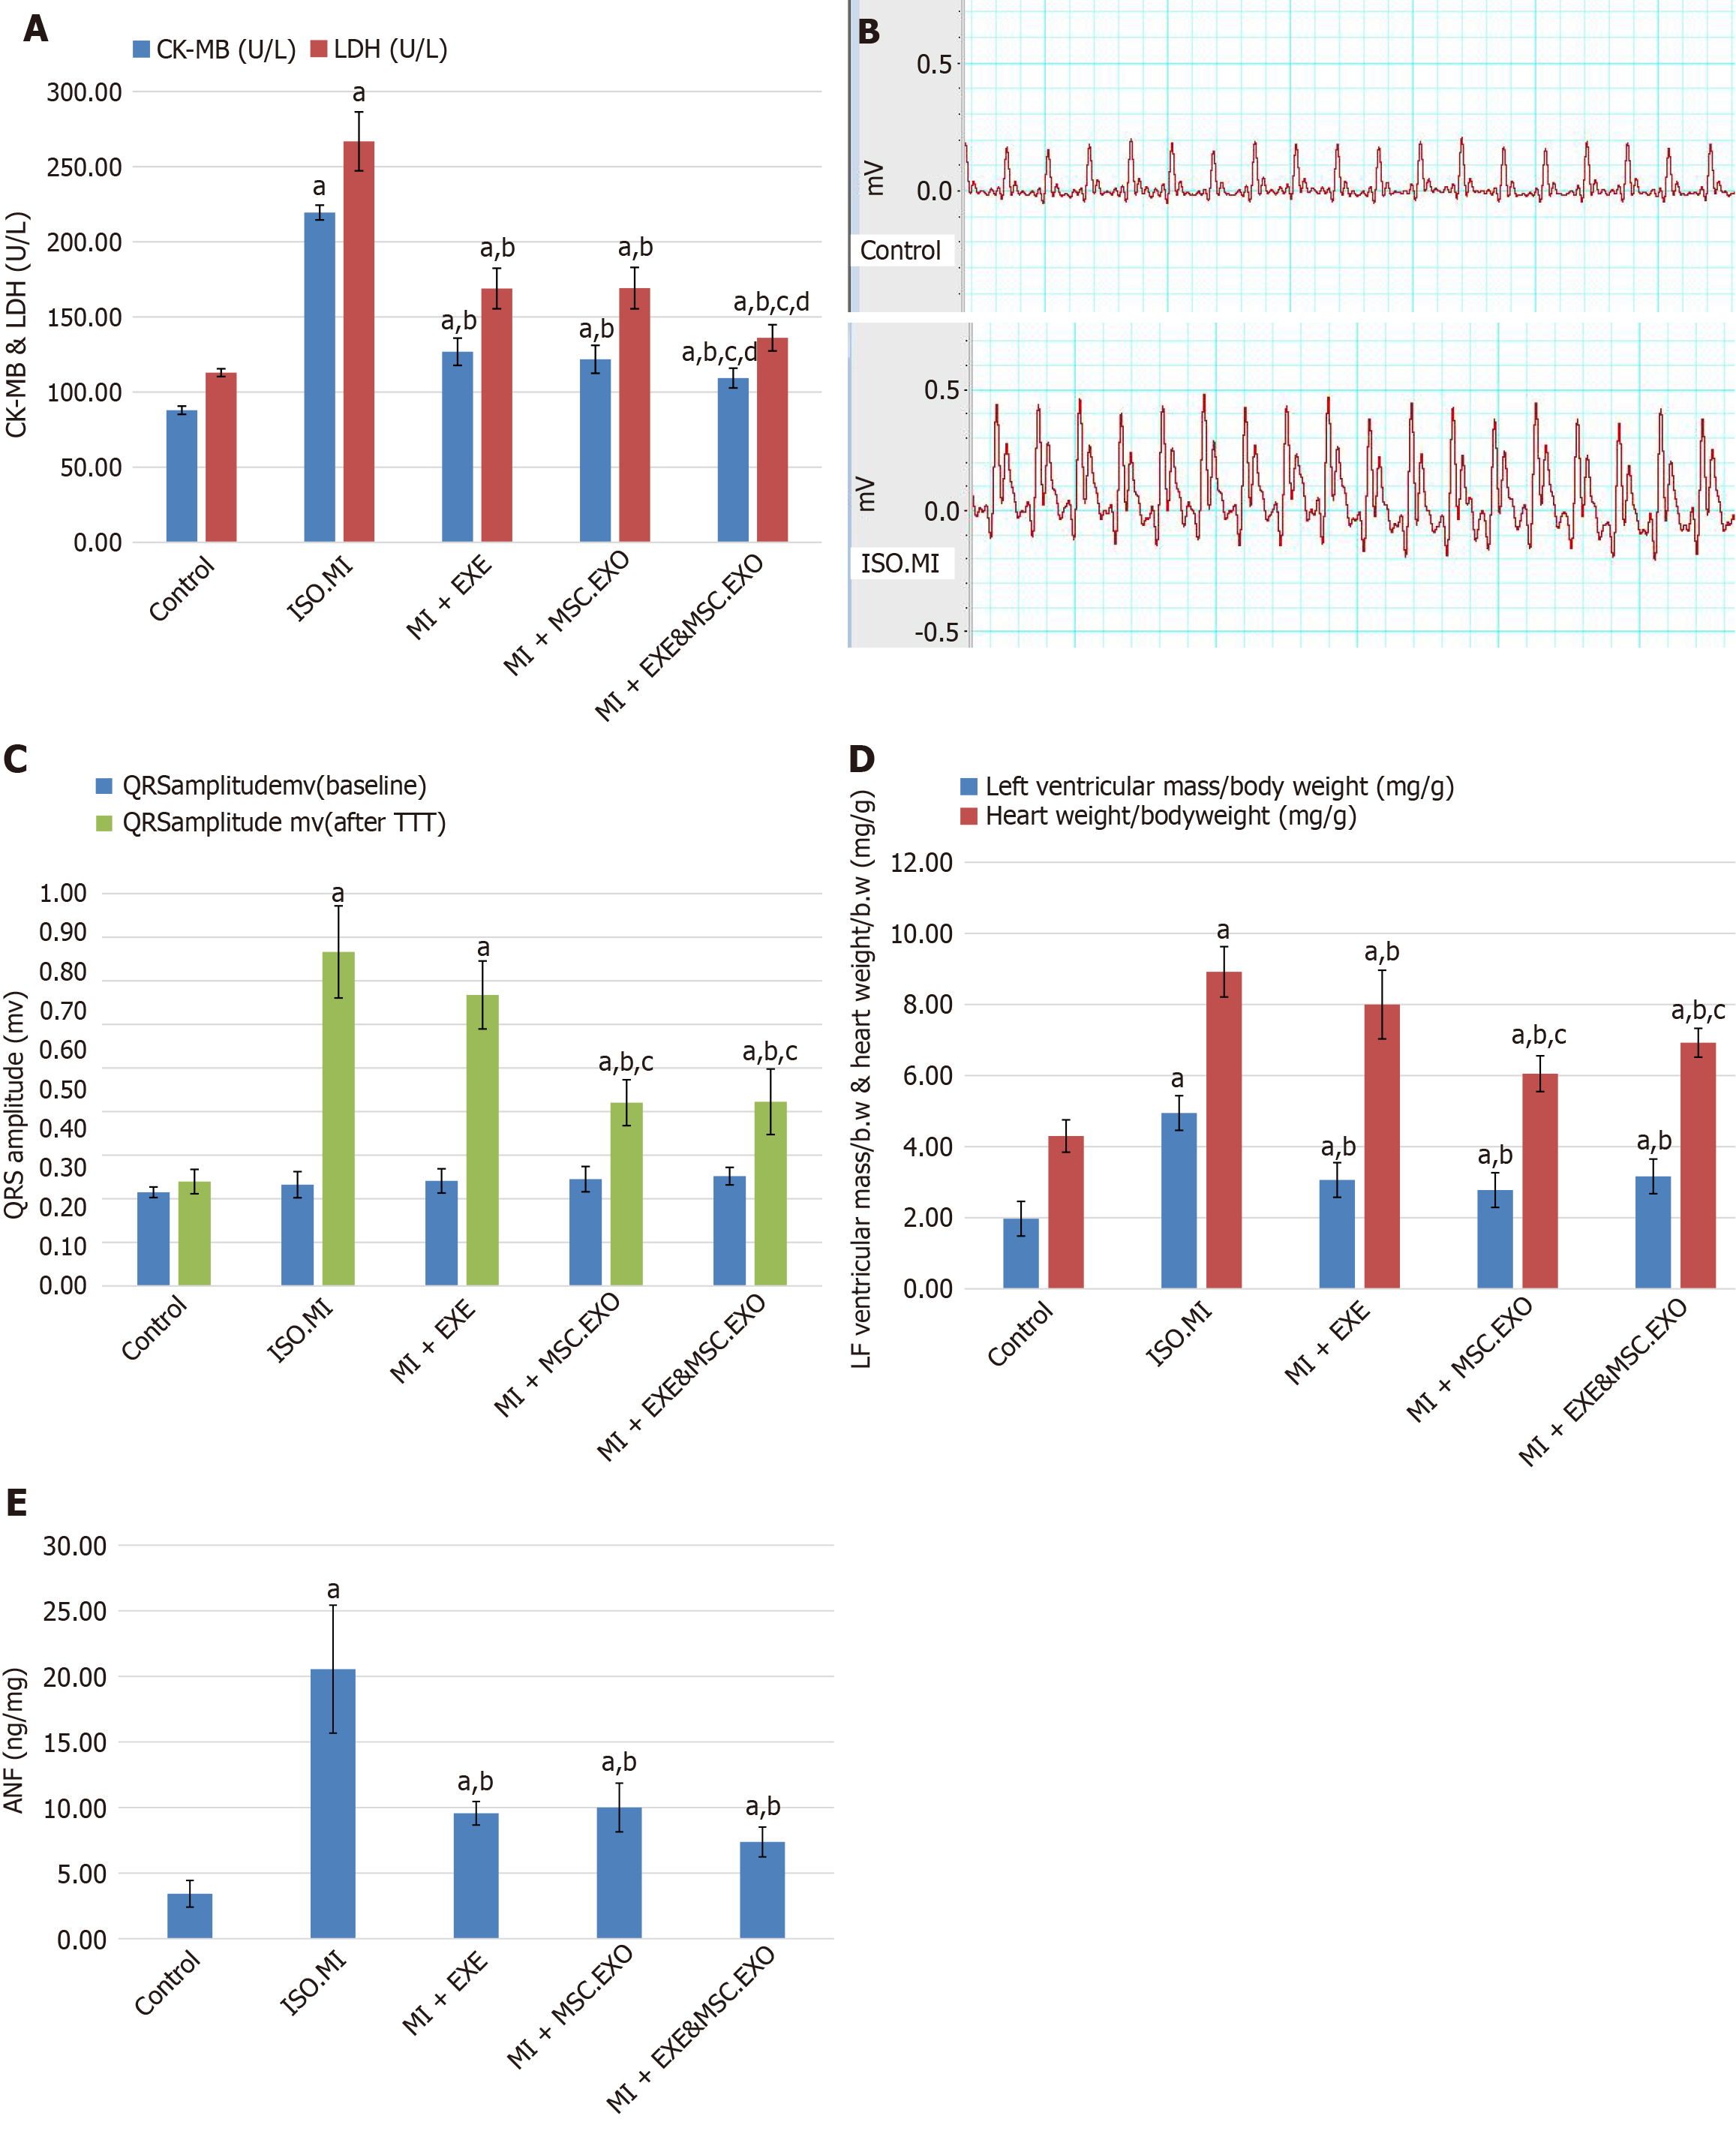
Figure 3 Quantitative analysis of ischemic cardiac hypertrophy in different groups.
A: Cardiac enzyme level in different groups; B: Electrocardiogram in the control and the induction of myocardial infarction was performed using isoproterenol groups; C: QRS amplitude in different groups; D: Heart weight index level in different groups; E: Atrial natriuretic factor level in different groups. Values represent means ± SD (n = 8). aP < 0.05, compared to the control group; bP < 0.05, compared to the induction of myocardial infarction was performed using isoproterenol group; cP < 0.05, compared to MI + EXE group; dP < 0.05, compared to MI + MSC-EXO group. MSC-EXO: Mesenchymal stem cell-derived exosomes.
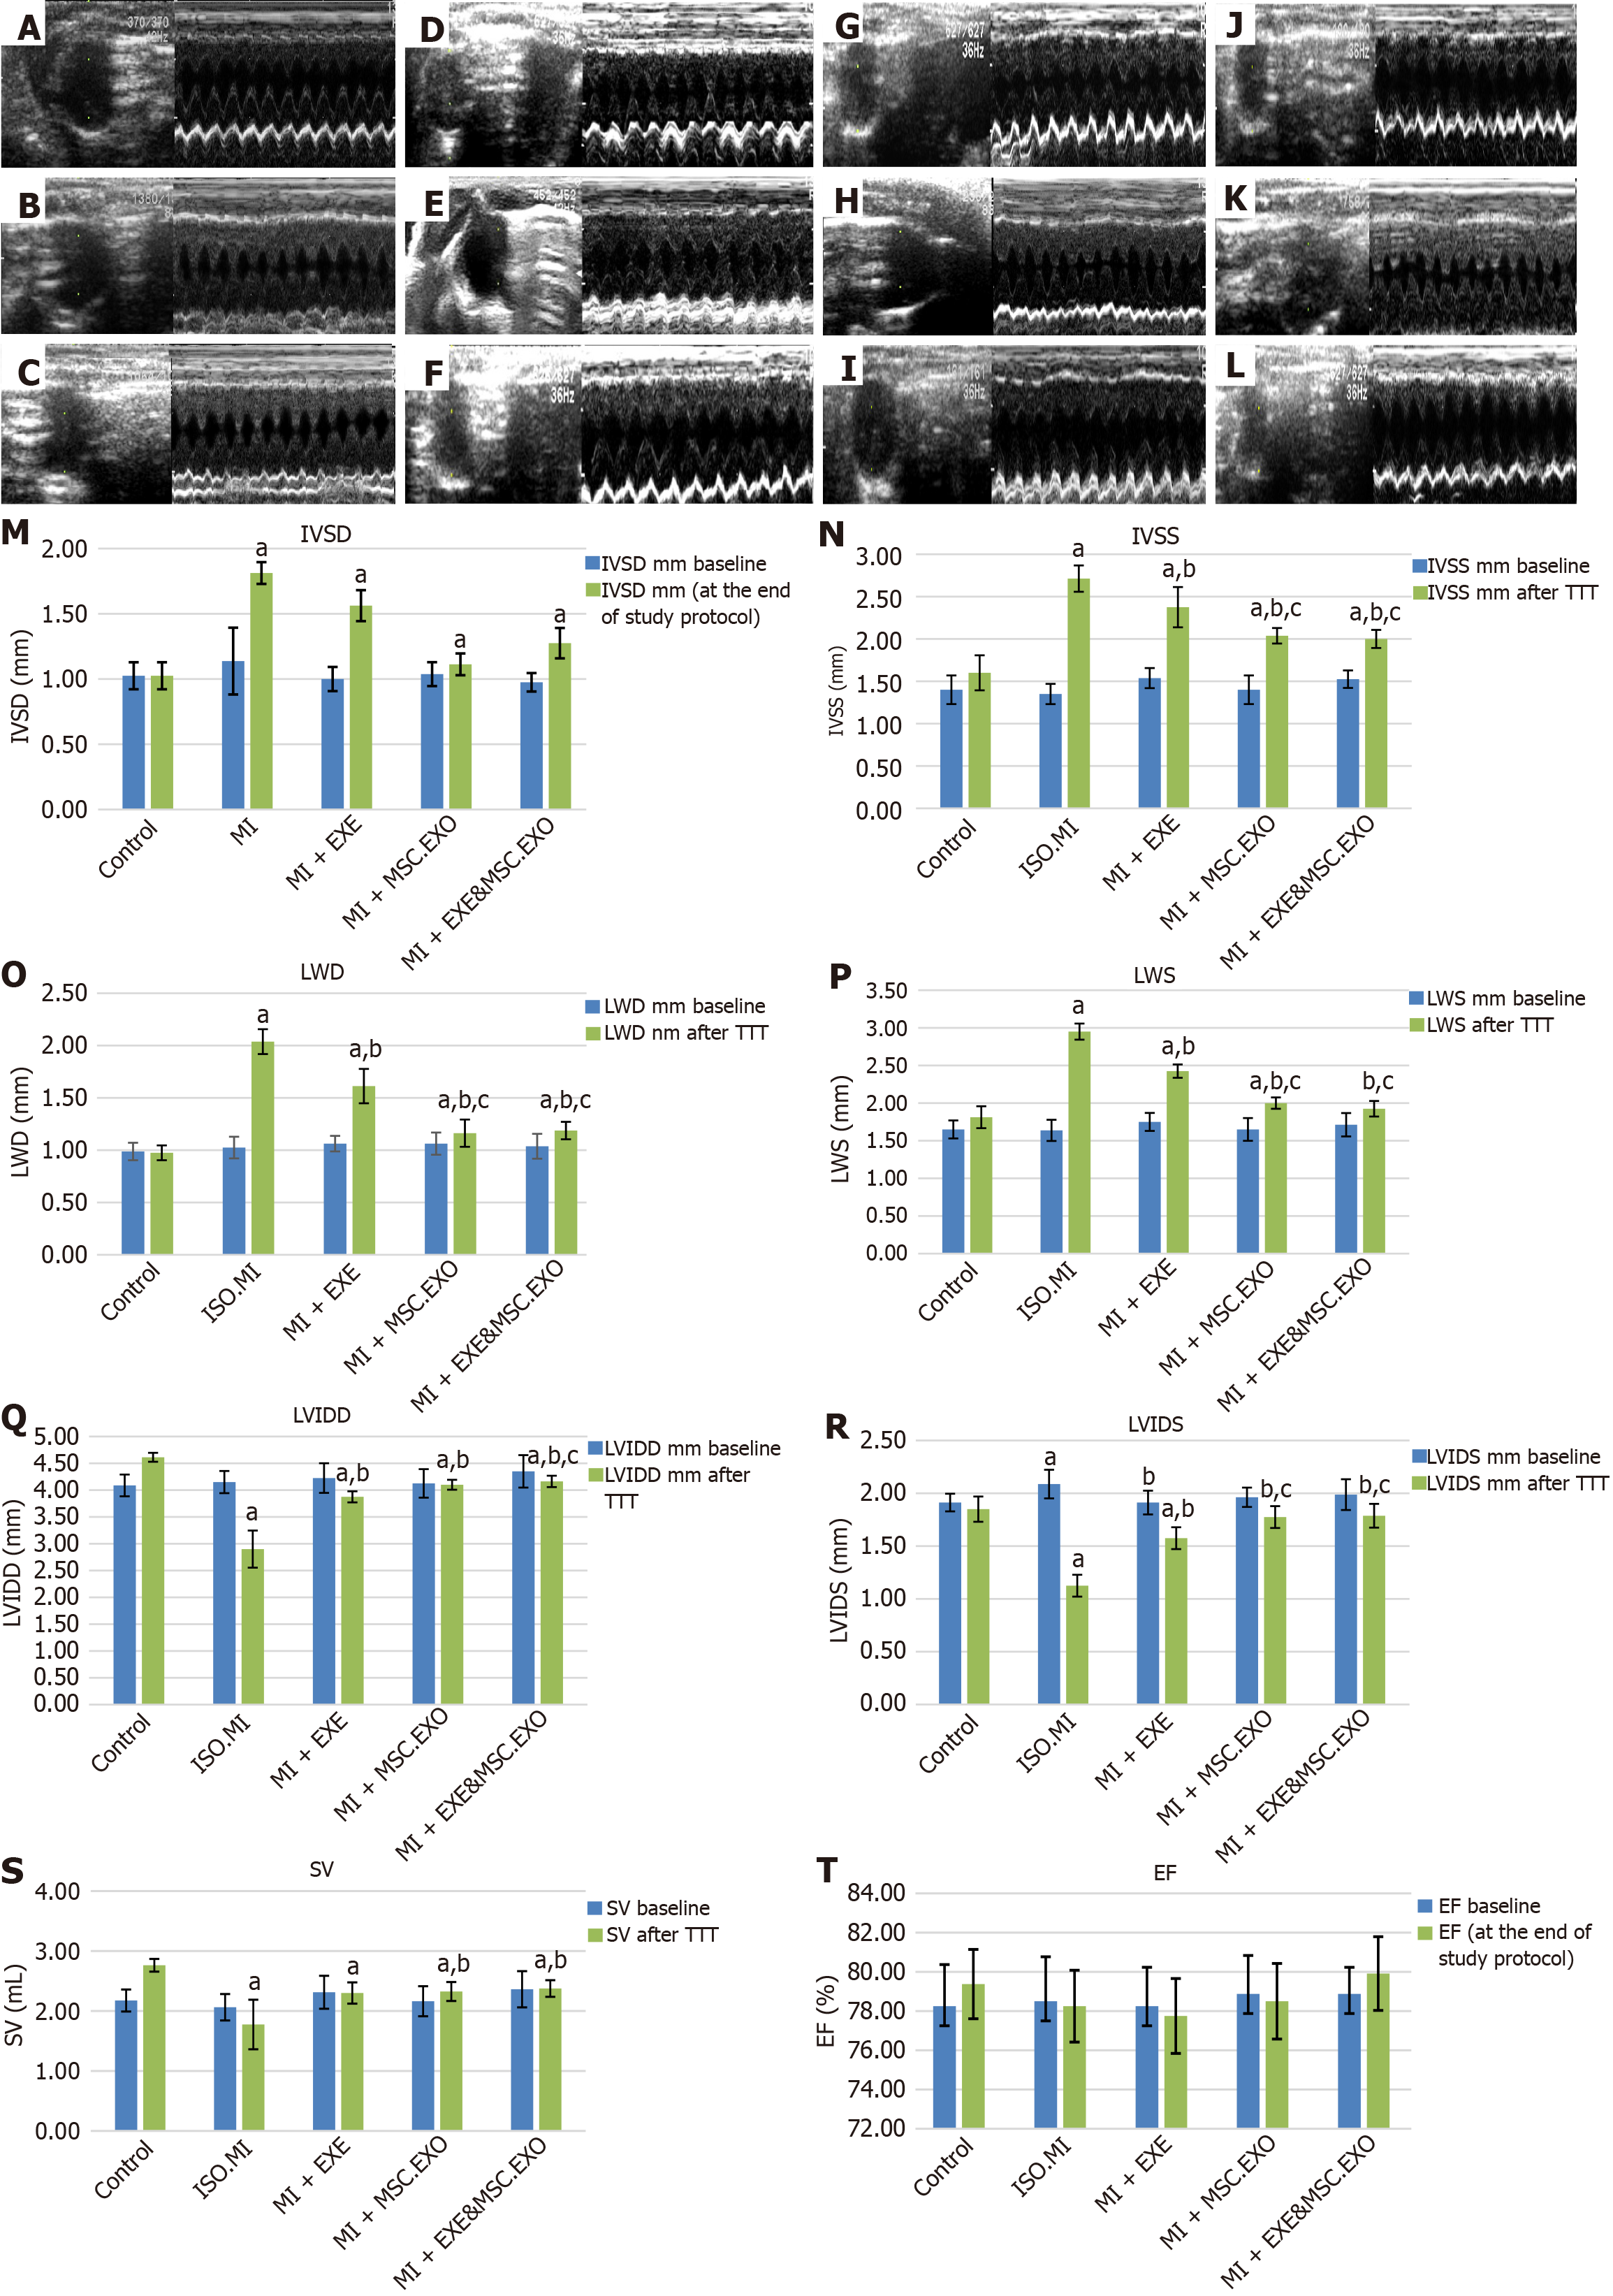
Figure 4 Comparison of different estimated ECHO parameters and quantification of the estimated ECHO parameters.
A-L: Echocardiographic examination guided by right parasternal short-axis view at the level of the papillary muscle (M-mode). ISO + MI group (A-C): At the start, it shows normal septal and free wall thickness in control rats (A), ISO + MI group shows marked septal and free wall hypertrophy (B), after the end of the study protocol, preserved septal and free wall hypertrophy is noticed (C); MI + EXE group (D-F): Showing normal wall thickness (D), marked septal and free wall hypertrophy in group MI + EXE just after induction of MI by ISO (E), septal and free wall hypertrophy subsided after exercise training for 4 weeks (F); MI + MSC-EXO group (G-I): Normal septal and free wall thickness in control rats (G), moderate septal and free wall hypertrophy is noticed in MI + MSC-EXO after induction of MI (H), full regression of the wall is observed after receiving MSC-EXO (I); MI + EXE + MSC-EXO group (J-L): Normal wall thickness in the control group (J), septal and free wall hypertrophy is noticed in MI + EXE + MSC-EXO rats after induction of MI (K), fully regressed after receiving both EXE and MSC-EXO regimen (L); M-T: Quantification of the estimated ECHO parameters: Interventricular septal diameter during diastole (M), interventricular septal diameter during systole (N), lateral wall diameter during diastole (O), lateral wall diameter during systole (P), left ventricular internal diameter during diastole (Q), left ventricular internal diameter during systole (R), stroke volume (S), and ejection fraction% (T). Values represent means ± SD (n = 8). aP < 0.05, compared to the control group, bP < 0.05, compared to ISO + MI group, cP < 0.05, compared to MI + EXE group, dP < 0.05, compared to MI + MSC-EXO group. IVSD: Interventricular septal diameter during diastole; IVSS: Interventricular septal diameter during systole; LWD: Lateral wall diameter during diastole; LWS: Lateral wall diameter during systole; LVIDD: Left ventricular internal diameter during diastole; LVIDS: Left ventricular internal diameter during systole; SV: Stroke volume; EF: Ejection fraction; MSC-EXO: Mesenchymal stem cell-derived exosomes.
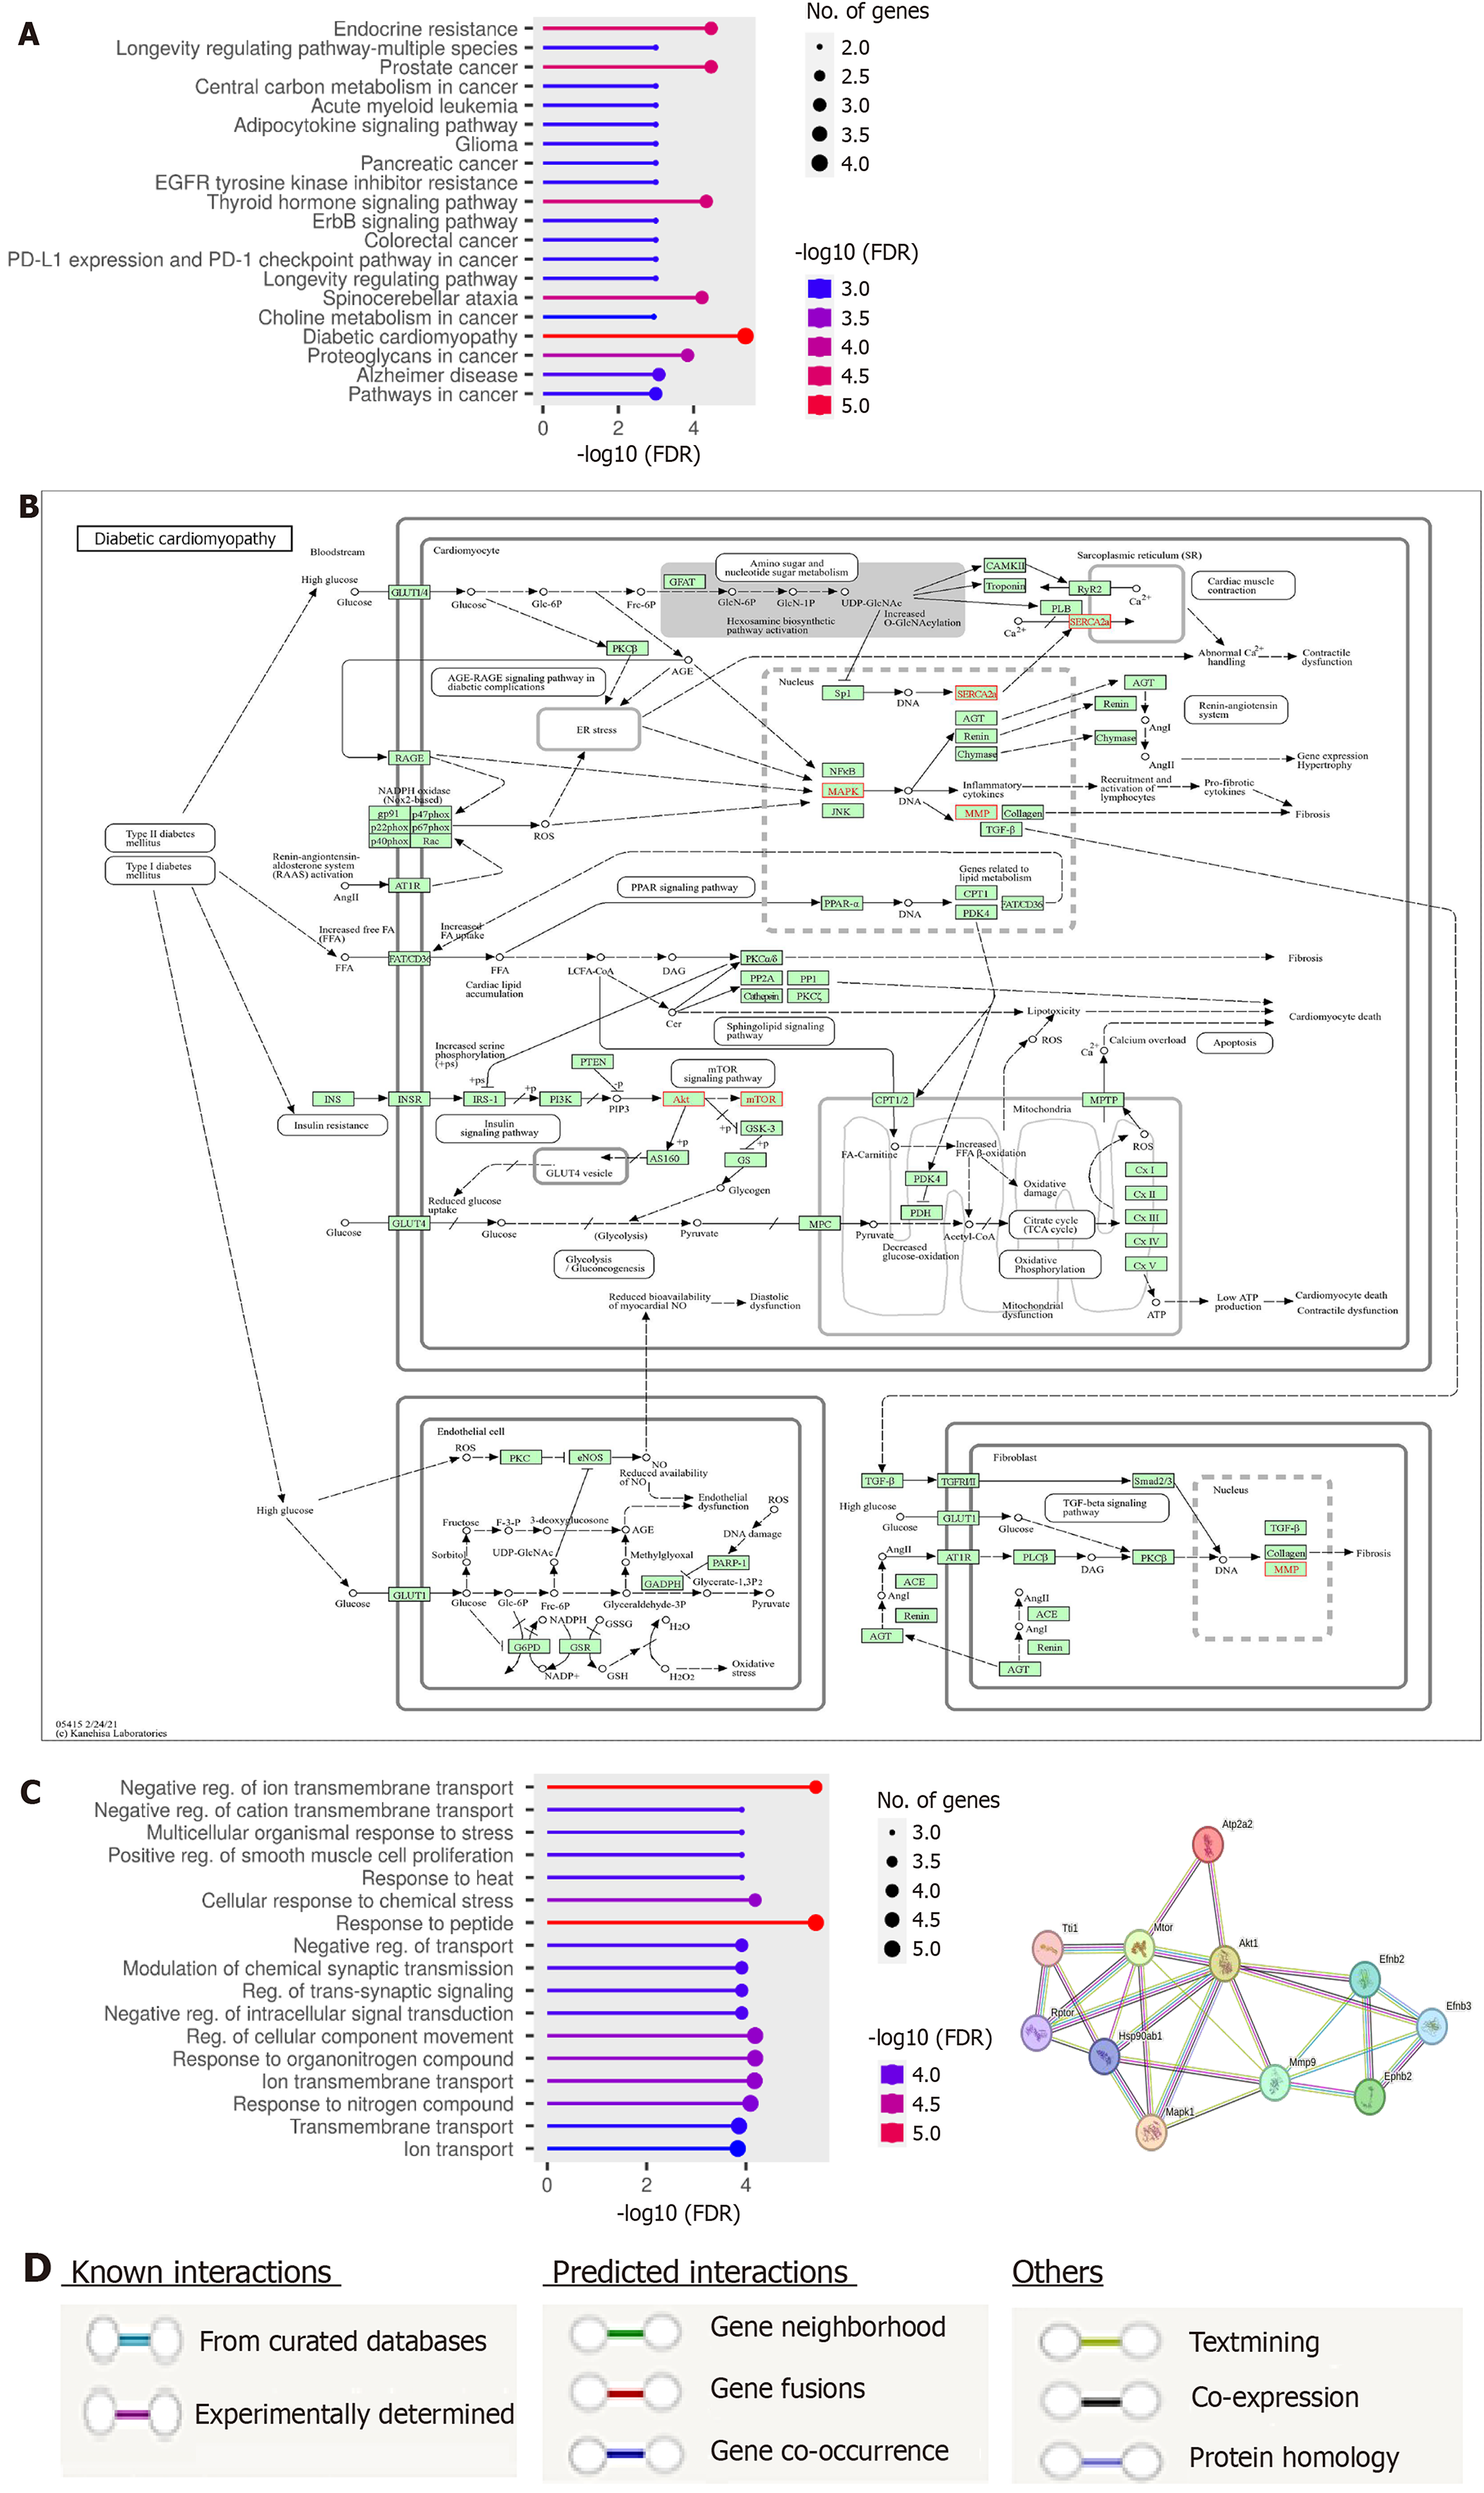
Figure 5 Functional enrichment Gene Ontology and Kyoto Encyclopedia of Genes and Genomes analysis and protein-protein interaction network.
A: Pathway enrichment analysis of target genes; B: Diabetic cardiomyopathy signaling pathway as created by Kyoto Encyclopedia of Genes and Genomes database; C: Gene Ontology enrichment analysis of biological processes of target genes; D: A computational protein interaction analysis of studied proteins. The colored nodes denote the proteins, while the edges signify the protein-protein associations as shown in the legend section. The interacting nodes with hub protein kinase B represents the top ten predicted functional protein partners that include “sarcoplasmic/endoplasmic reticulum calcium ATPase2a”, “mitogen-activated protein kinase 1”, “matrix metalloproteinase”, “ephrin type-B receptor 2”, “mammalian target of rapamycin”, “ephrin-B2; cell surface transmembrane ligand for Eph receptors”, “ephrin-B3; cell surface transmembrane ligand for Eph receptors”, “heat shock protein HSP 90-beta”, “regulatory-associated protein of mammalian target of rapamycin”, and “TELO2-interacting protein 1 homolog”.
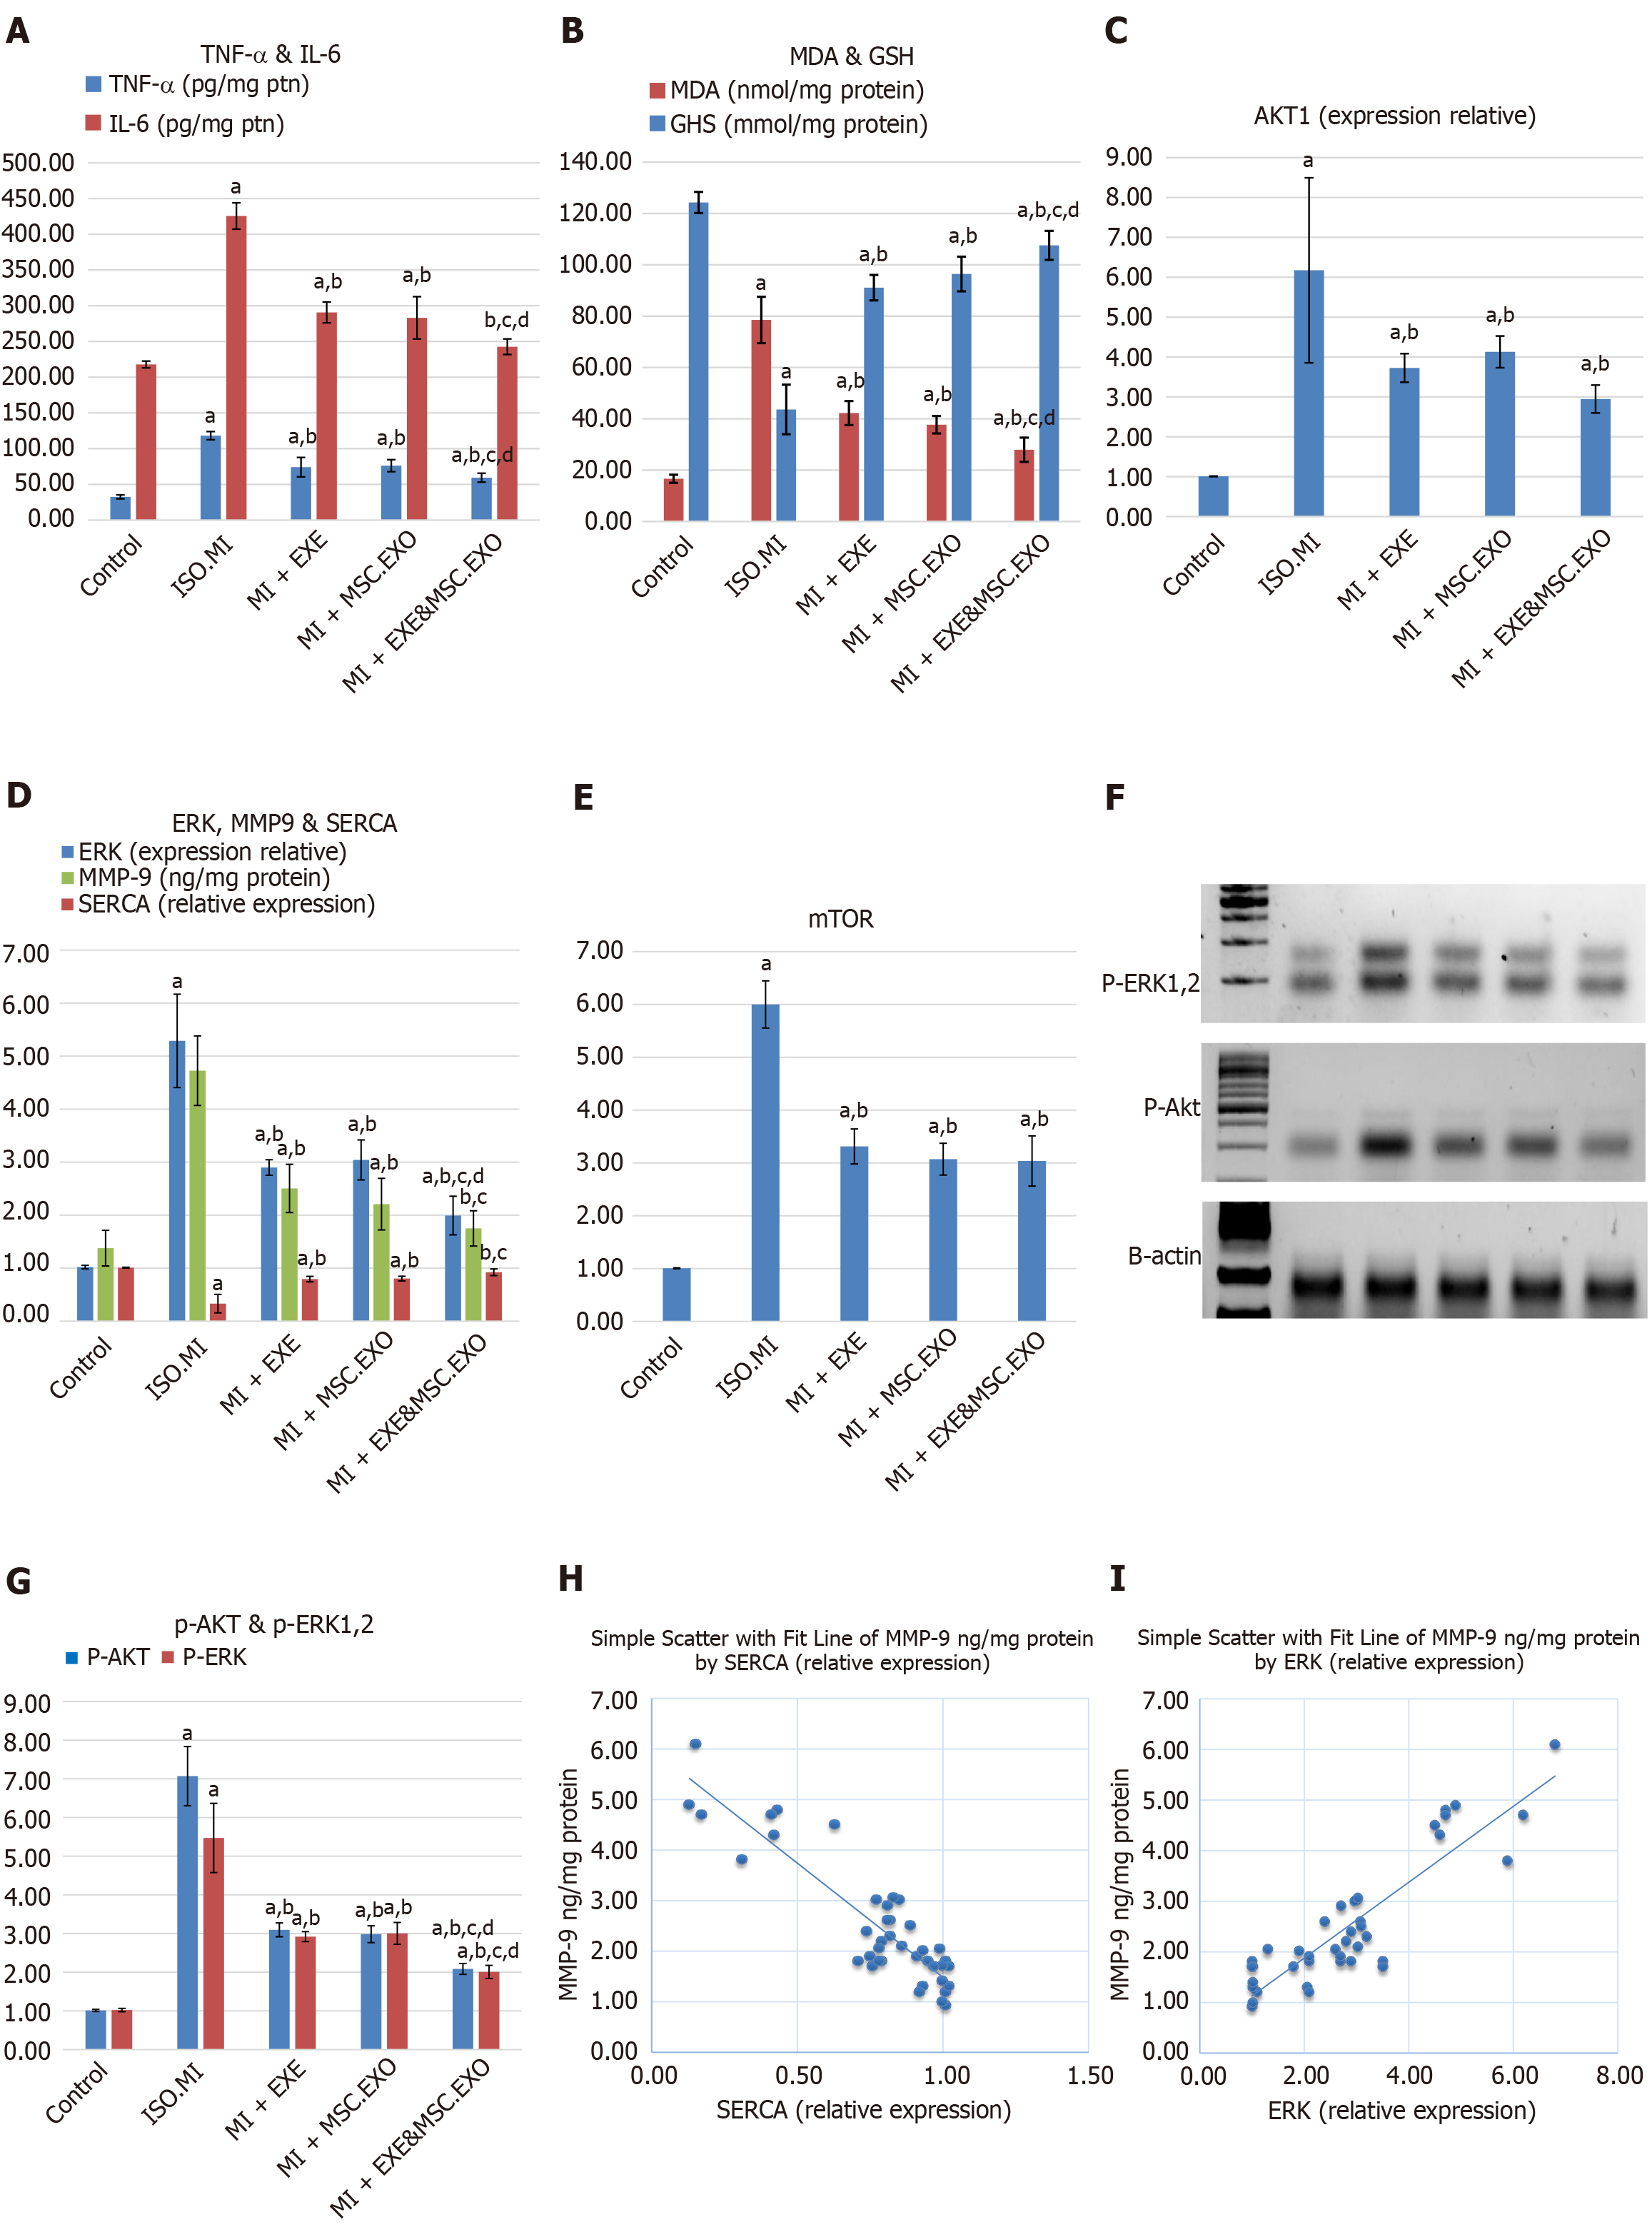
Figure 6 Expression of molecular markers associated with cardiac remodeling.
A: Anti-inflammatory markers (tumor necrosis factor-α and interleukin-6); B: Anti-oxidative markers (malondialdehyde and glutathione); C: Protein kinase B (Akt); D: Extracellular signal-regulated kinase (ERK), matrix metalloproteinase 9 (MMP9) and sarcoplasmic endoplasmic reticulum calcium ATPase type 2a (SERCA2a); E: Mammalian target of rapamycin gene expression; F: Protein bands of p-ERK1/2, p-Akt, and beta-actin (internal housekeeping protein); G: The protein levels of p-ERK1/2, and p-Akt in all studied groups; H: A negative correlation between SERCA2a and MMP9; I: A strong positive correlation between MMP9 and ERK levels. Values represent means ± SD (n = 8) aP < 0.05, compared the control group; bP < 0.05, compared to ISO + MI; cP < 0.05, compared to MI + EXE; dP < 0.05, compared to in MI + MSC-EXO. TNF: Tumor necrosis factor; IL: Interleukin; MDA: Malondialdehyde; GSH: Glutathione; AKT: Protein kinase B; ERK: Extracellular signal-regulated kinase; MMP9: Matrix metalloproteinase 9; SERCA2a: Sarcoplasmic endoplasmic reticulum calcium ATPase type 2a; mTOR: Mammalian target of rapamycin; MSC-EXO: Mesenchymal stem cell-derived exosomes.
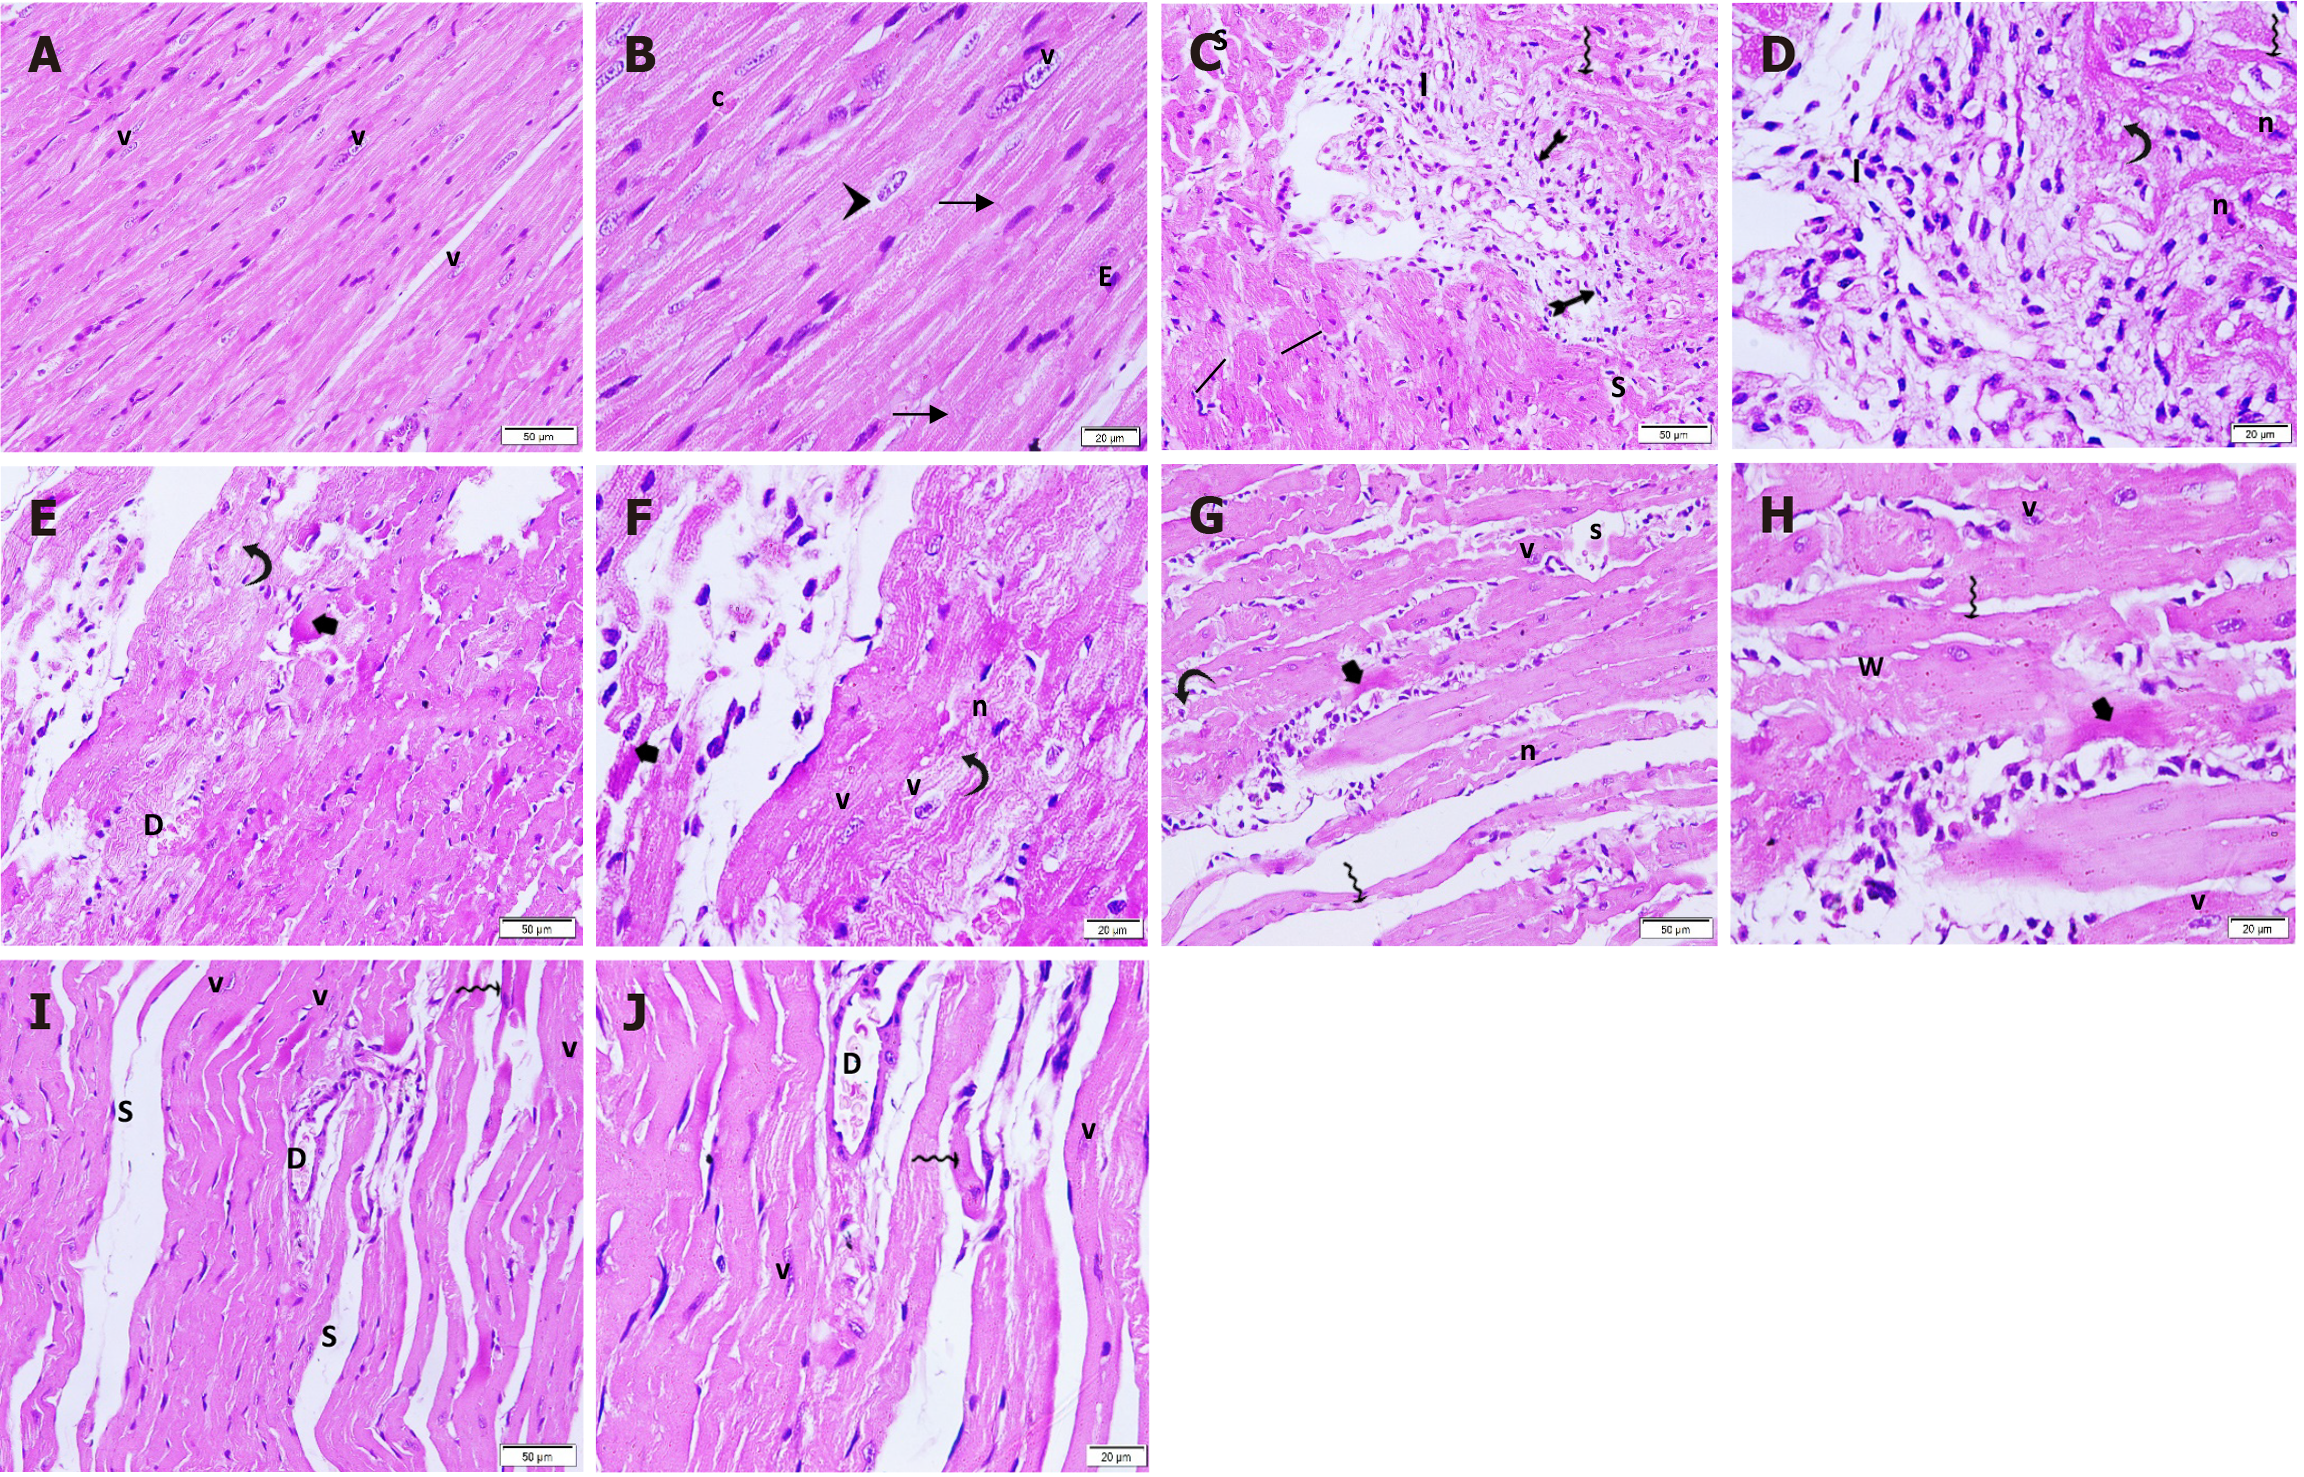
Figure 7 Hematoxylin and eosin-stained longitudinal sections in the cardiac tissue in different groups.
A and B: Control group: Branching muscle fibers with striated acidophilic cytoplasm. The delicate connective tissue in between the muscle fibers contain blood capillaries; C and D: ISO + MI group: Large focal intramural pale stained-area infiltrated with mononuclear cells and fibroblast illustrating spindle-shaped flattened nuclei. The surrounding muscle fibers show increased diameter; E and F: MI + EXE group: A small focal area of fragmented muscle fibers with few intercellular mononuclear cell infiltrations. Surrounding viable muscle fibers are noted while others display a wavy appearance; G and H: MI + MSC-EXO group: A small focal area of degenerated muscle fibers with few intercellular mononuclear cell infiltrations is noted surrounded by some viable muscle fibers; I and J: MI + EXE + MSC-EXO group: Few thinned-out muscle fibers with separation in-between are noted surrounded by many viable closely and regularly adjusted cardio-myocytes (magnifications A, C, E, G and I: 200 ×; B, D, F, H and J: 400 ×). v: Vesicular nuclei; arrowhead: Perinuclear pale area; arrow: Intercalated discs; c: Blood capillaries; E: Endothelium; I: Inflammatory infiltration; bifid arrow: Fibroblast; wavy arrow: Thinned-out muscle fibers; line segment: Dilated muscle fibers; curved arrow: Vacuolated cytoplasm; n: Dark shrunken nuclei; S: Separation; short arrow: Dense acidophilic cytoplasm; w: Wavy muscle fibers; D: Dilated blood vessel.
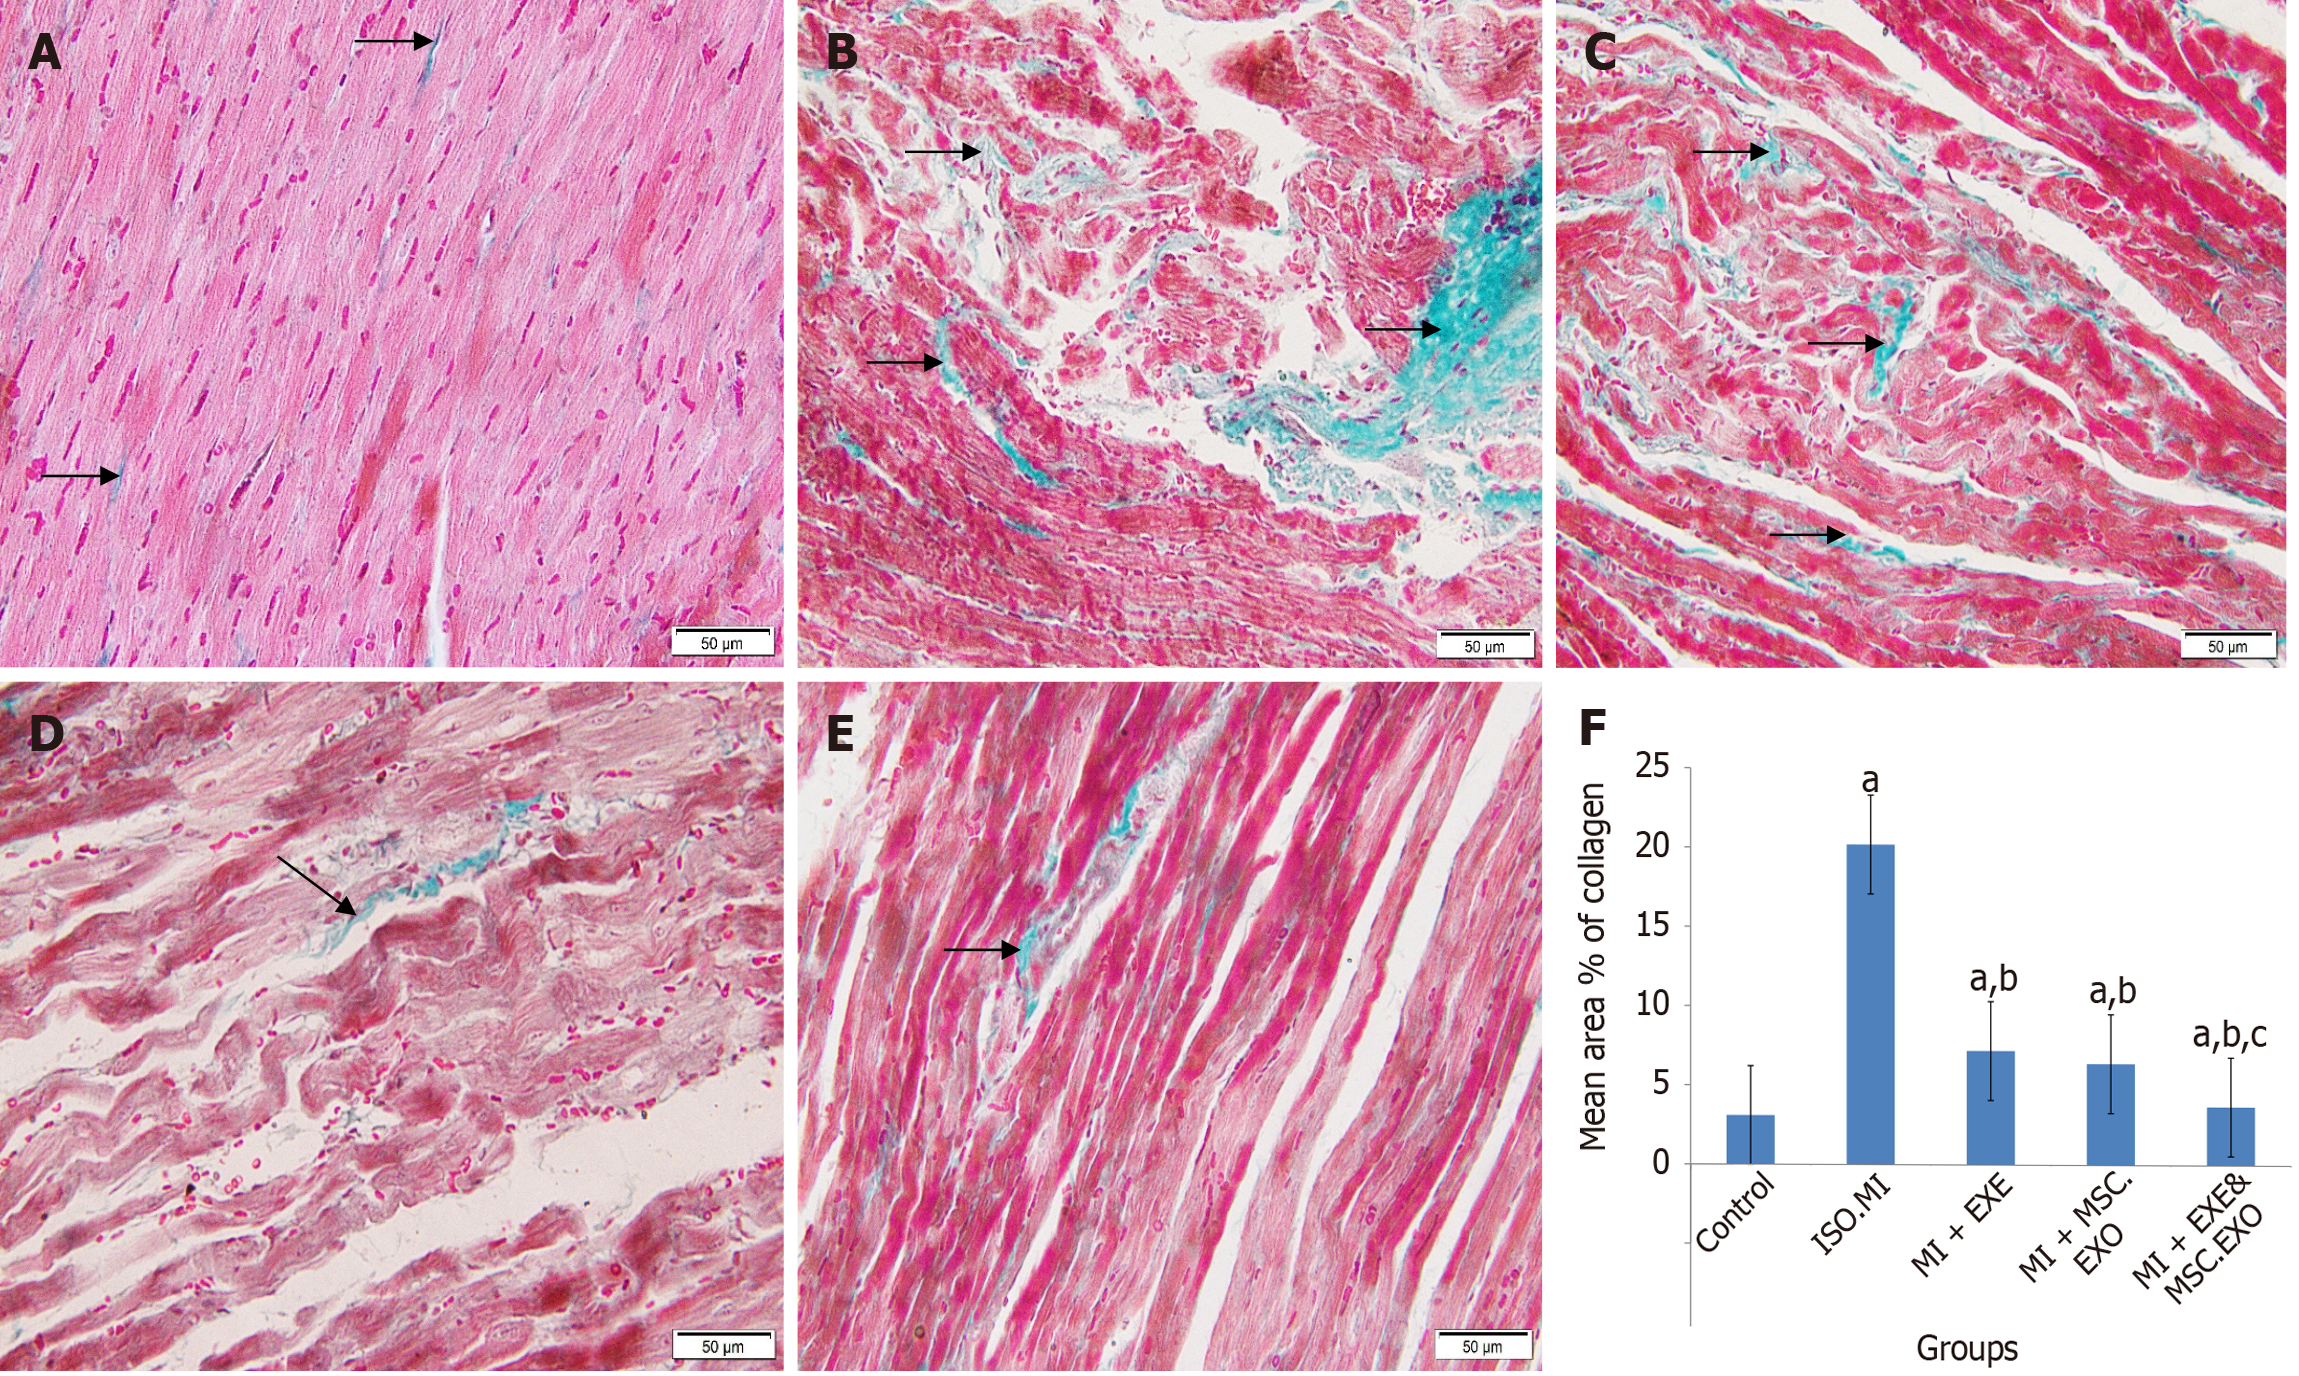
Figure 8 Masson’s trichrome-stained longitudinal sections in the cardiac tissue.
A: Control group: Fine collagen deposition (arrow) in-between cardiac muscle fibers (magnification 200 ×); B: ISO + MI group: Area of extensive fibrous tissue (star) besides scattered coarse collagen deposition (arrow) in-between the surrounding muscle fibers (magnification 200 ×); C: MI + EXE group: Scattered coarse collagen deposition (arrow) between the muscle fibers (magnification 200 ×); D: MI + MSC-EXO group a small area of minimal collagen deposition (arrow) (magnification 200 ×); E: MI + EXE + MSC-EXO group: A small area of minimal collagen deposition (arrow) (magnification 200 ×); F: The mean ± SD area% of collagen deposition. aP < 0.05, compared to the control group; bP < 0.05, compared to ISO + MI group; cP < 0.05, compared to MI + EXE and MI + MSC-EXO groups. MSC-EXO: Mesenchymal stem cell-derived exosomes.
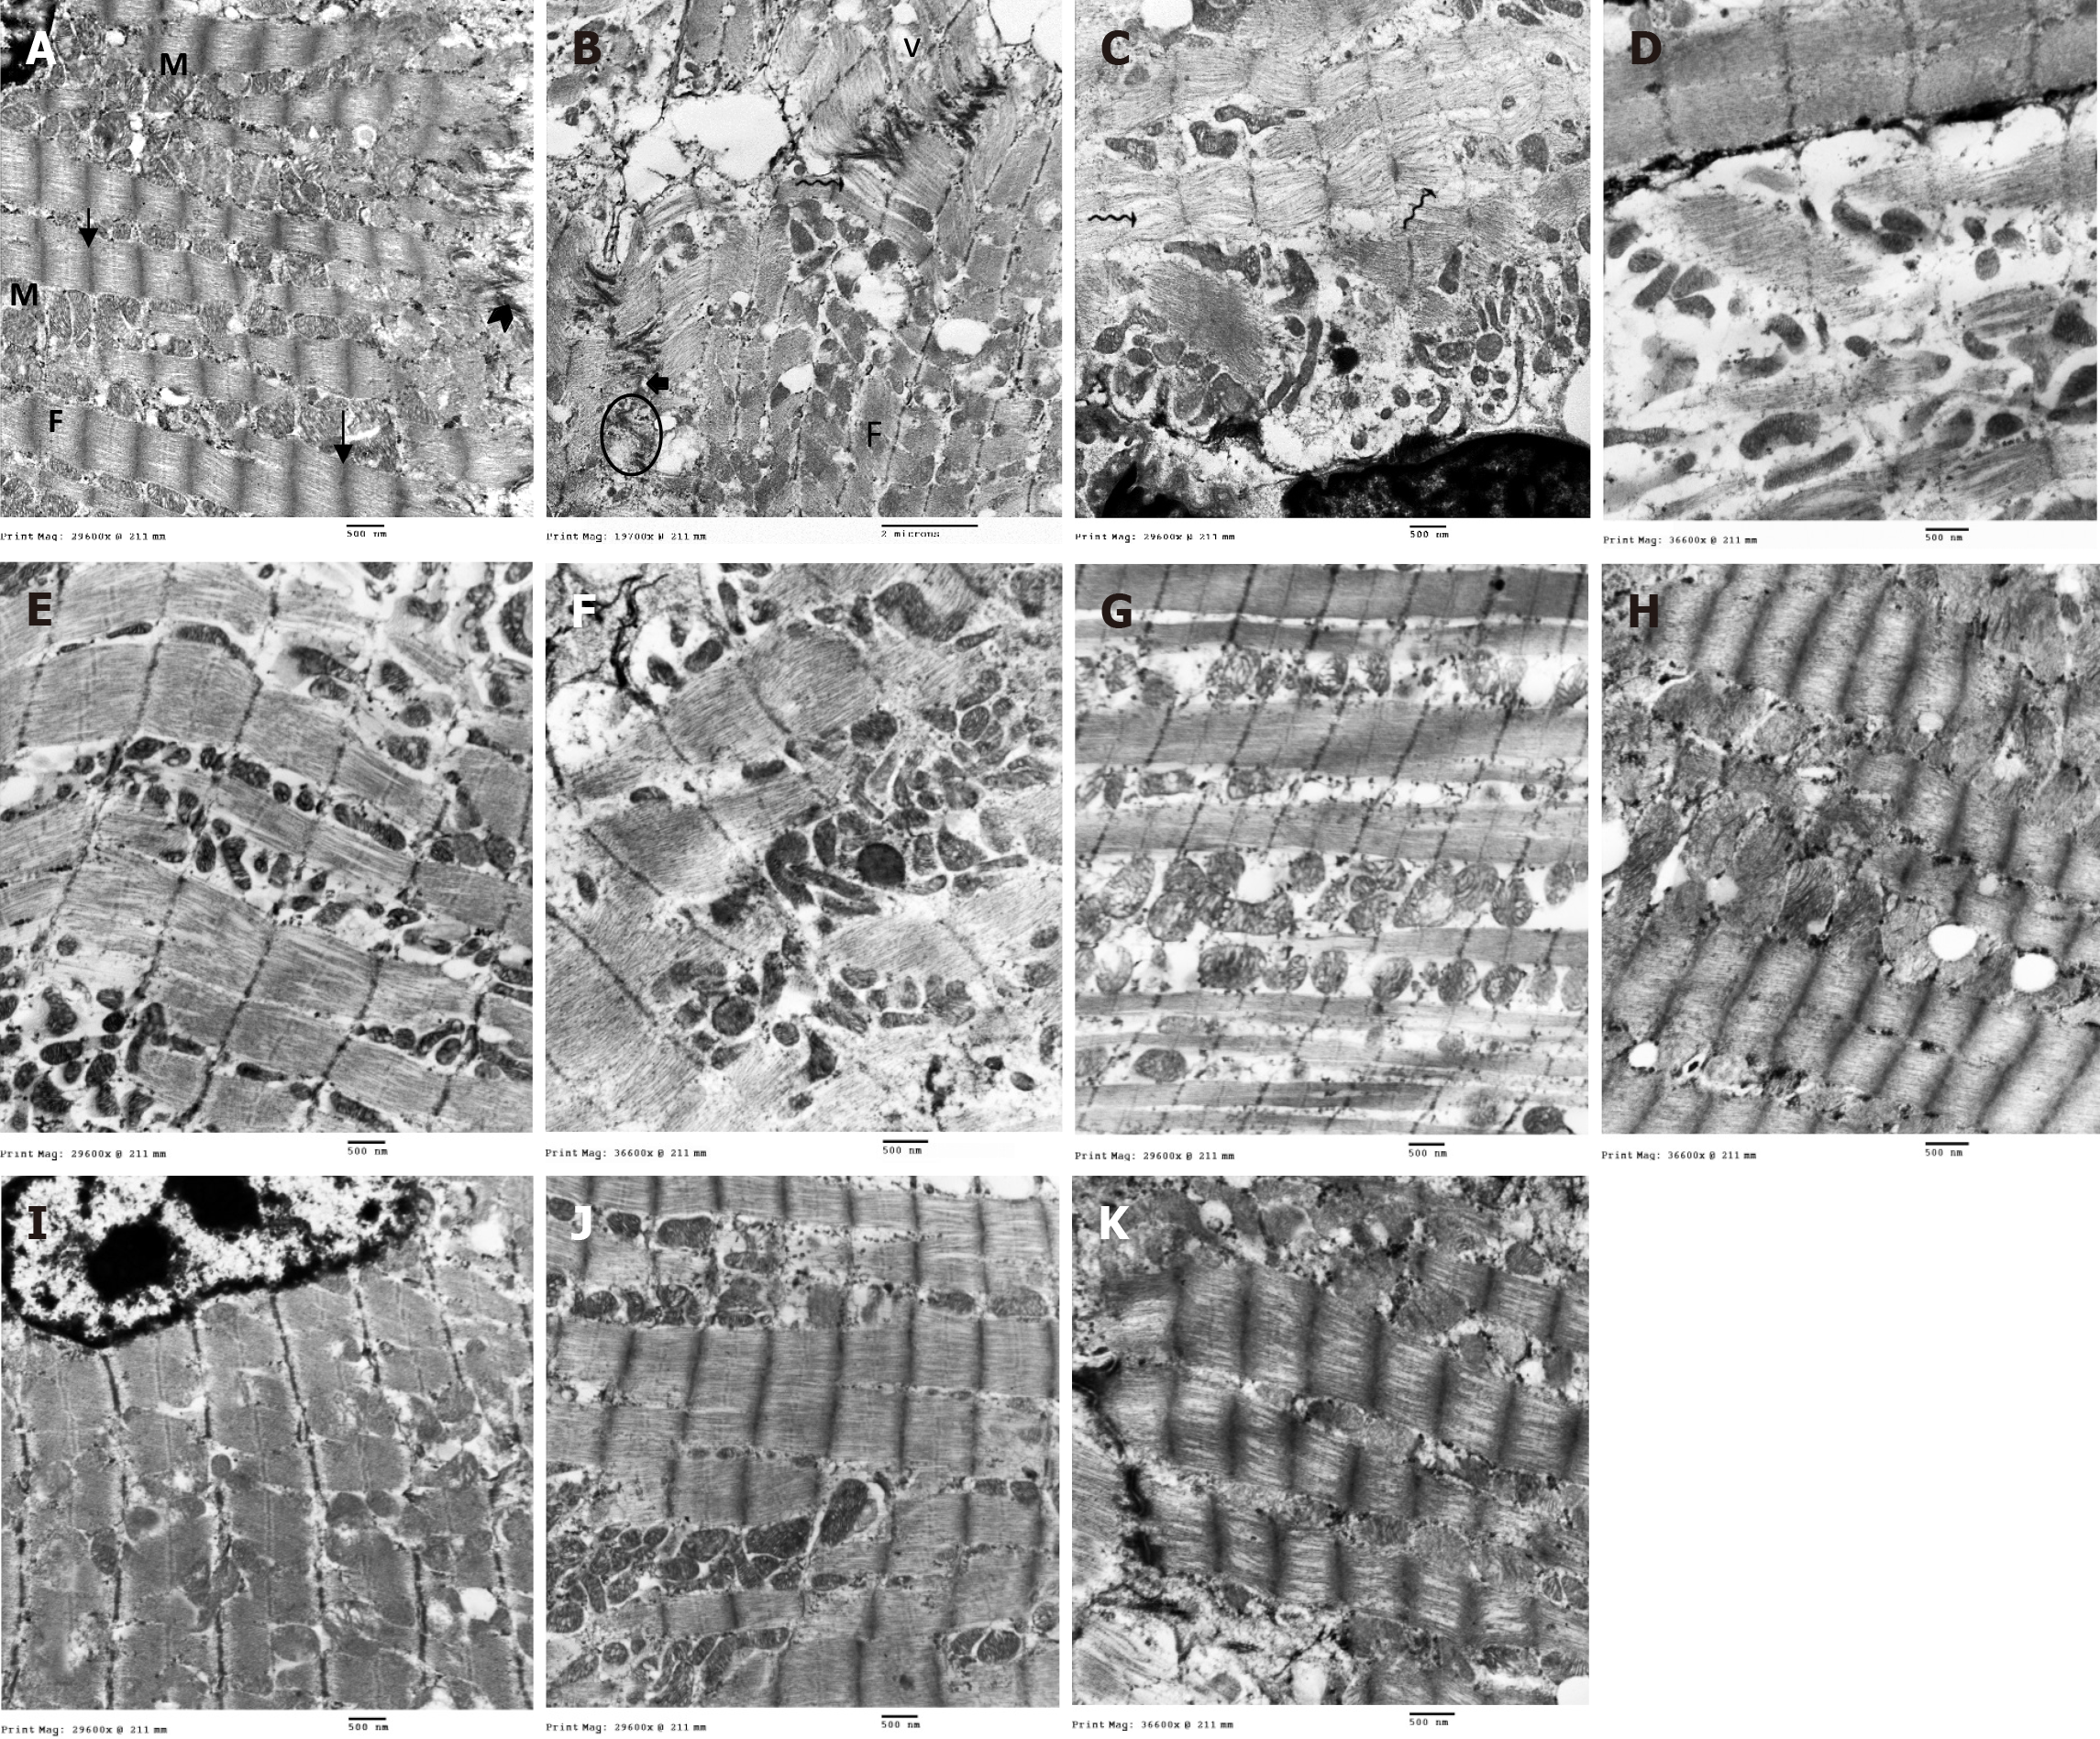
Figure 9 Ultrastructure of cardiac muscle fibers in different groups.
A: Control group: Normal mitochondrial (M) distribution in linear arrays alongside the myofibrils. Mitochondria are electron dense with tightly packed tubular cristae. Myofibrils (F) being formed of regular sarcomeres separated by Z lines (arrow) and attached to the transverse portion of the intercalated disc (arrowhead); B-D: ISO + MI group: Markedly irregular myofibrils (F) with separation of myofilaments and in-between the myofilaments (wavy arrow), numerous irregular and bizarre-shaped mitochondria (M) with extensive disruption of mitochondrial cristae, large vacuolations (v), widening of sarcoplasmic reticulum tubules (curved arrow), desmosome paleness and widening of adherens junction gaps (short arrow), clumping of nuclear chromatin (N), widening of sub-sarcolemma; E and F: MI + EXE group: Closely packed myofibrils with regular sarcomeres and mitochondria arranged in-between; some of them with disrupted cristae others with irregular shapes, sub-sarcolemmal widening, and areas of focal loss of some myofilaments; G and H: MI + MSC-EXO group: Closely packed myofibrils with regular sarcomeres, yet swollen mitochondria (M), dilated sarcoplasmic reticulum cisternae (curved arrow) and some glycogen granules are noted; I-K: MI + EXE + MSC-EXO group: Closely packed myofibrils with regular sarcomeres and attached to the transverse portion of the intercalated disc, numerous mitochondria filled with intact cristae and abundant glycogen granules (magnifications A, C, E, G and I: 12000 ×; B: 8000 ×; D, F, H and J: 15000 ×).
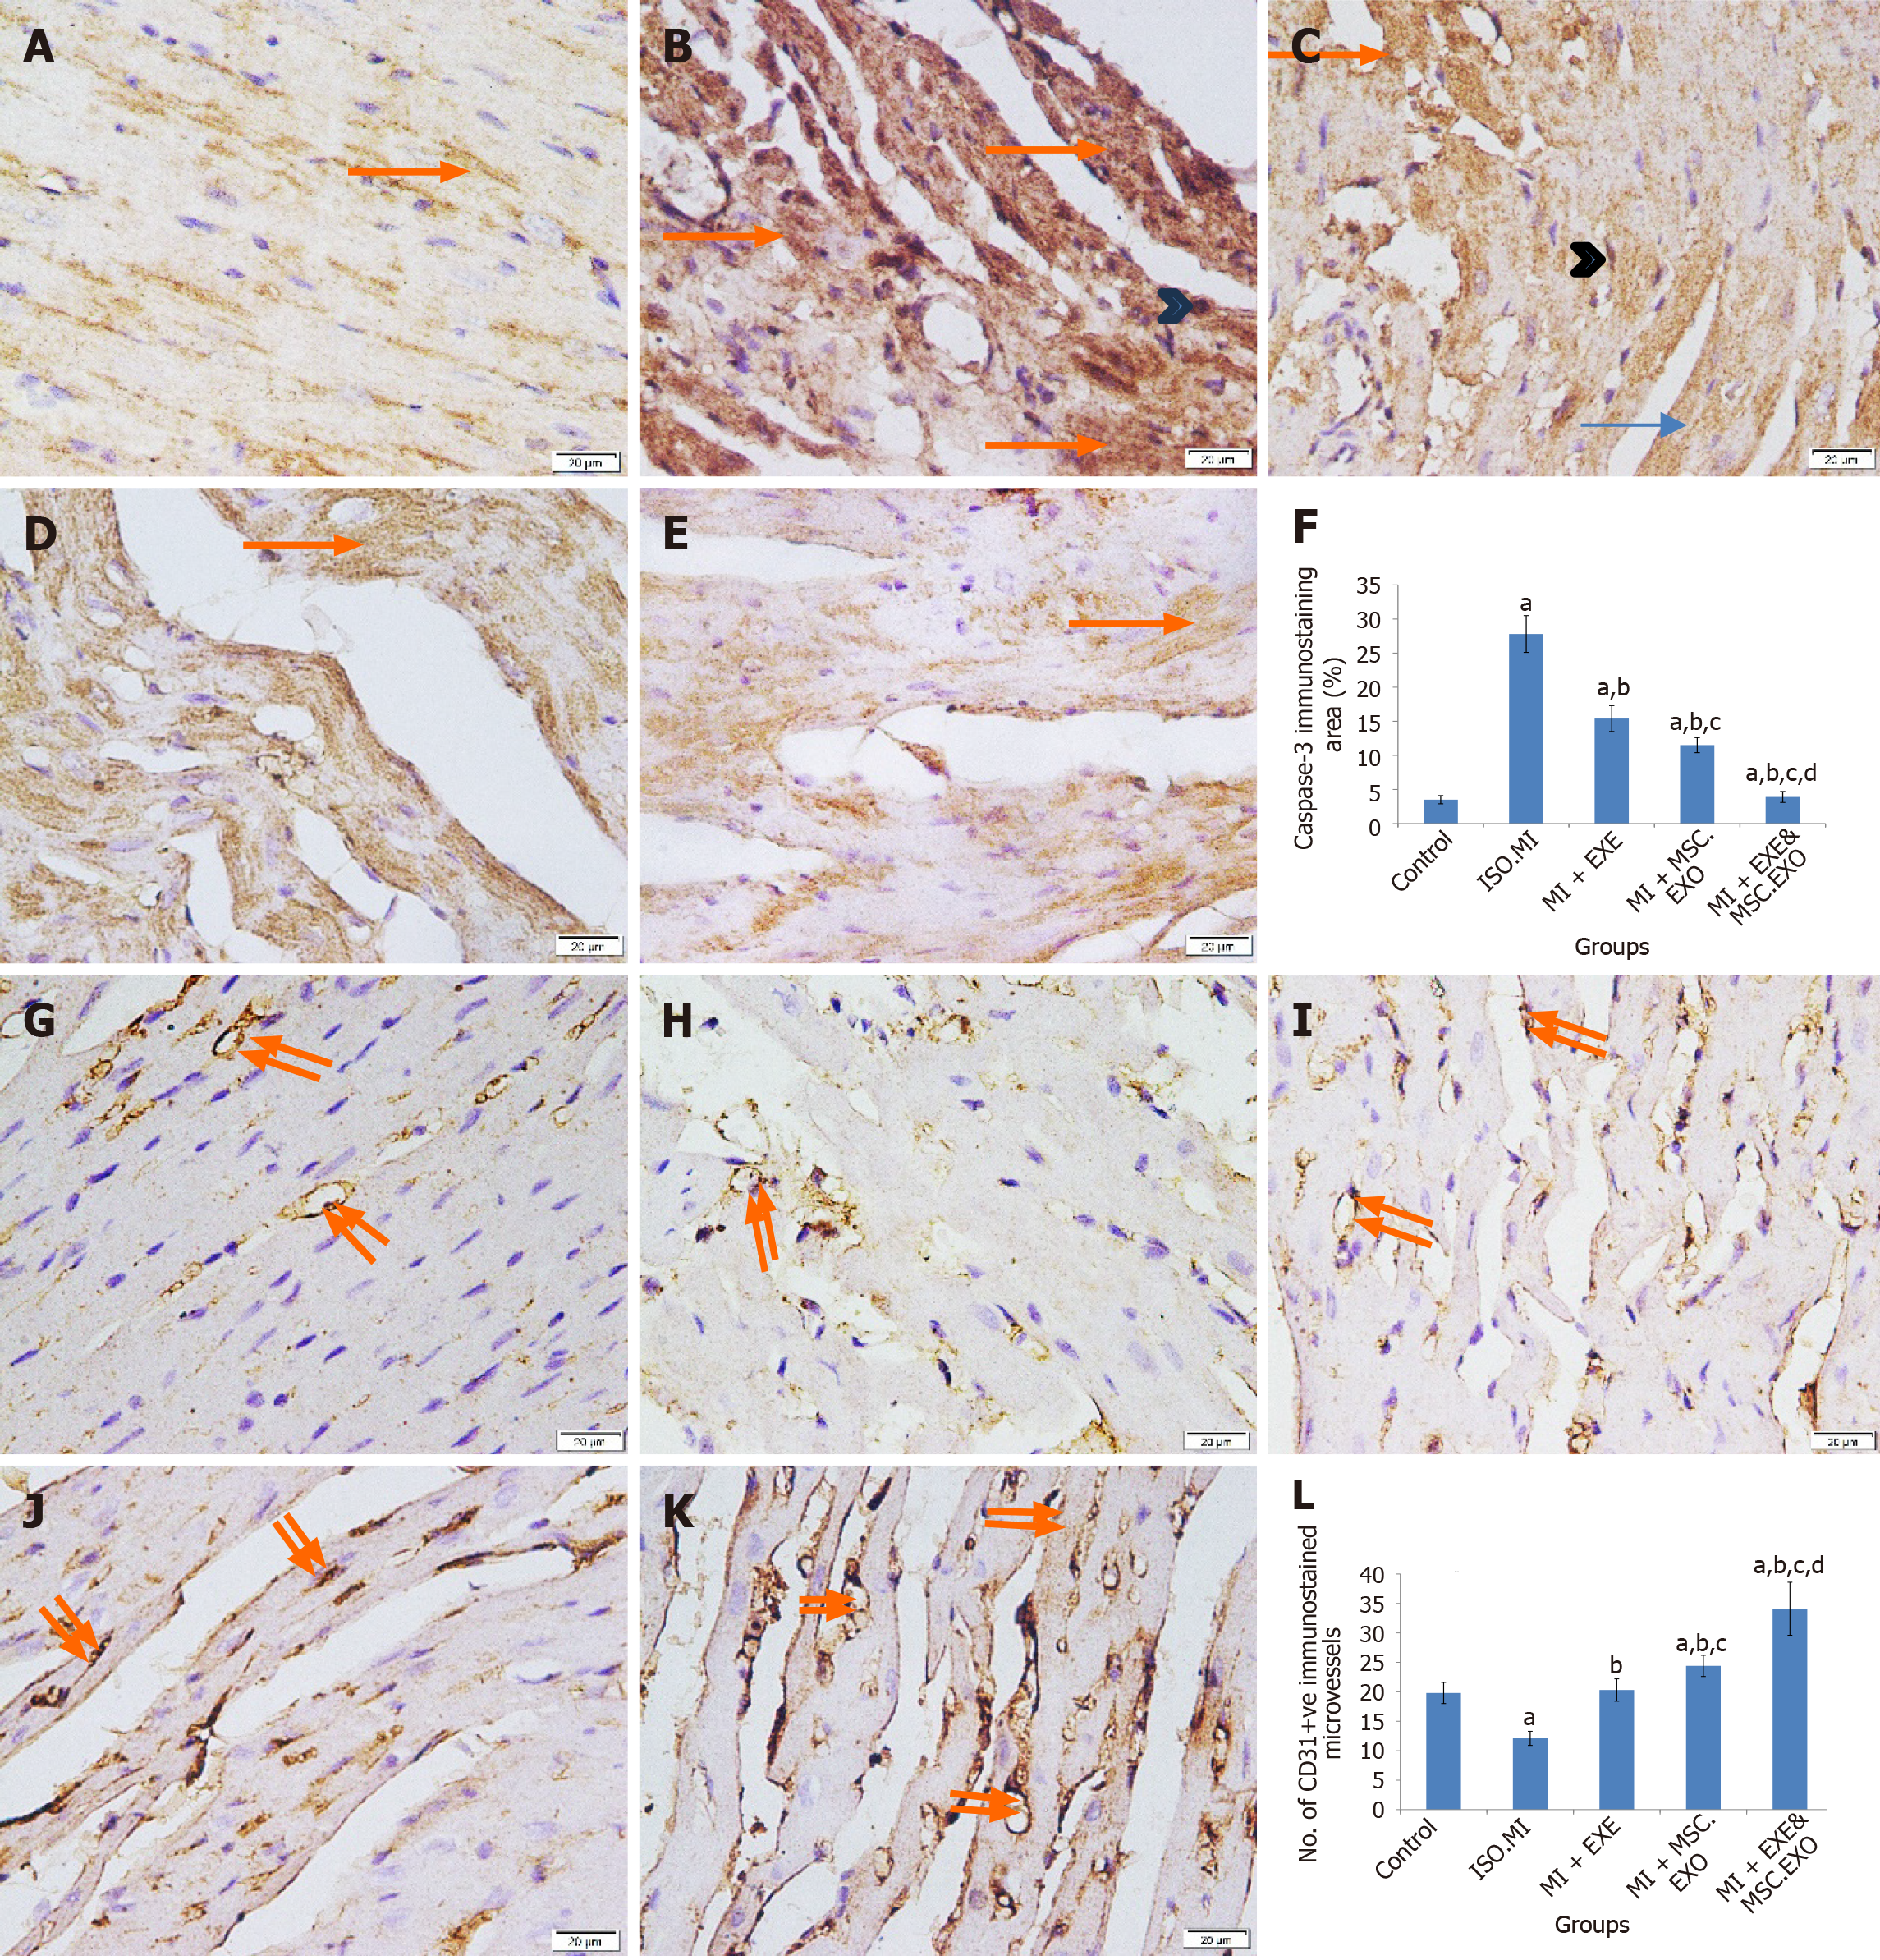
Figure 10 Immunohistochemistry in the cardiac muscle for caspase-3 and CD31.
A: Immunohistochemistry in the cardiac muscle (400 ×) for caspase-3 in control group: Minimal weak caspase-3+ cytoplasmic immunostaining; B: Immunohistochemistry in the cardiac muscle (400 ×) for caspase-3 in ISO + MI group: Widespread strong caspase-3+ cytoplasmic and nuclear immunostaining; C: Immunohistochemistry in the cardiac muscle (400 ×) for caspase-3 in MI + EXE group: Moderate caspase-3+ cytoplasmic and nuclear immunostaining; D: Immunohistochemistry in the cardiac muscle (400 ×) for caspase-3 in MI + MSC-EXO group: Mild caspase-3+ cytoplasmic immunostaining; E: Immunohistochemistry in the cardiac muscle (400 ×) for caspase-3 in MI + EXE + MSC-EXO group: Minimal caspase-3+ cytoplasmic immunostaining; F: The mean (± SD) area% of caspase-3 immunostaining; G: Immunohistochemistry in the cardiac muscle (400 ×) for CD31 in control group: Some CD31+ microvessels; H: Immunohistochemistry in the cardiac muscle (400 ×) for CD31 in ISO + MI group: Very few CD31+ microvessels; I: Immunohistochemistry in the cardiac muscle (400 ×) for CD31 in MI + EXE group: Many CD31+ microvessels; J: Immunohistochemistry in the cardiac muscle (400 ×) for CD31 in MI + MSC-EXO group: Many CD31+ microvessels; K: Immunohistochemistry in the cardiac muscle (400 ×) for CD31 in MI + EXE + MSC-EXO group: Numerous CD31+ microvessels; L: The mean (± SD) number of CD31+ immunostained newly synthesized microvessels. aP < 0.05, compared to the control; bP < 0.05, compared to ISO + MI group; cP < 0.05, compared to MI + EXE; dP < 0.05, compared to the MI + MSC-EXO group. Arrow: Cytoplasmic caspase-3 immunostaining; arrowhead: Nuclear immunostaining; double arrows: CD31+ microvessels.
- Citation: ShamsEldeen AM, AbdElalim MM, Mohamed NS, AbdelRahman MM, Kamar SS, AbdelKader DH, Elsharkawy SH, Rashed LA, Faisal SS, Osman WA, Selmy AM. Mesenchymal stem-derived exosomes enhance therapeutic benefits of exercise in isoproterenol-induced myocardial ischemia: Targeting ERK and Akt/mTOR signaling. World J Stem Cells 2025; 17(10): 109862
- URL: https://www.wjgnet.com/1948-0210/full/v17/i10/109862.htm
- DOI: https://dx.doi.org/10.4252/wjsc.v17.i10.109862


