Copyright
©The Author(s) 2021.
World J Clin Cases. Nov 16, 2021; 9(32): 9970-9976
Published online Nov 16, 2021. doi: 10.12998/wjcc.v9.i32.9970
Published online Nov 16, 2021. doi: 10.12998/wjcc.v9.i32.9970
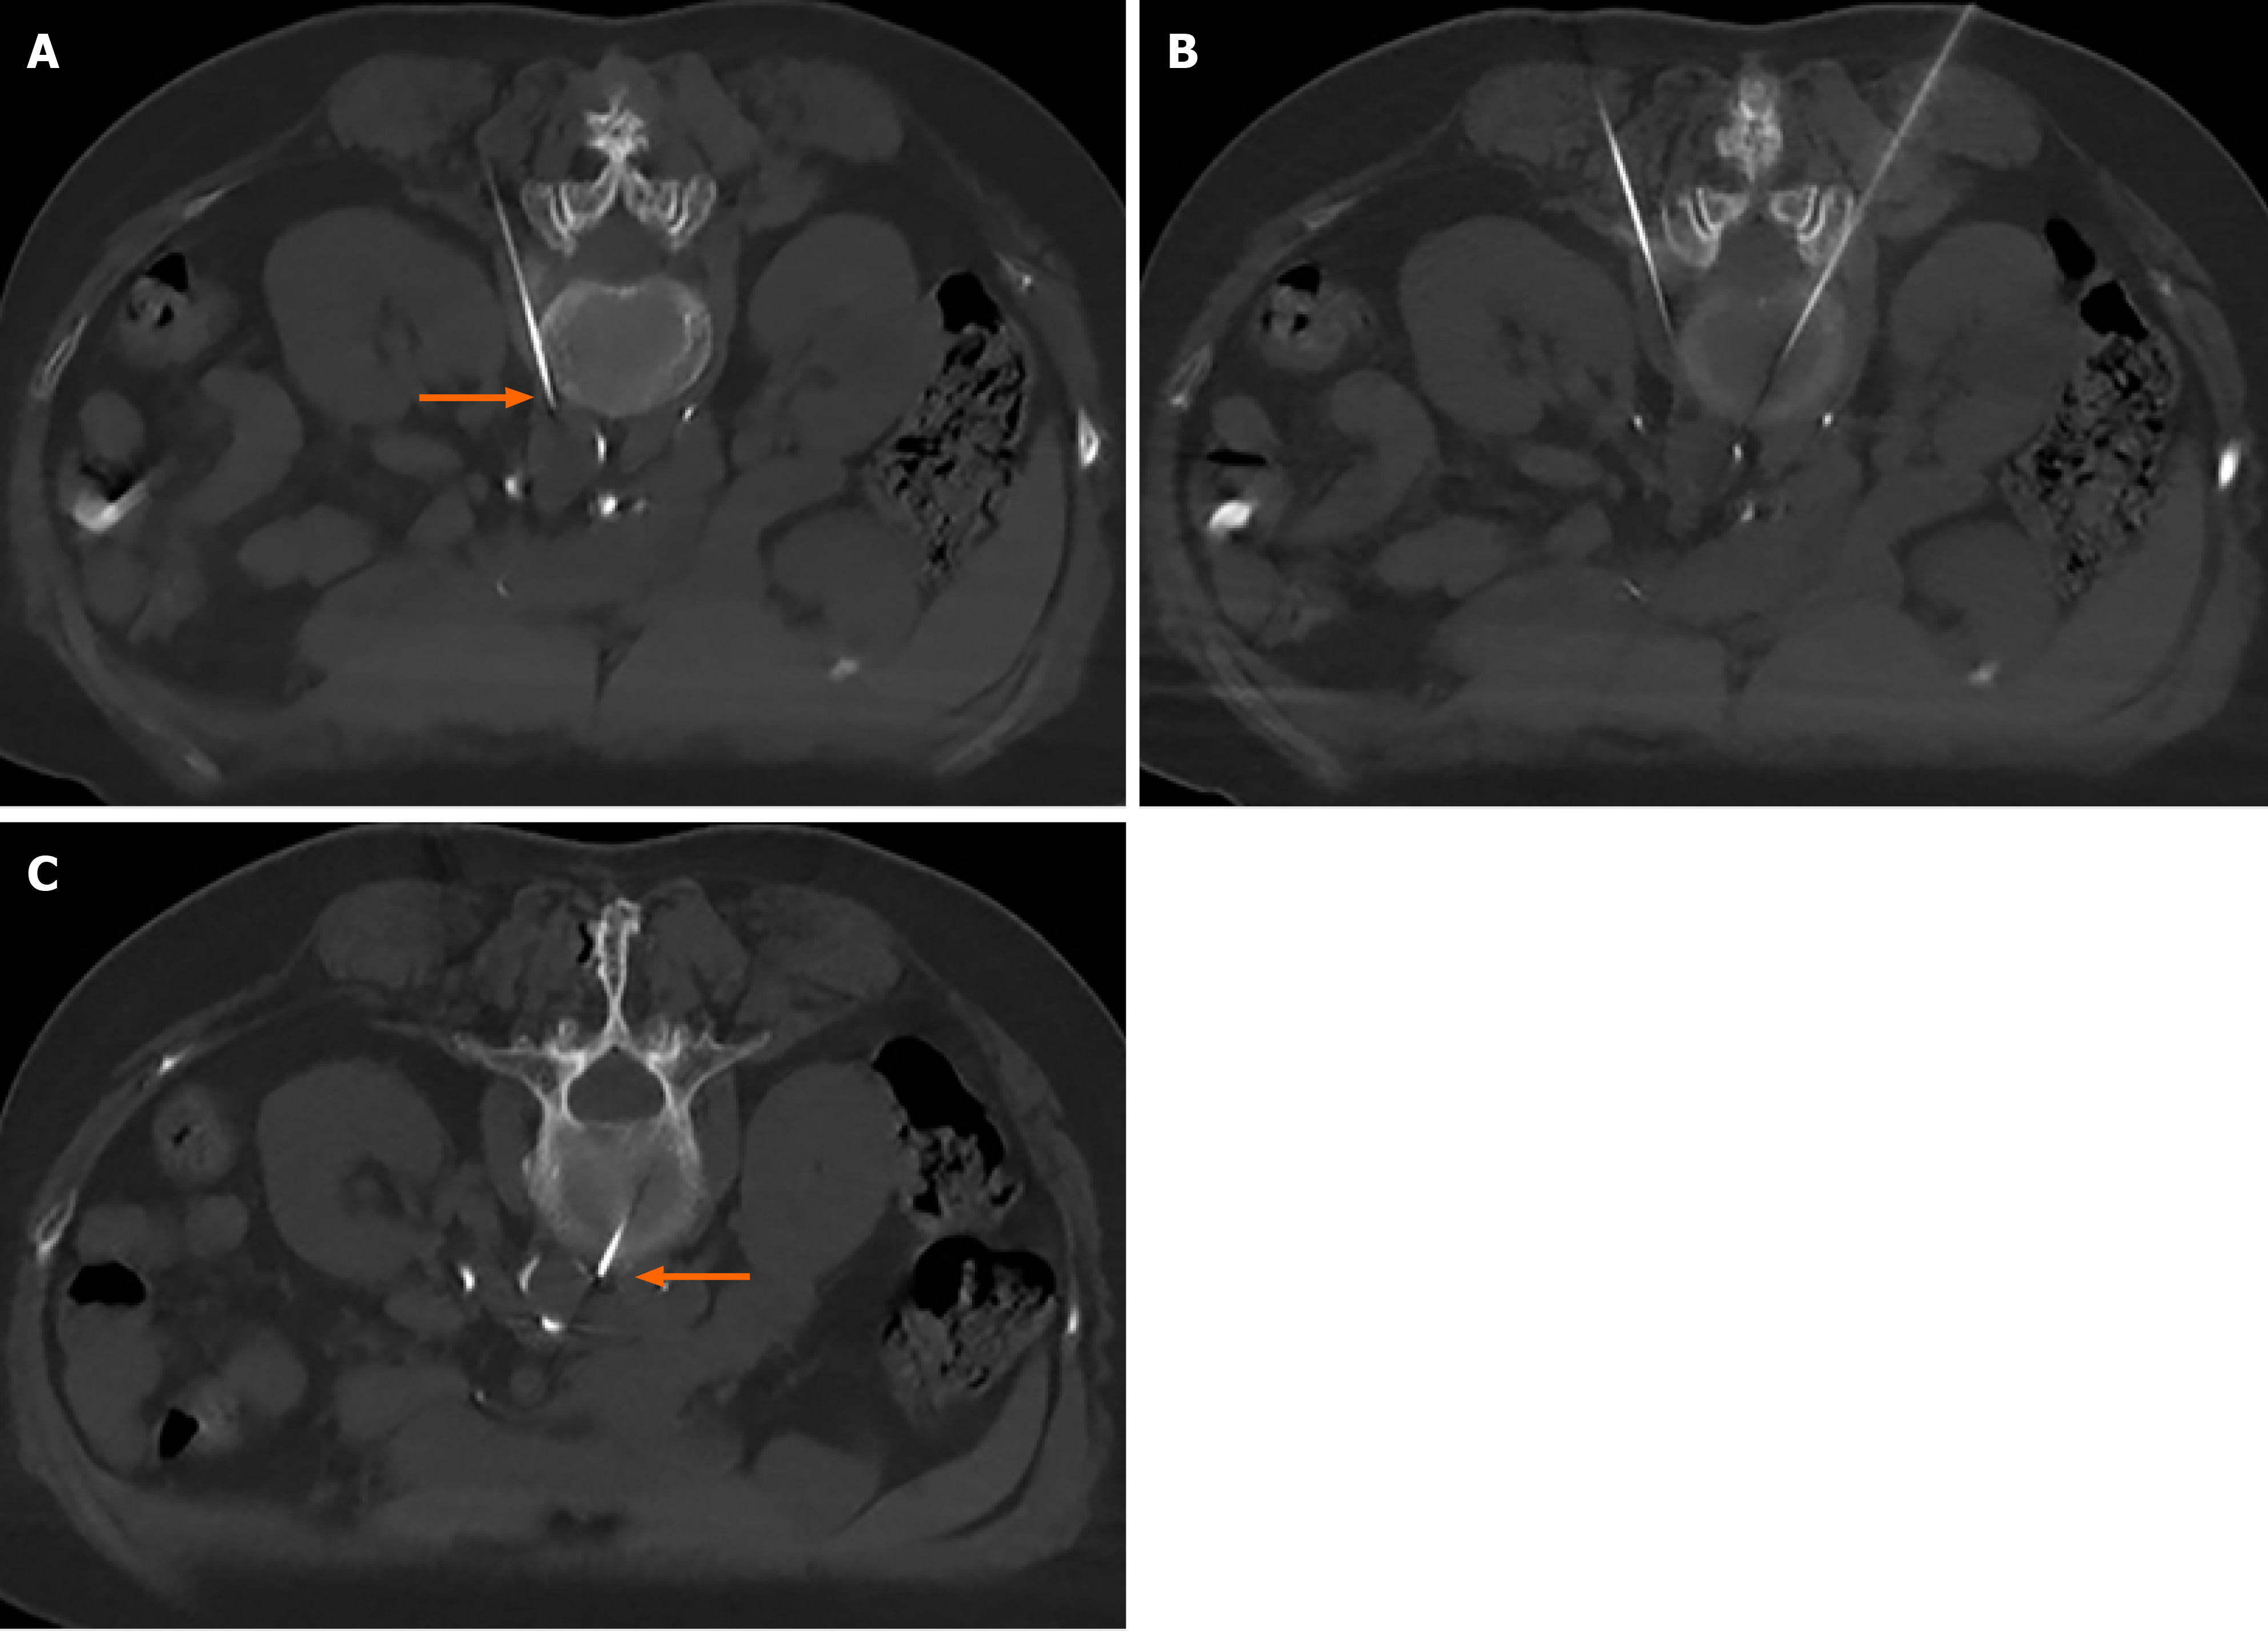
Figure 1 The puncture needle entering the target.
The position of the puncture needle in the same sequence from different levels. The arrows show the tip of the puncture needle.
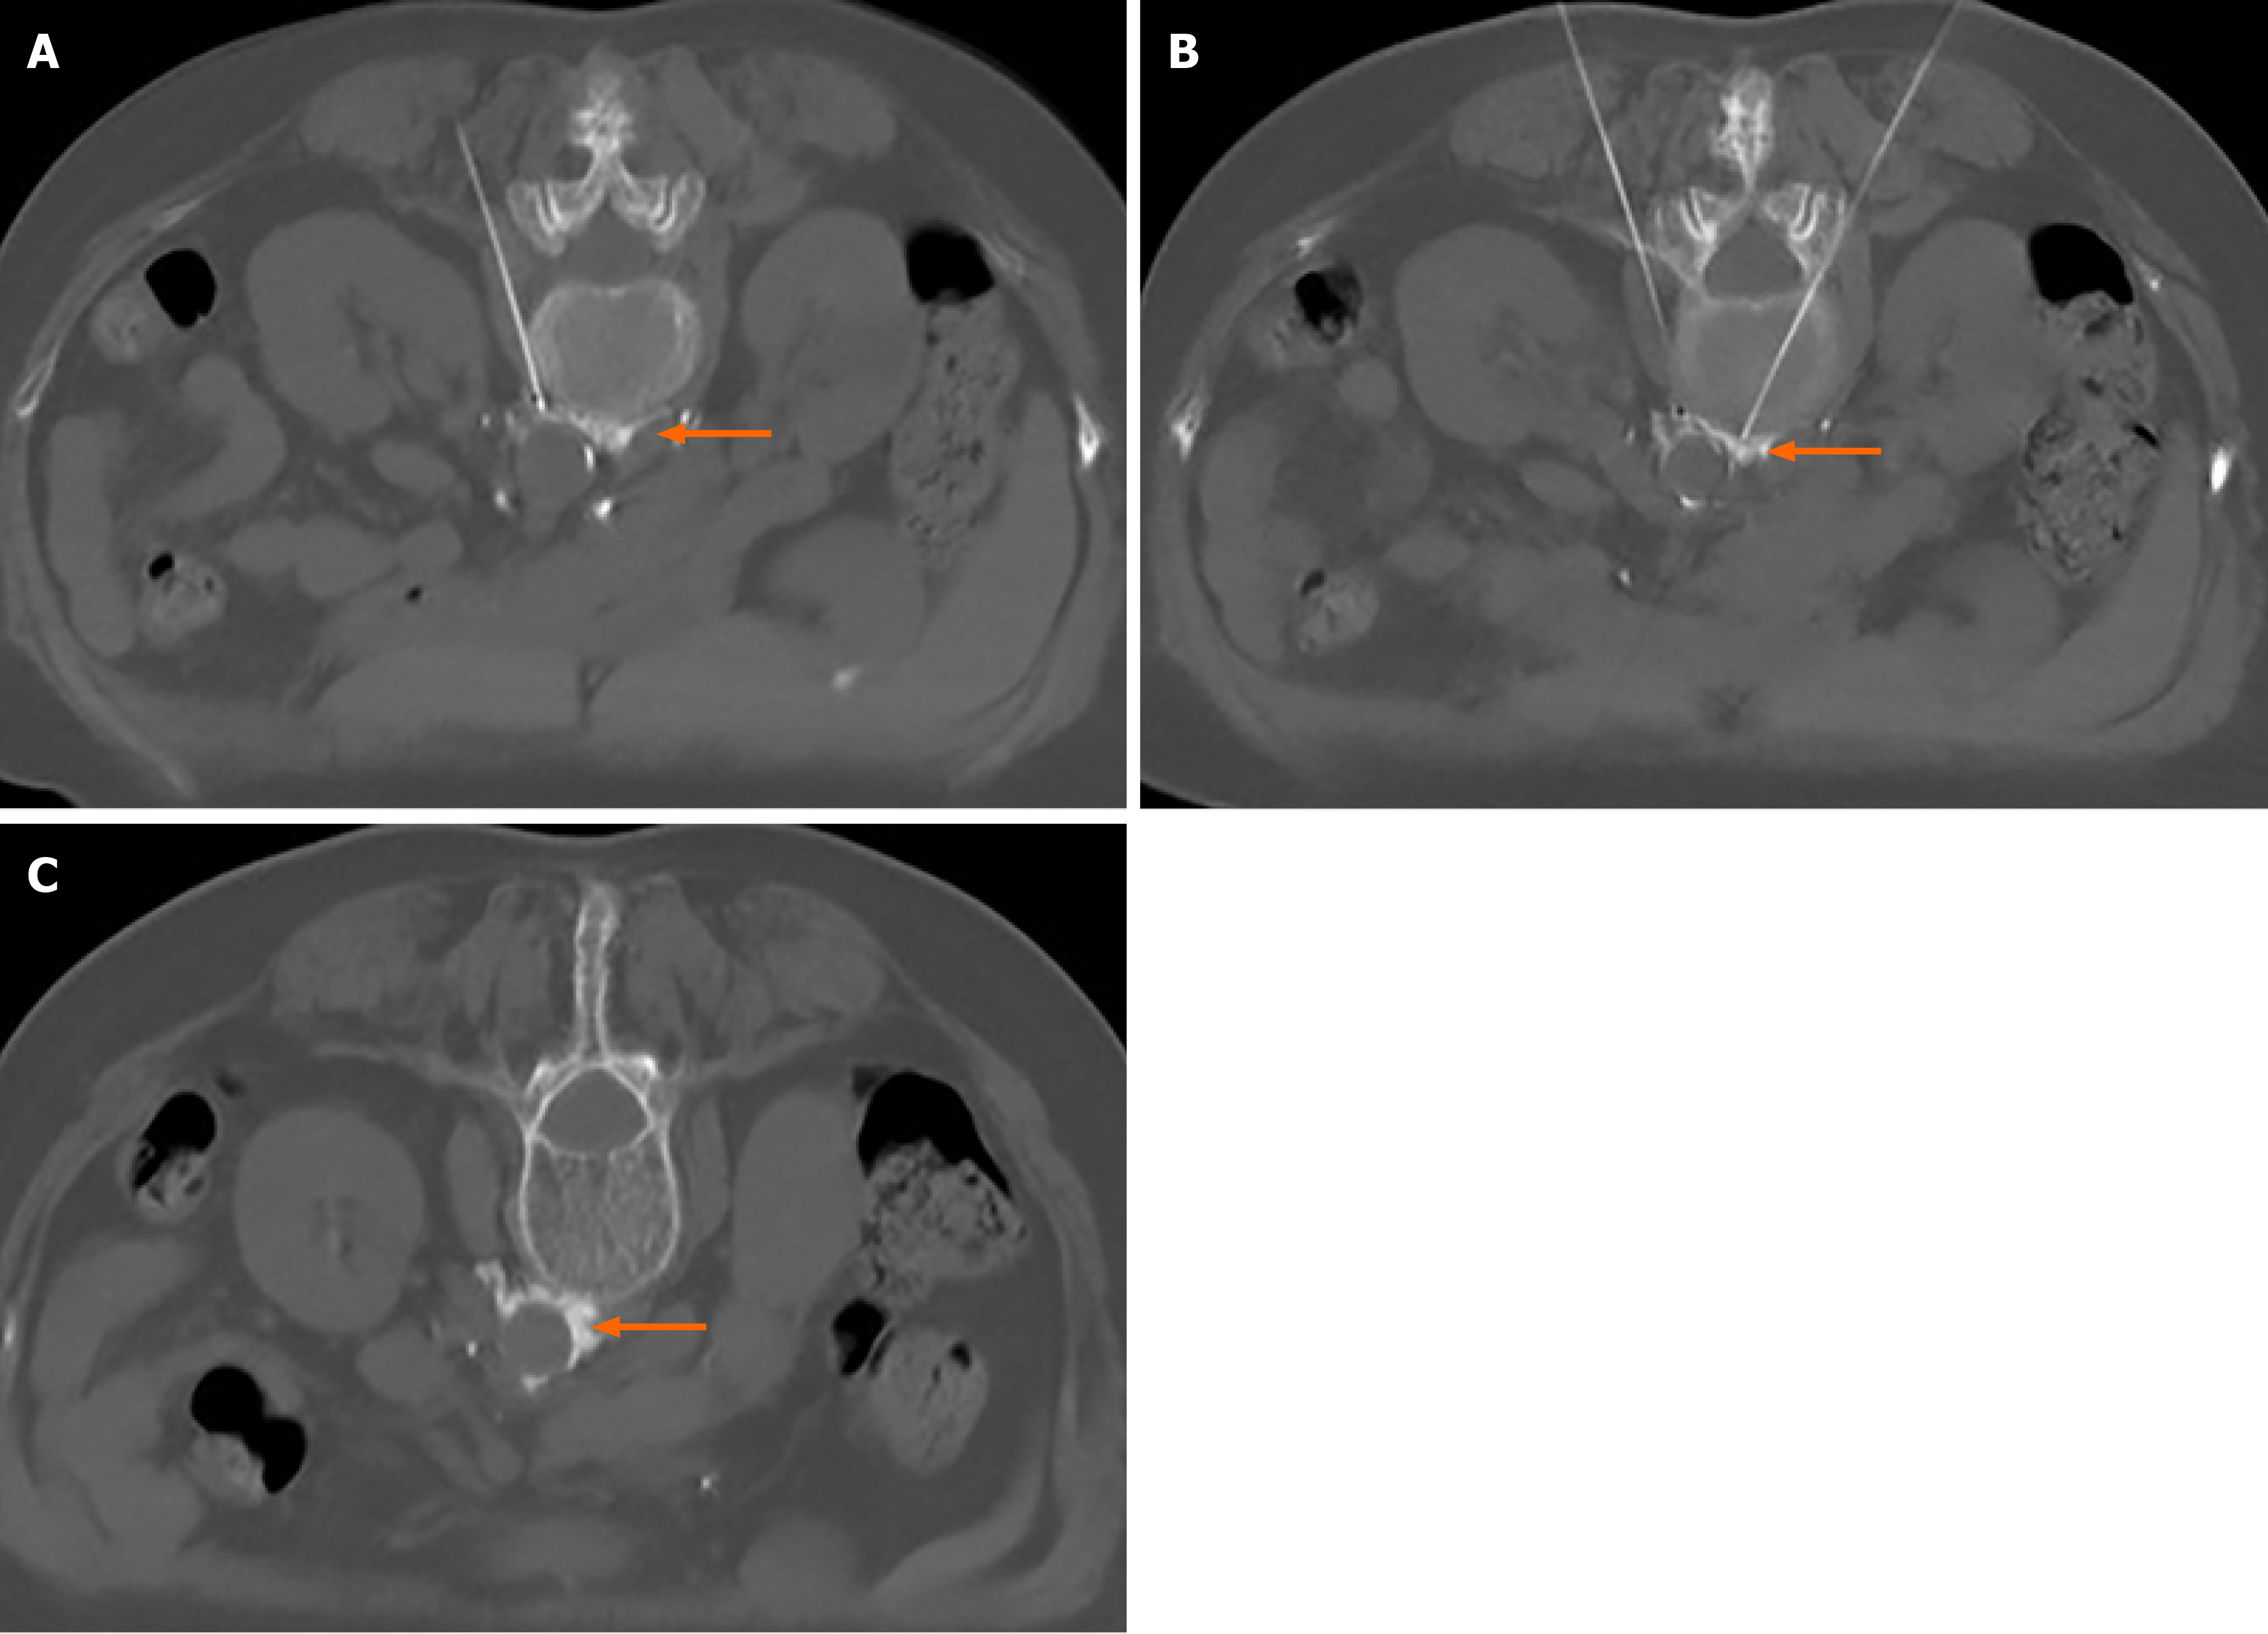
Figure 2 Injection and diffusion of anhydrous ethanol.
The arrows show the anhydrous ethanol.
Figure 3 The changing trends in blood pressure at different intervals during the perioperative period of 11 d and 4 years after the operation.
A: The perioperative period of 11 d; B: 4 yr after the operation. Blood pressure was recorded every 6 mo for 4 yr after the operation. BL: Blood pressure during the 3 d before the operation; T1: Post-0.5 yr; T2: Post-1 yr; T3: Post-1.5 yr; T4: Post-2 yr; T5: Post-2.5 yr; T6: Post-3 yr; T7: Post-3.5 yr; T8: Post-4 yr.
- Citation: Luo G, Zhu JJ, Yao M, Xie KY. Computed tomography-guided chemical renal sympathetic nerve modulation in the treatment of resistant hypertension: A case report. World J Clin Cases 2021; 9(32): 9970-9976
- URL: https://www.wjgnet.com/2307-8960/full/v9/i32/9970.htm
- DOI: https://dx.doi.org/10.12998/wjcc.v9.i32.9970


