
















Copyright: ©Author(s) 2026.
World J Clin Cases. Jul 26, 2026; 14(21): 120444
Published online Jul 26, 2026. doi: 10.12998/wjcc.120444
Published online Jul 26, 2026. doi: 10.12998/wjcc.120444
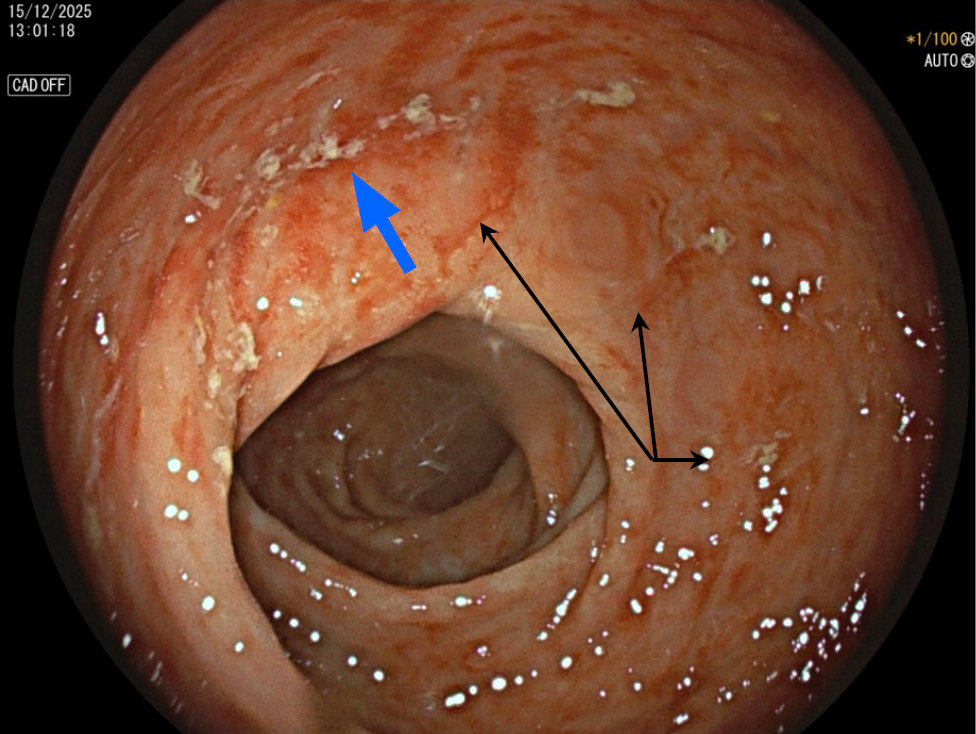
Figure 1 Colonoscopic images at the level of the rectum.
The figure revealing marked erythematous mucosa and moderate friability (black arrows) with visible erosions (blue arrow) and partial loss of vascular pattern with an Ulcerative Colitis Endoscopic Index of Severity score 5/8.
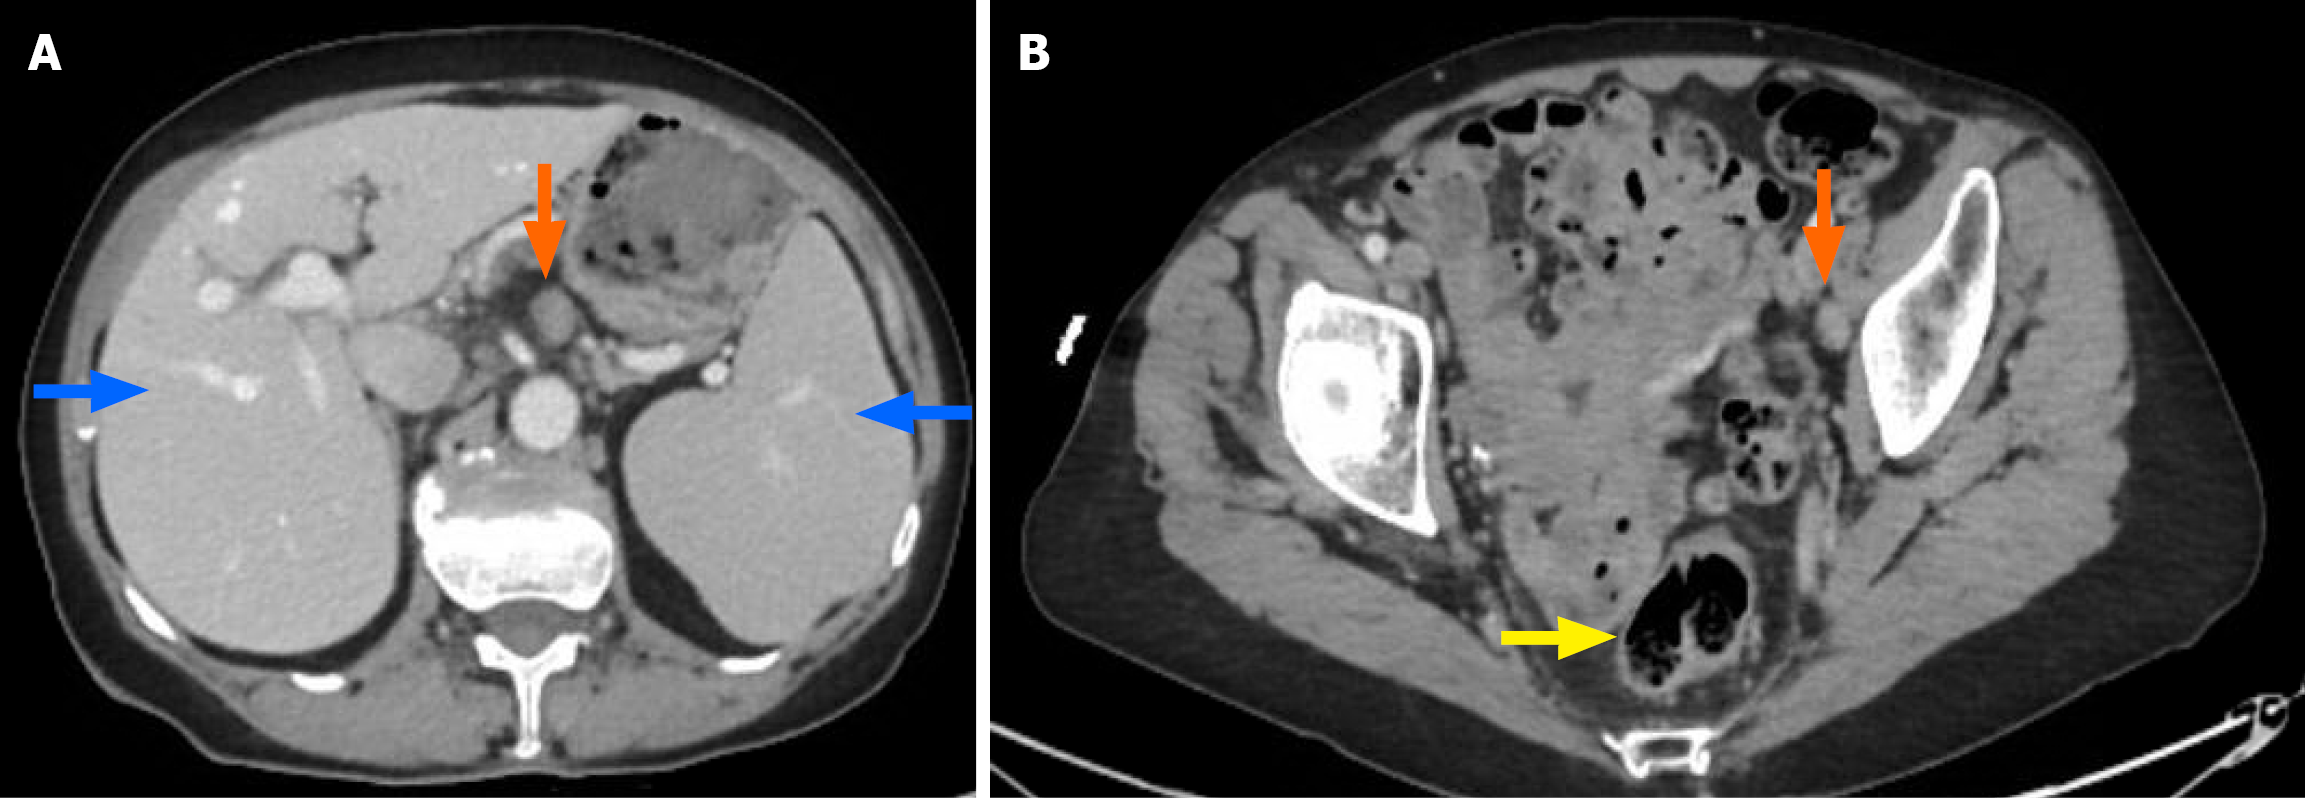
Figure 2 Scanner thoraco-abdomen-pelvis findings.
A: Scan thoraco-abdomen-pelvis revealing hepatosplenomegaly (blue arrows). Celiac, mesenteric lymphadenopathy (orange arrow); B: Left external iliac lymphadenopathy (orange arrow). No mass was seen at the level of the rectum (yellow arrow).
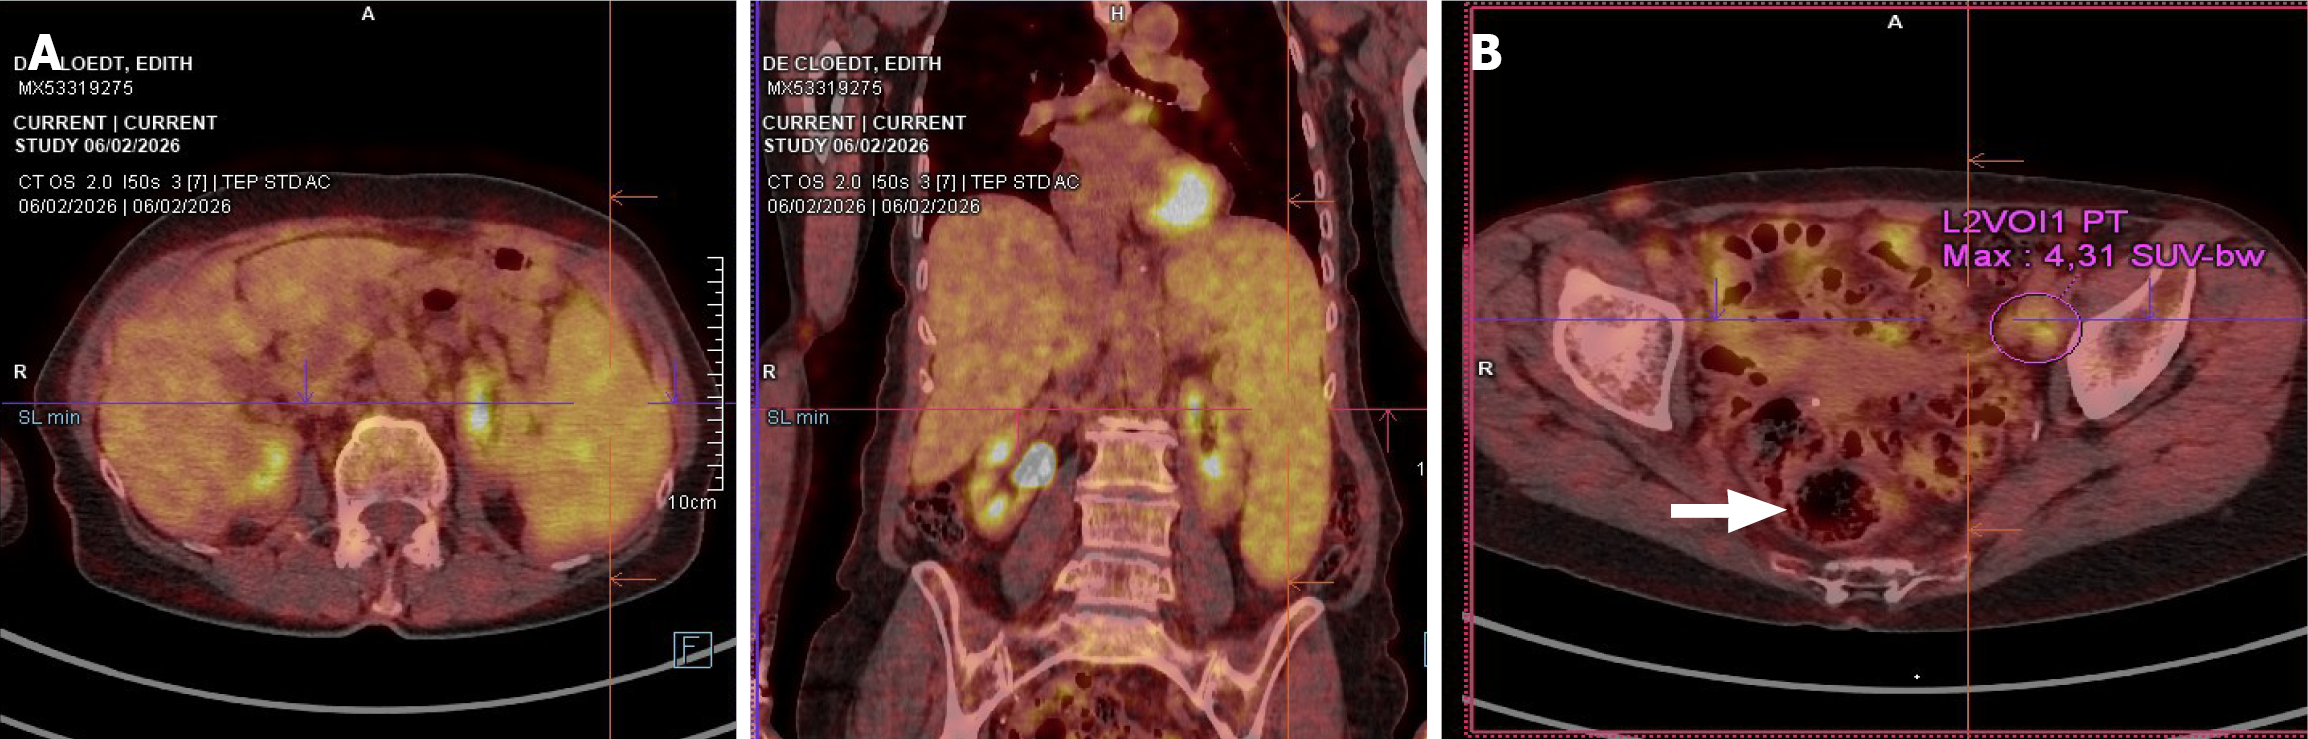
Figure 3 Positron emission tomography findings.
A: Positron emission tomography revealing hypermetabolism at the level of the spleen with splenomegaly; B: Positron emission tomography revealing a hypermetabolic activity with a maximum standardized uptake value of 4.3 in the left external iliac lymph nodes. No abnormal metabolic activity was detected at the rectal level (white arrow).
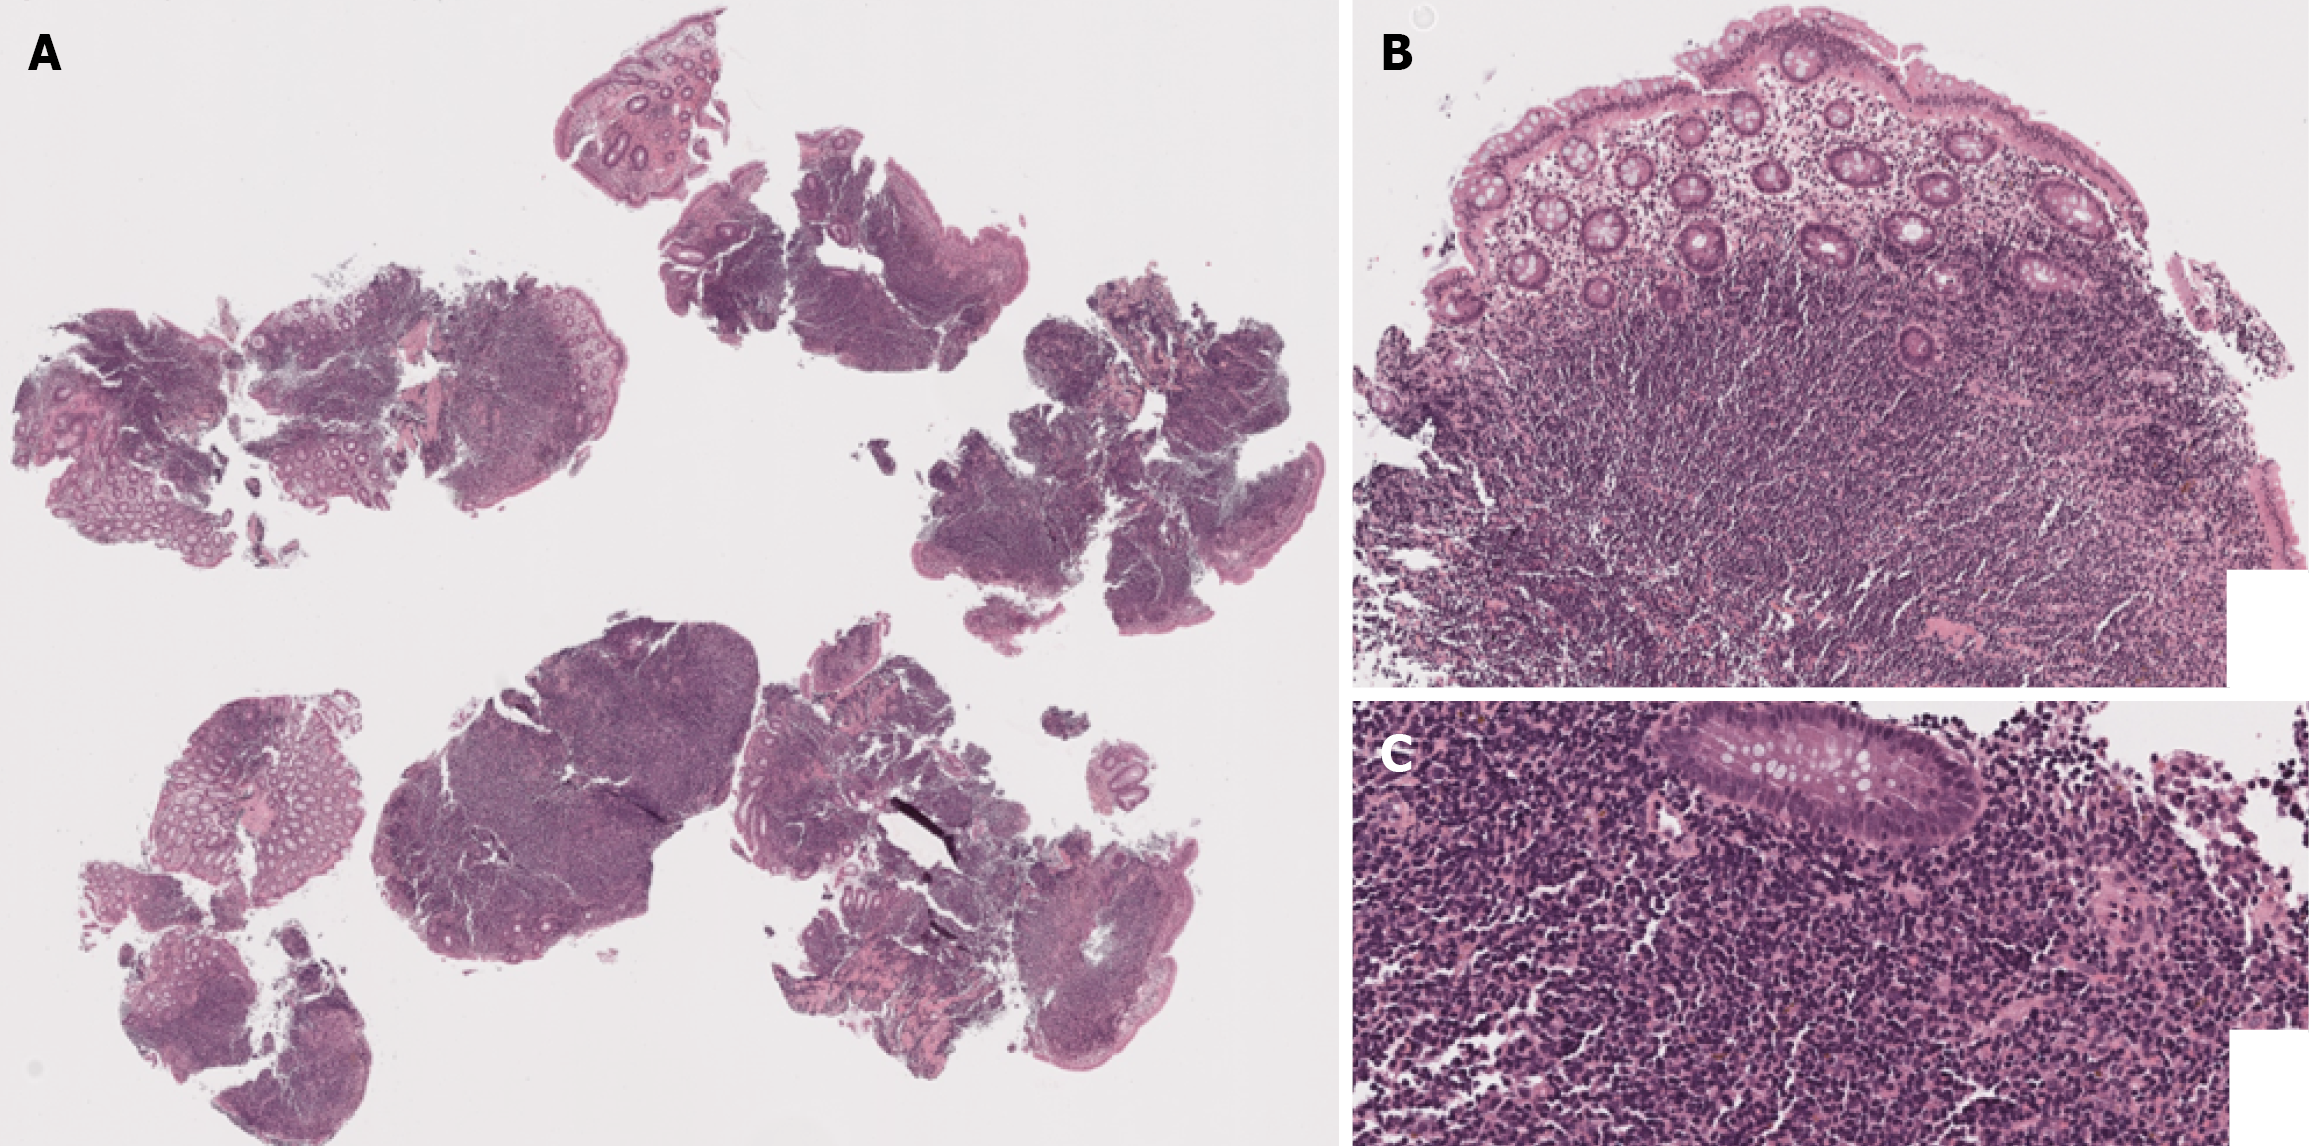
Figure 4 Histopathology showing diffuse proliferation of small lymphoid cells involving the lamina propria and submucosa, hematoxylin-eosin staining.
A: 2 × magnification; B: 5 × magnification; C: 10 × magnification.
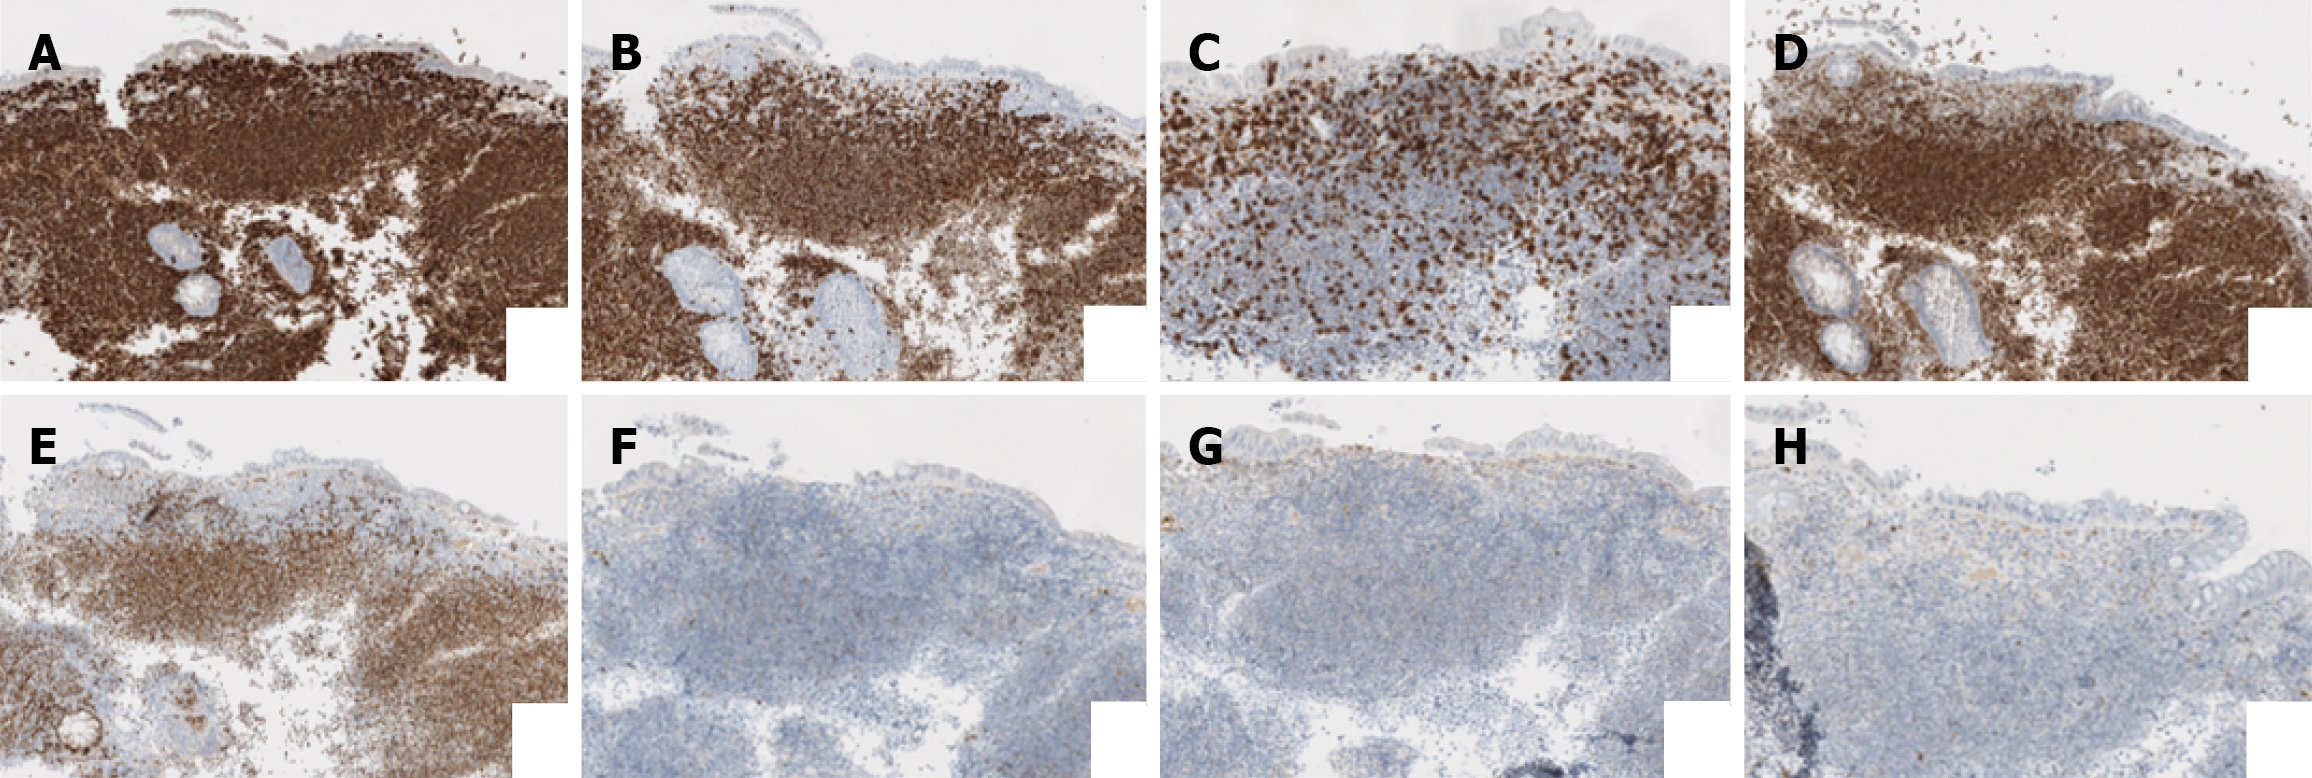
Figure 5 Immunohistochemistry staining of rectal mantle cell lymphoma.
A: CD79a positive; B: CD5 positive; C: CD3; D: B-cell lymphoma-2 positive; E: Cyclin D1 positive; F: CD23 negative; G: CD10 negative; H: B-cell lymphoma-6 negative.
- Citation: Karam K, Charro K, Kechaou D, Abarah W, Rakotobe J, Locher C. Rectal mantle cell lymphoma endoscopically mimicking ulcerative proctitis: A case report. World J Clin Cases 2026; 14(21): 120444
- URL: https://www.wjgnet.com/2307-8960/full/v14/i21/120444.htm
- DOI: https://dx.doi.org/10.12998/wjcc.120444