©The Author(s) 2025.
World J Clin Cases. Nov 6, 2025; 13(31): 109113
Published online Nov 6, 2025. doi: 10.12998/wjcc.v13.i31.109113
Published online Nov 6, 2025. doi: 10.12998/wjcc.v13.i31.109113
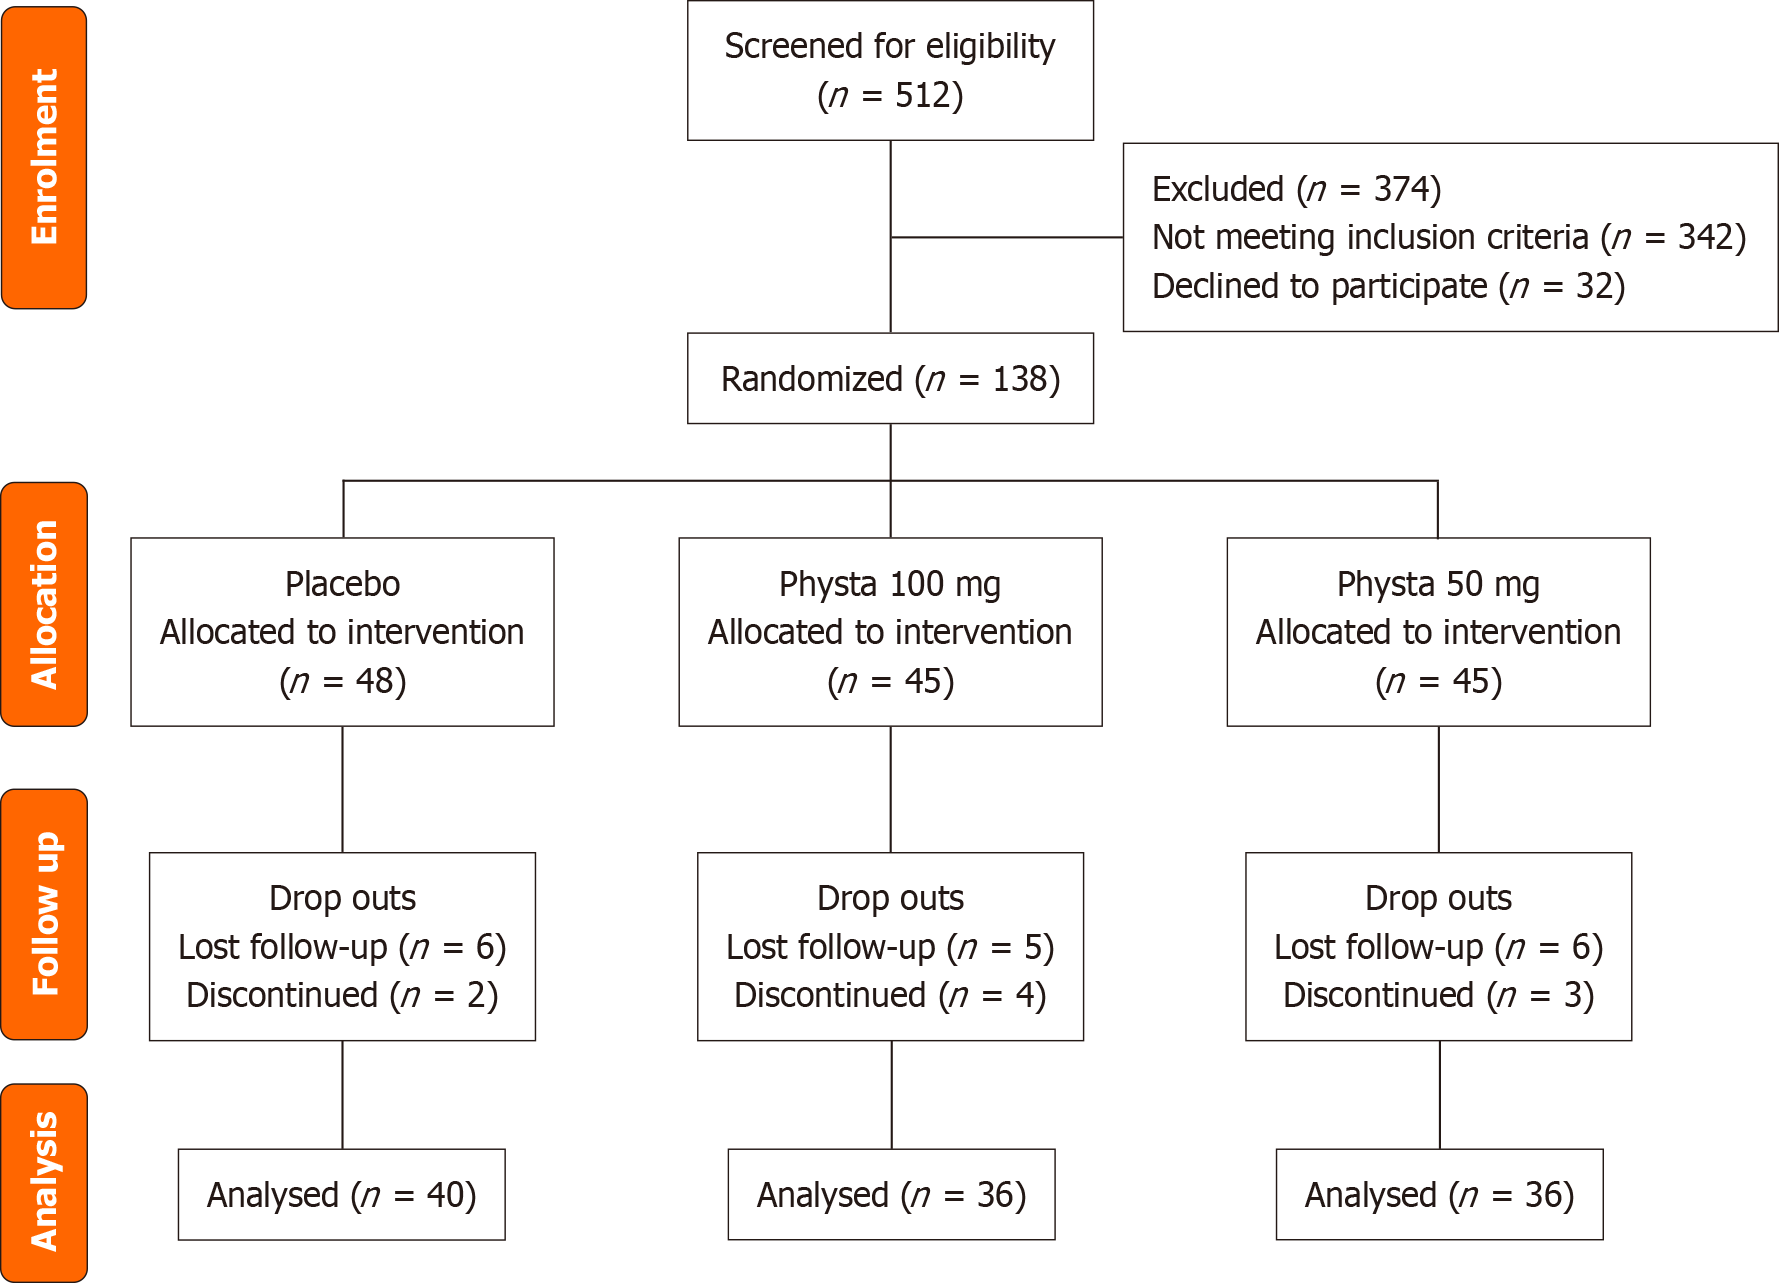
Figure 1
CONSORT flow diagram of participant screening, recruitment, allocation, follow-ups, and analysis.
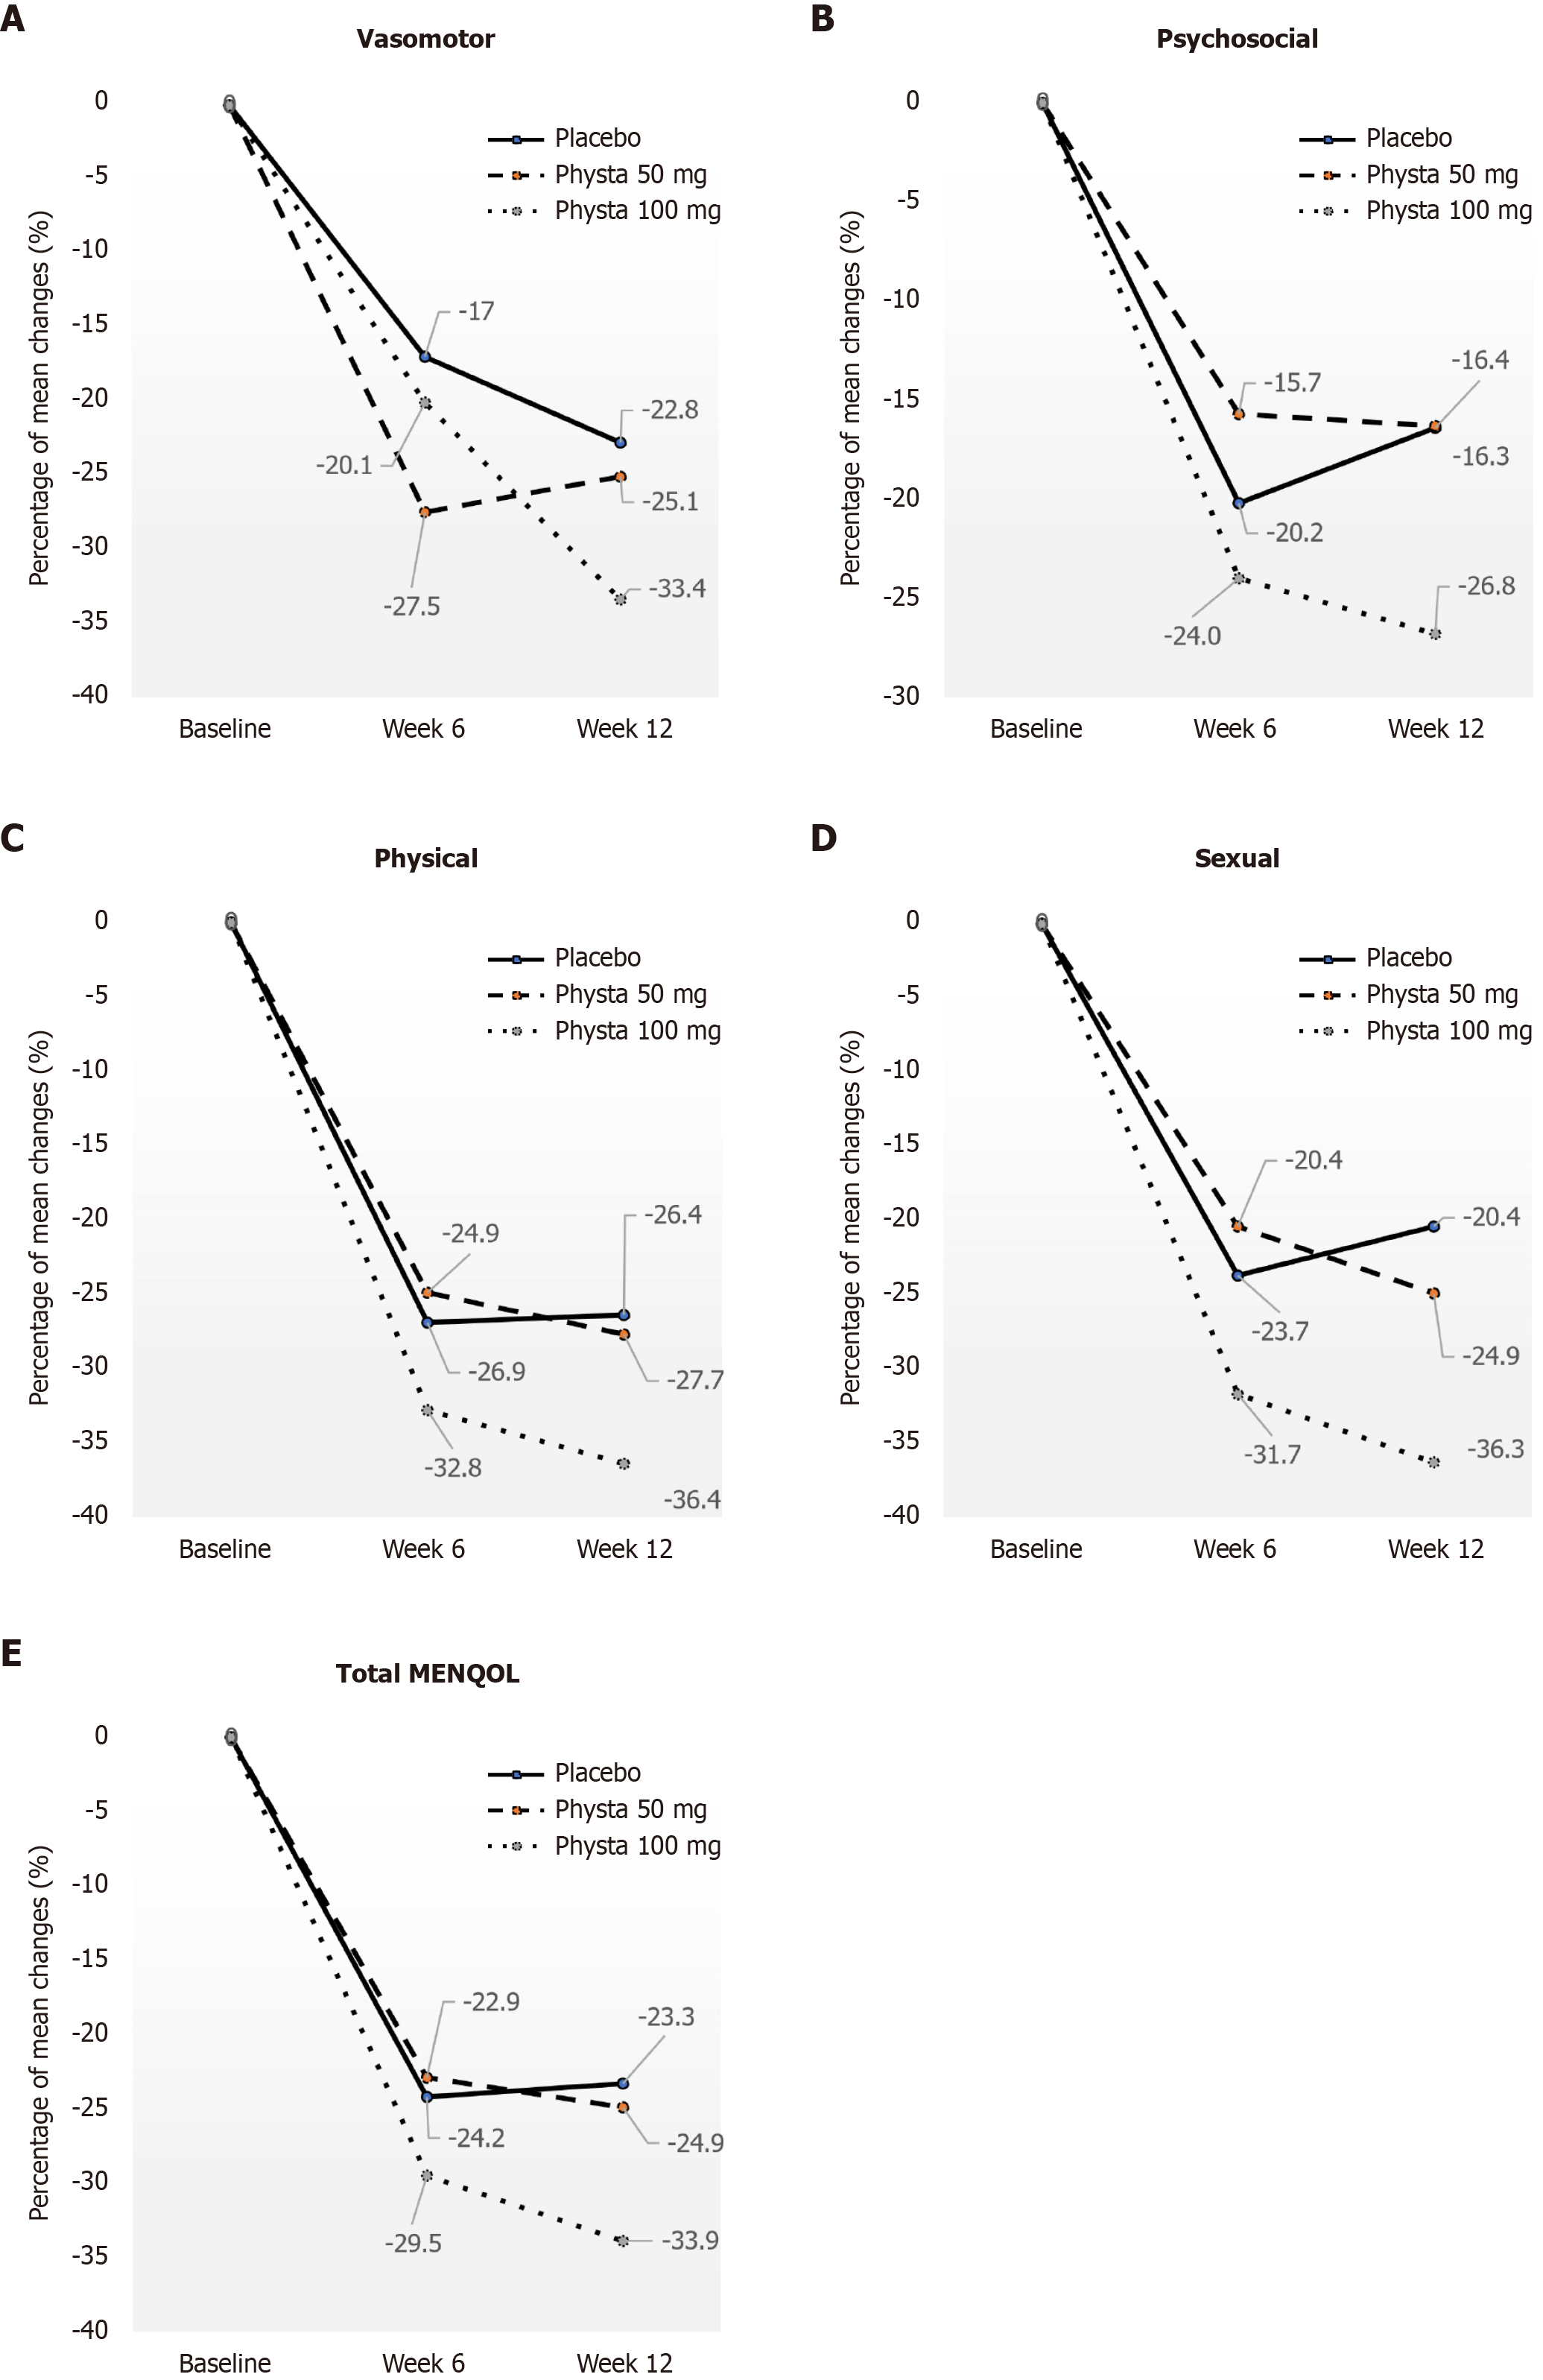
Figure 2 Percentage of mean changes of menopause-specific quality of life total score and by domain at baseline, week 6, and week 12.
A: Vasomotor; B: Psychosocial; C: Physical; D: Sexual; E: Total menopause-specific quality of life. MENQOL: Menopause-specific quality of life.
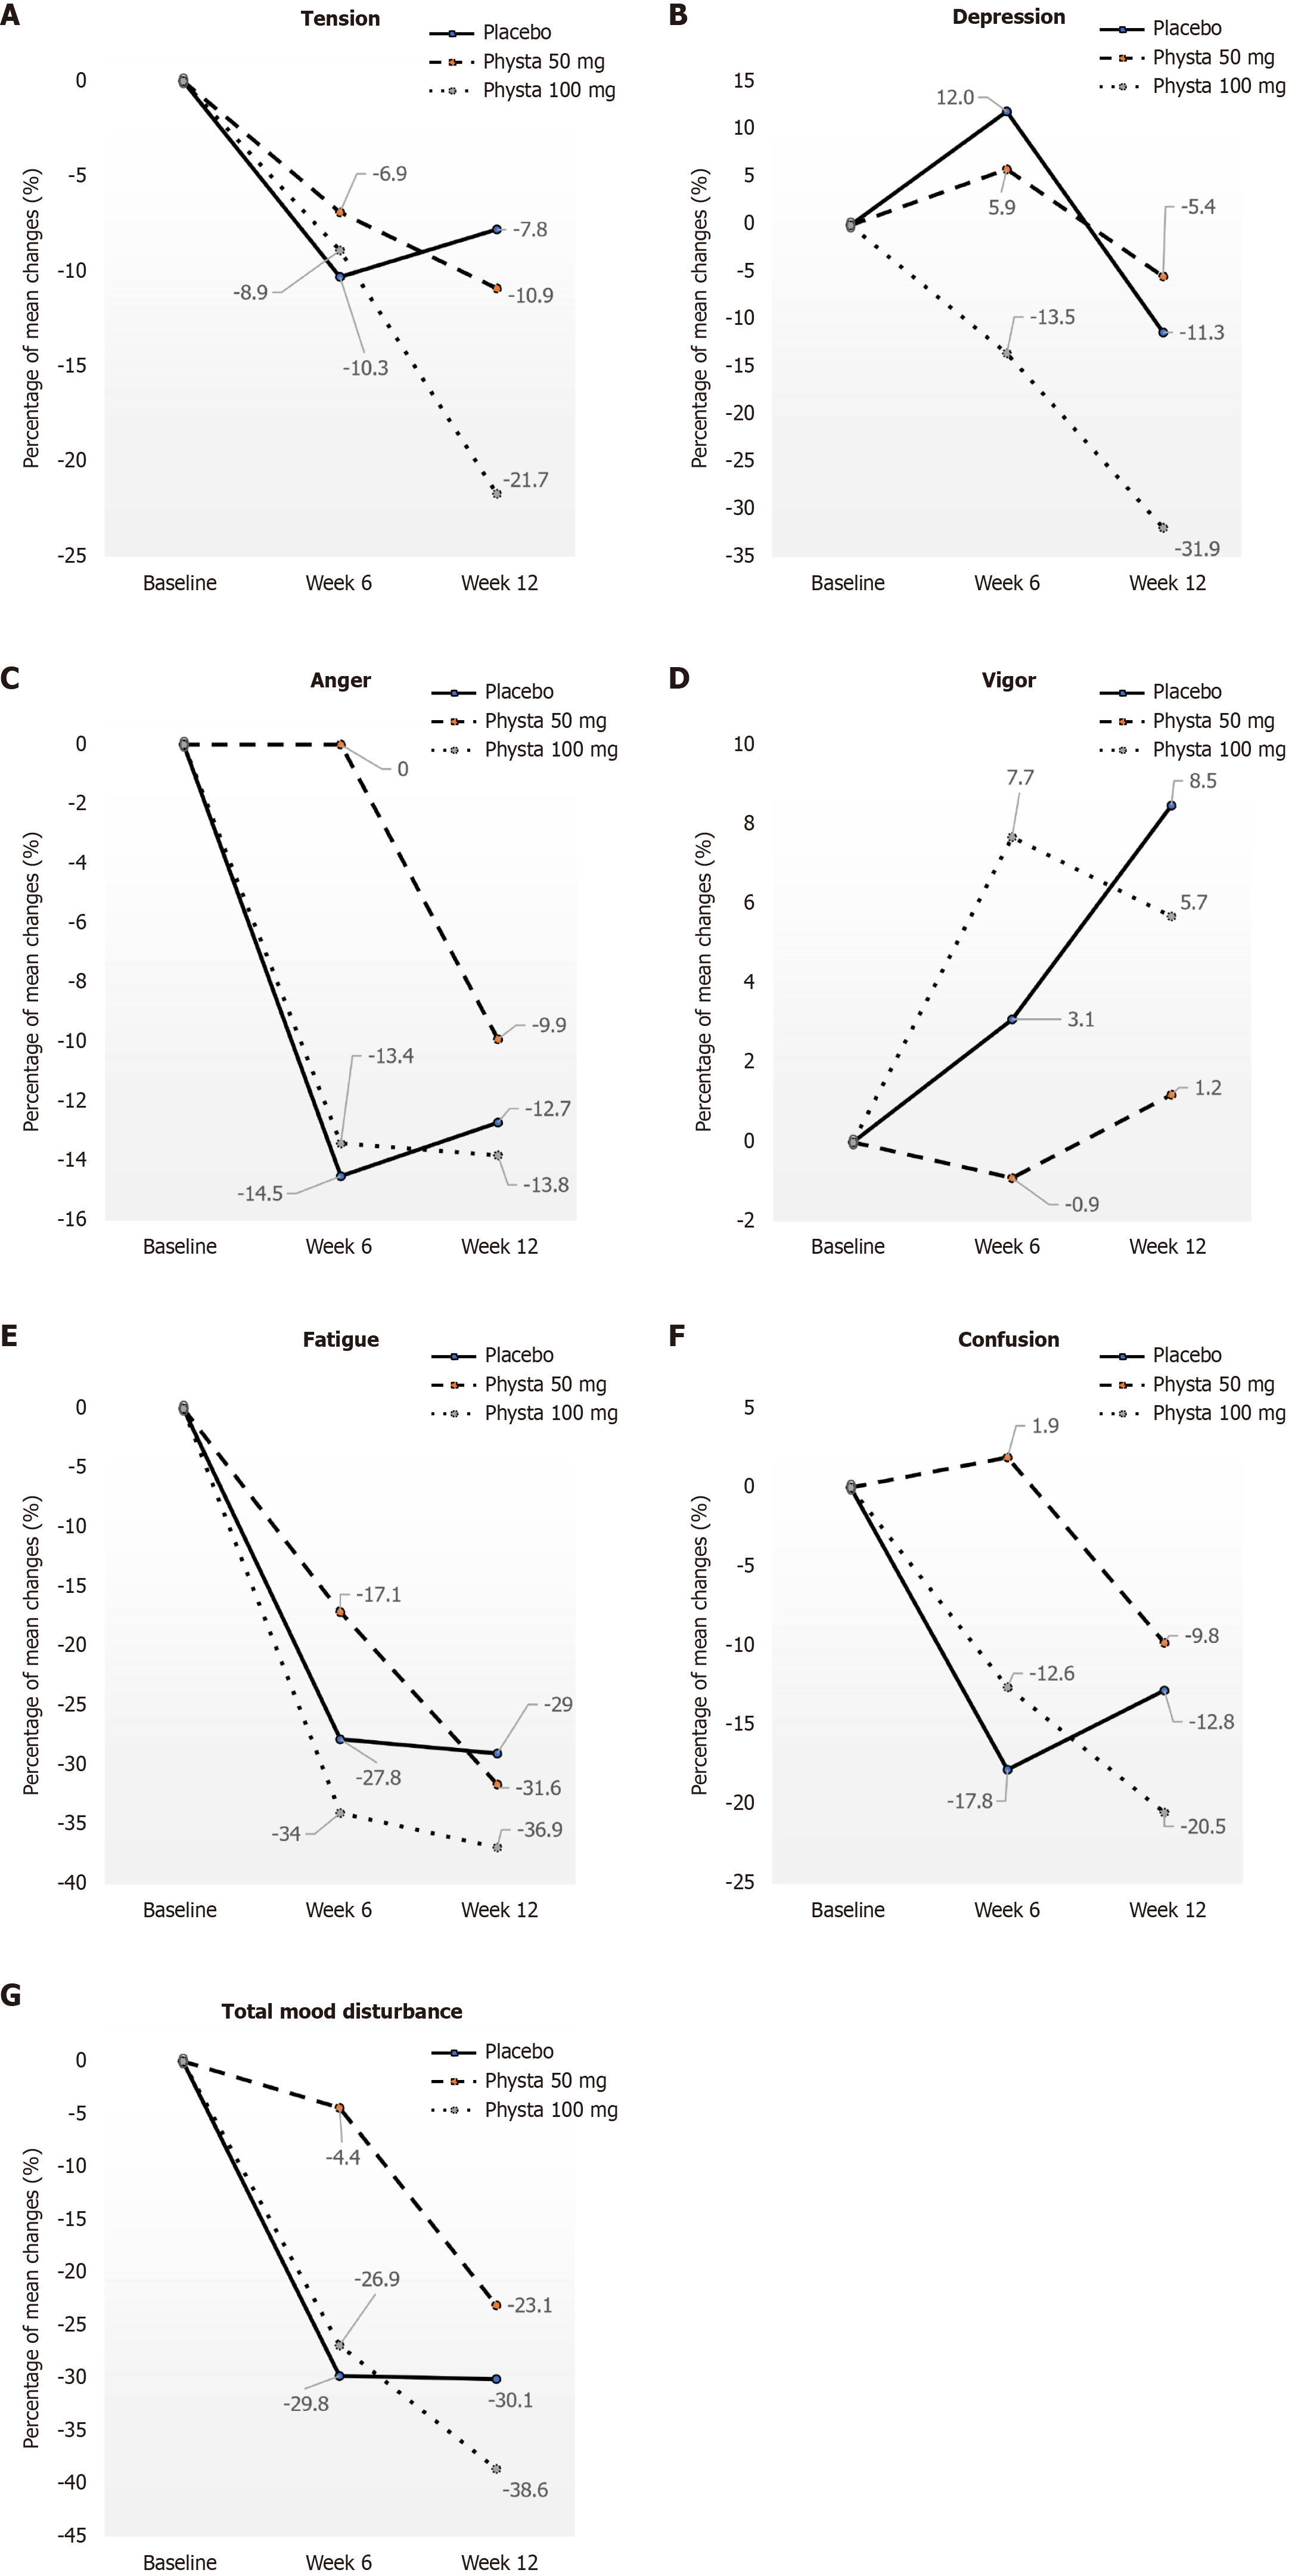
Figure 3 Percentage of mean changes of profile of mood state scores by domains at baseline, week 6, and week 12.
A: Tension; B: Depression; C: Tension; D: Vigor; E: Fatigue; F: Confusion; G: Total mood disturbance.
- Citation: Muniandy S, Yahya HM, Shahar S, Kamisan Atan I, Mahdy ZA, Rajab NF, Mohd Rasdi HF, George A, Chinnappan SM. Effect of Eurycoma longifolia water extract (Physta®) on menopausal quality of life and mood states. World J Clin Cases 2025; 13(31): 109113
- URL: https://www.wjgnet.com/2307-8960/full/v13/i31/109113.htm
- DOI: https://dx.doi.org/10.12998/wjcc.v13.i31.109113


