©The Author(s) 2025.
World J Clin Cases. Oct 26, 2025; 13(30): 108828
Published online Oct 26, 2025. doi: 10.12998/wjcc.v13.i30.108828
Published online Oct 26, 2025. doi: 10.12998/wjcc.v13.i30.108828
Figure 1 Thyroid ultrasound.
A: Right thyroid, hypoechoic nodule (TI-RADS 4b); B: Left lateral neck mass. A mixed echogenic mass measuring approximately 6.4 cm × 4.5 cm × 5.3 cm, with color Doppler flow imaging showing clear borders and regular shape.
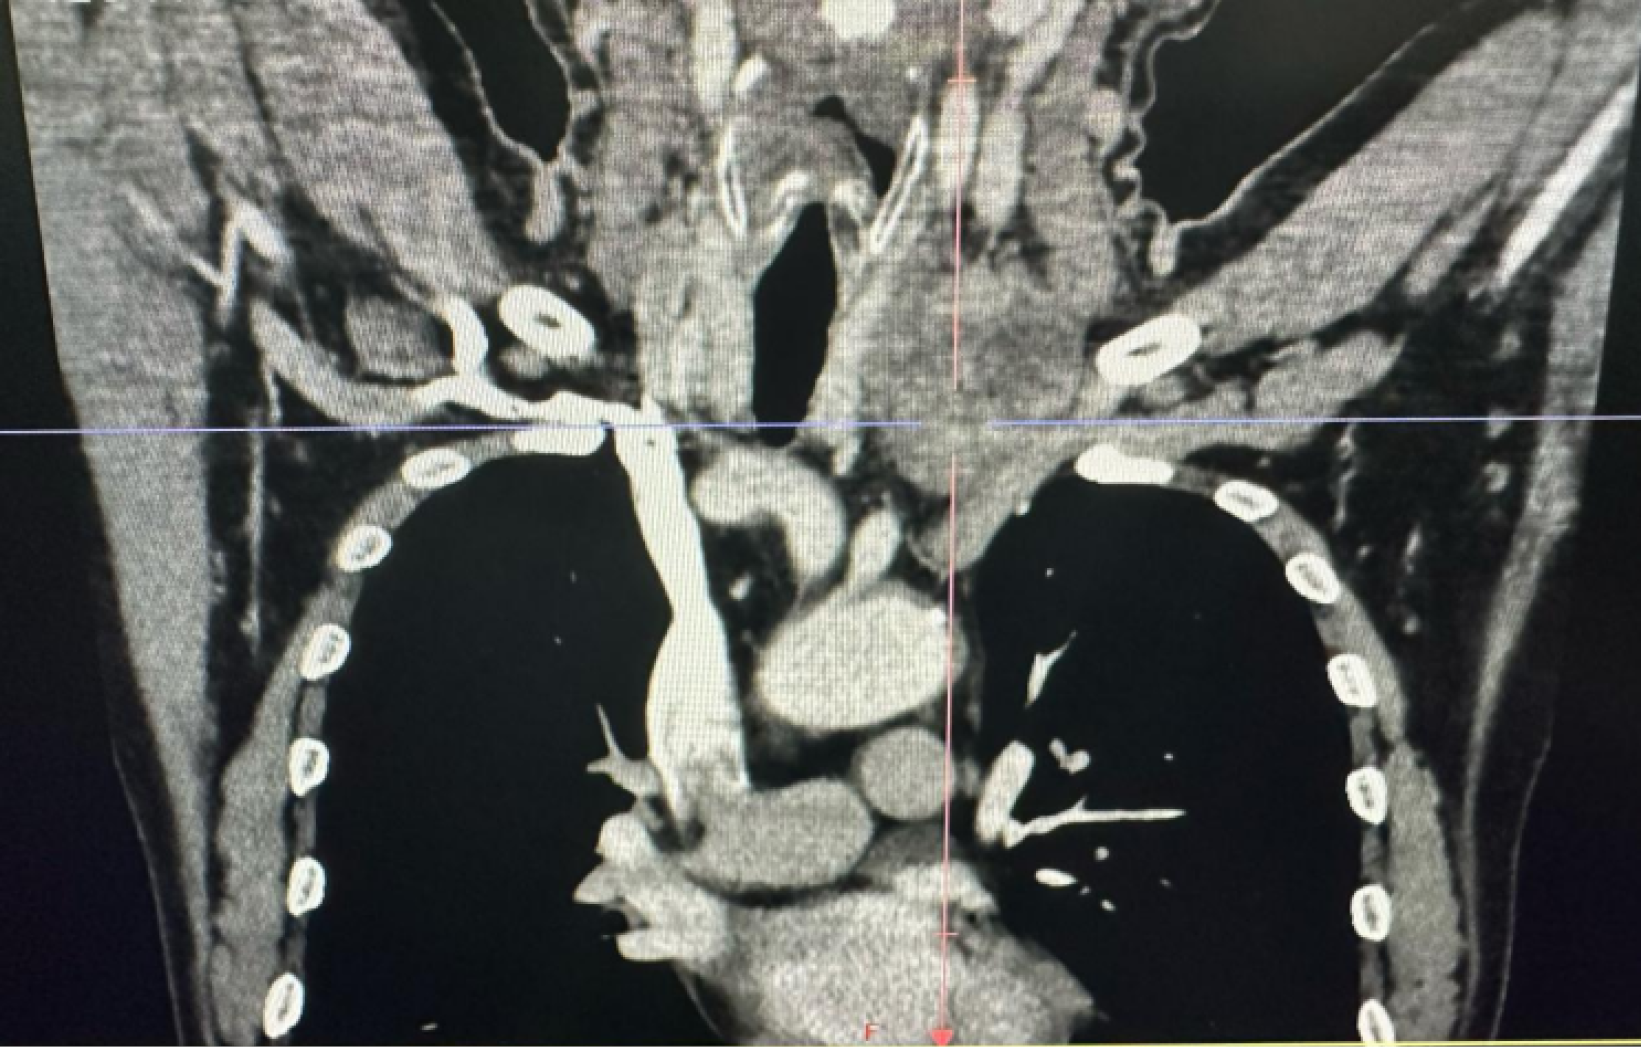
Figure 2 Neck and chest computed tomography scan with contrast.
The largest dimension of the mass was approximately 4.0 cm × 5.5 cm, with uneven enhancement on the contrast-enhanced scan.
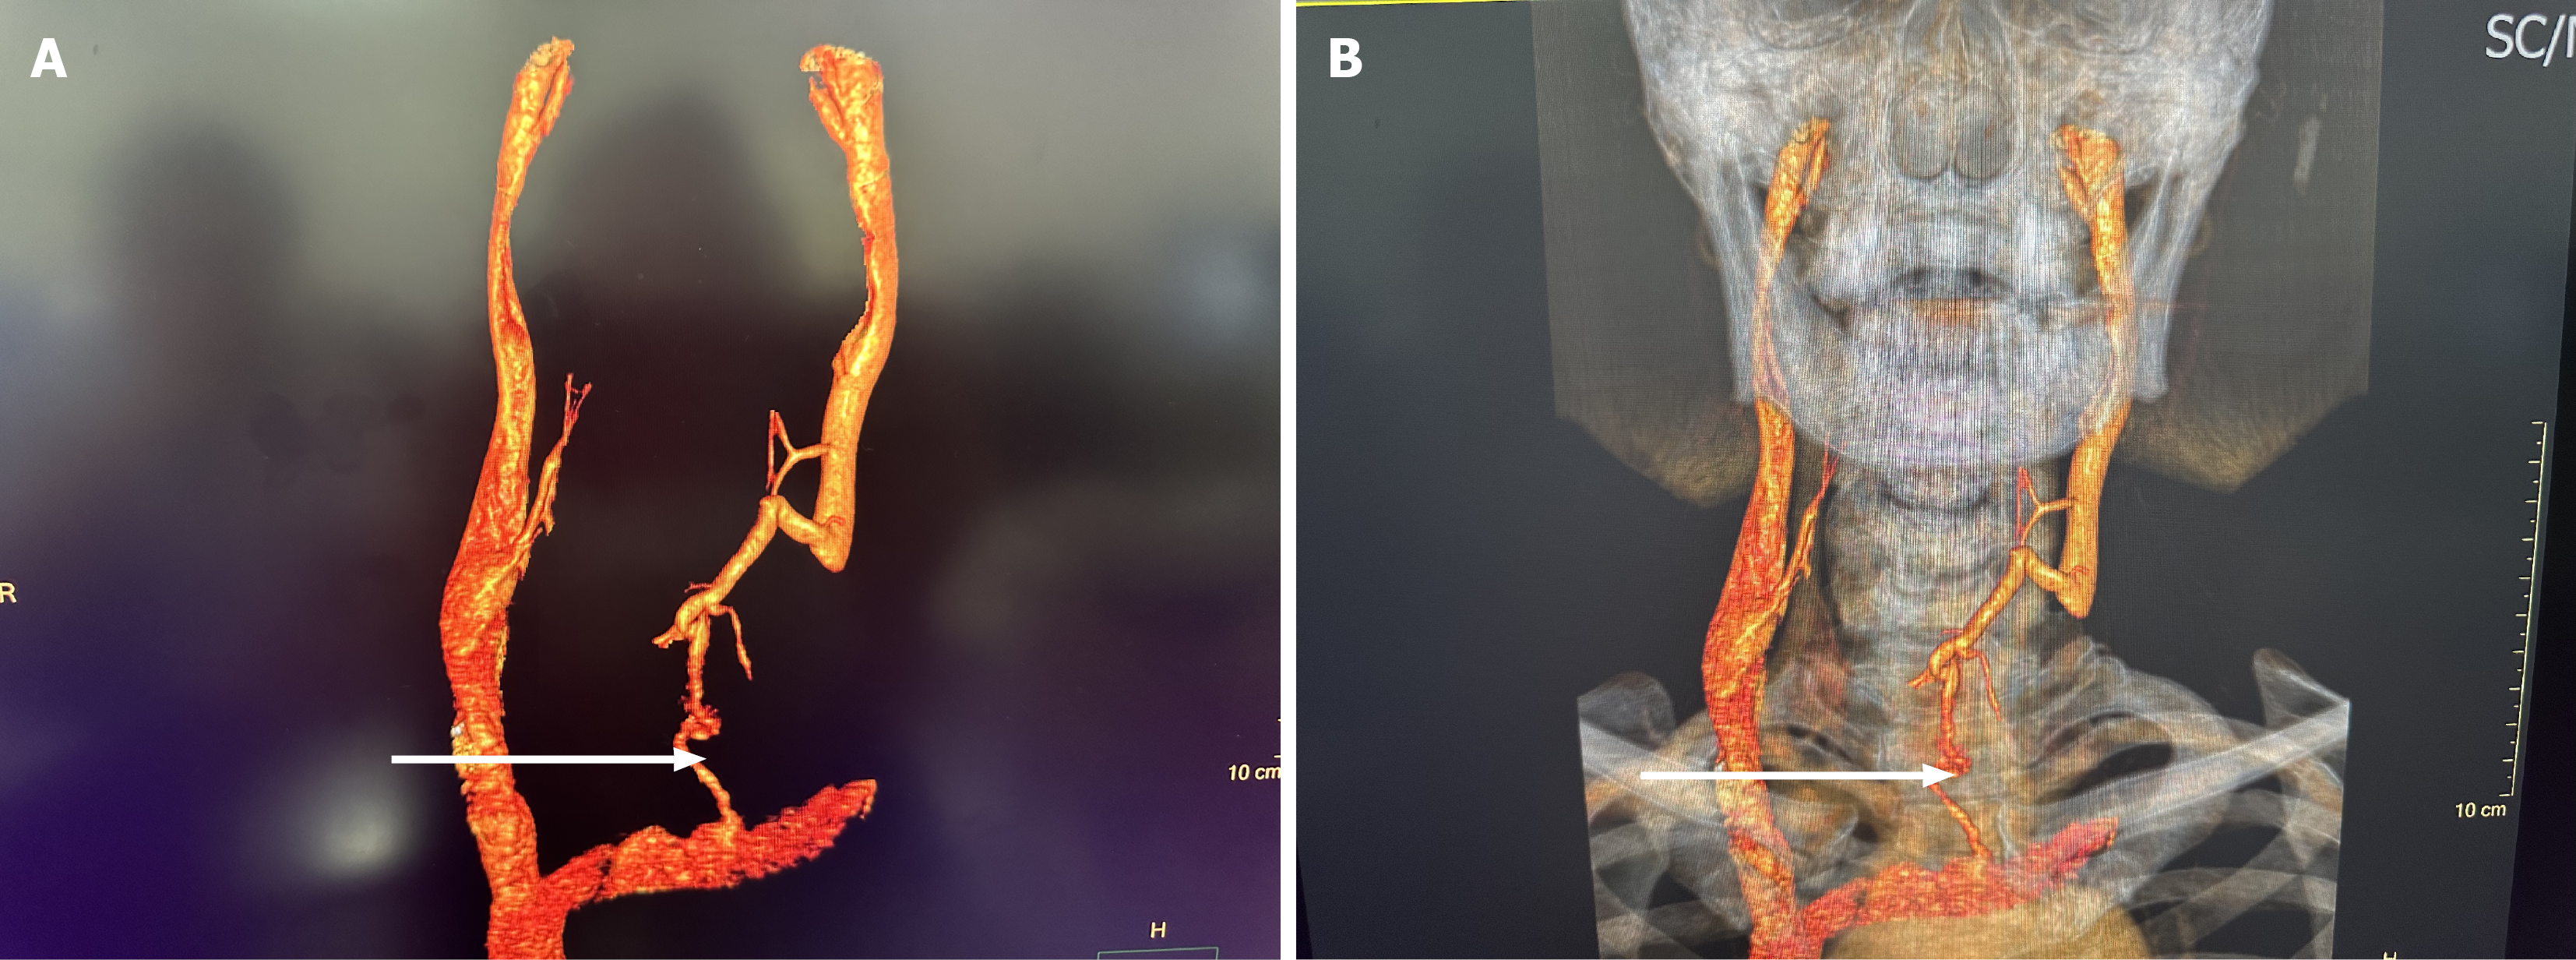
Figure 3 Computed tomography angiography/computed tomography venography of head and neck vasculature.
A: Computed tomography angiography reconstruction, with the white arrow indicating near closure of the left internal jugular vein and formation of collateral circulation; B: Vascular reconstruction showing the left internal jugular vein compressed, with collateral circulation.
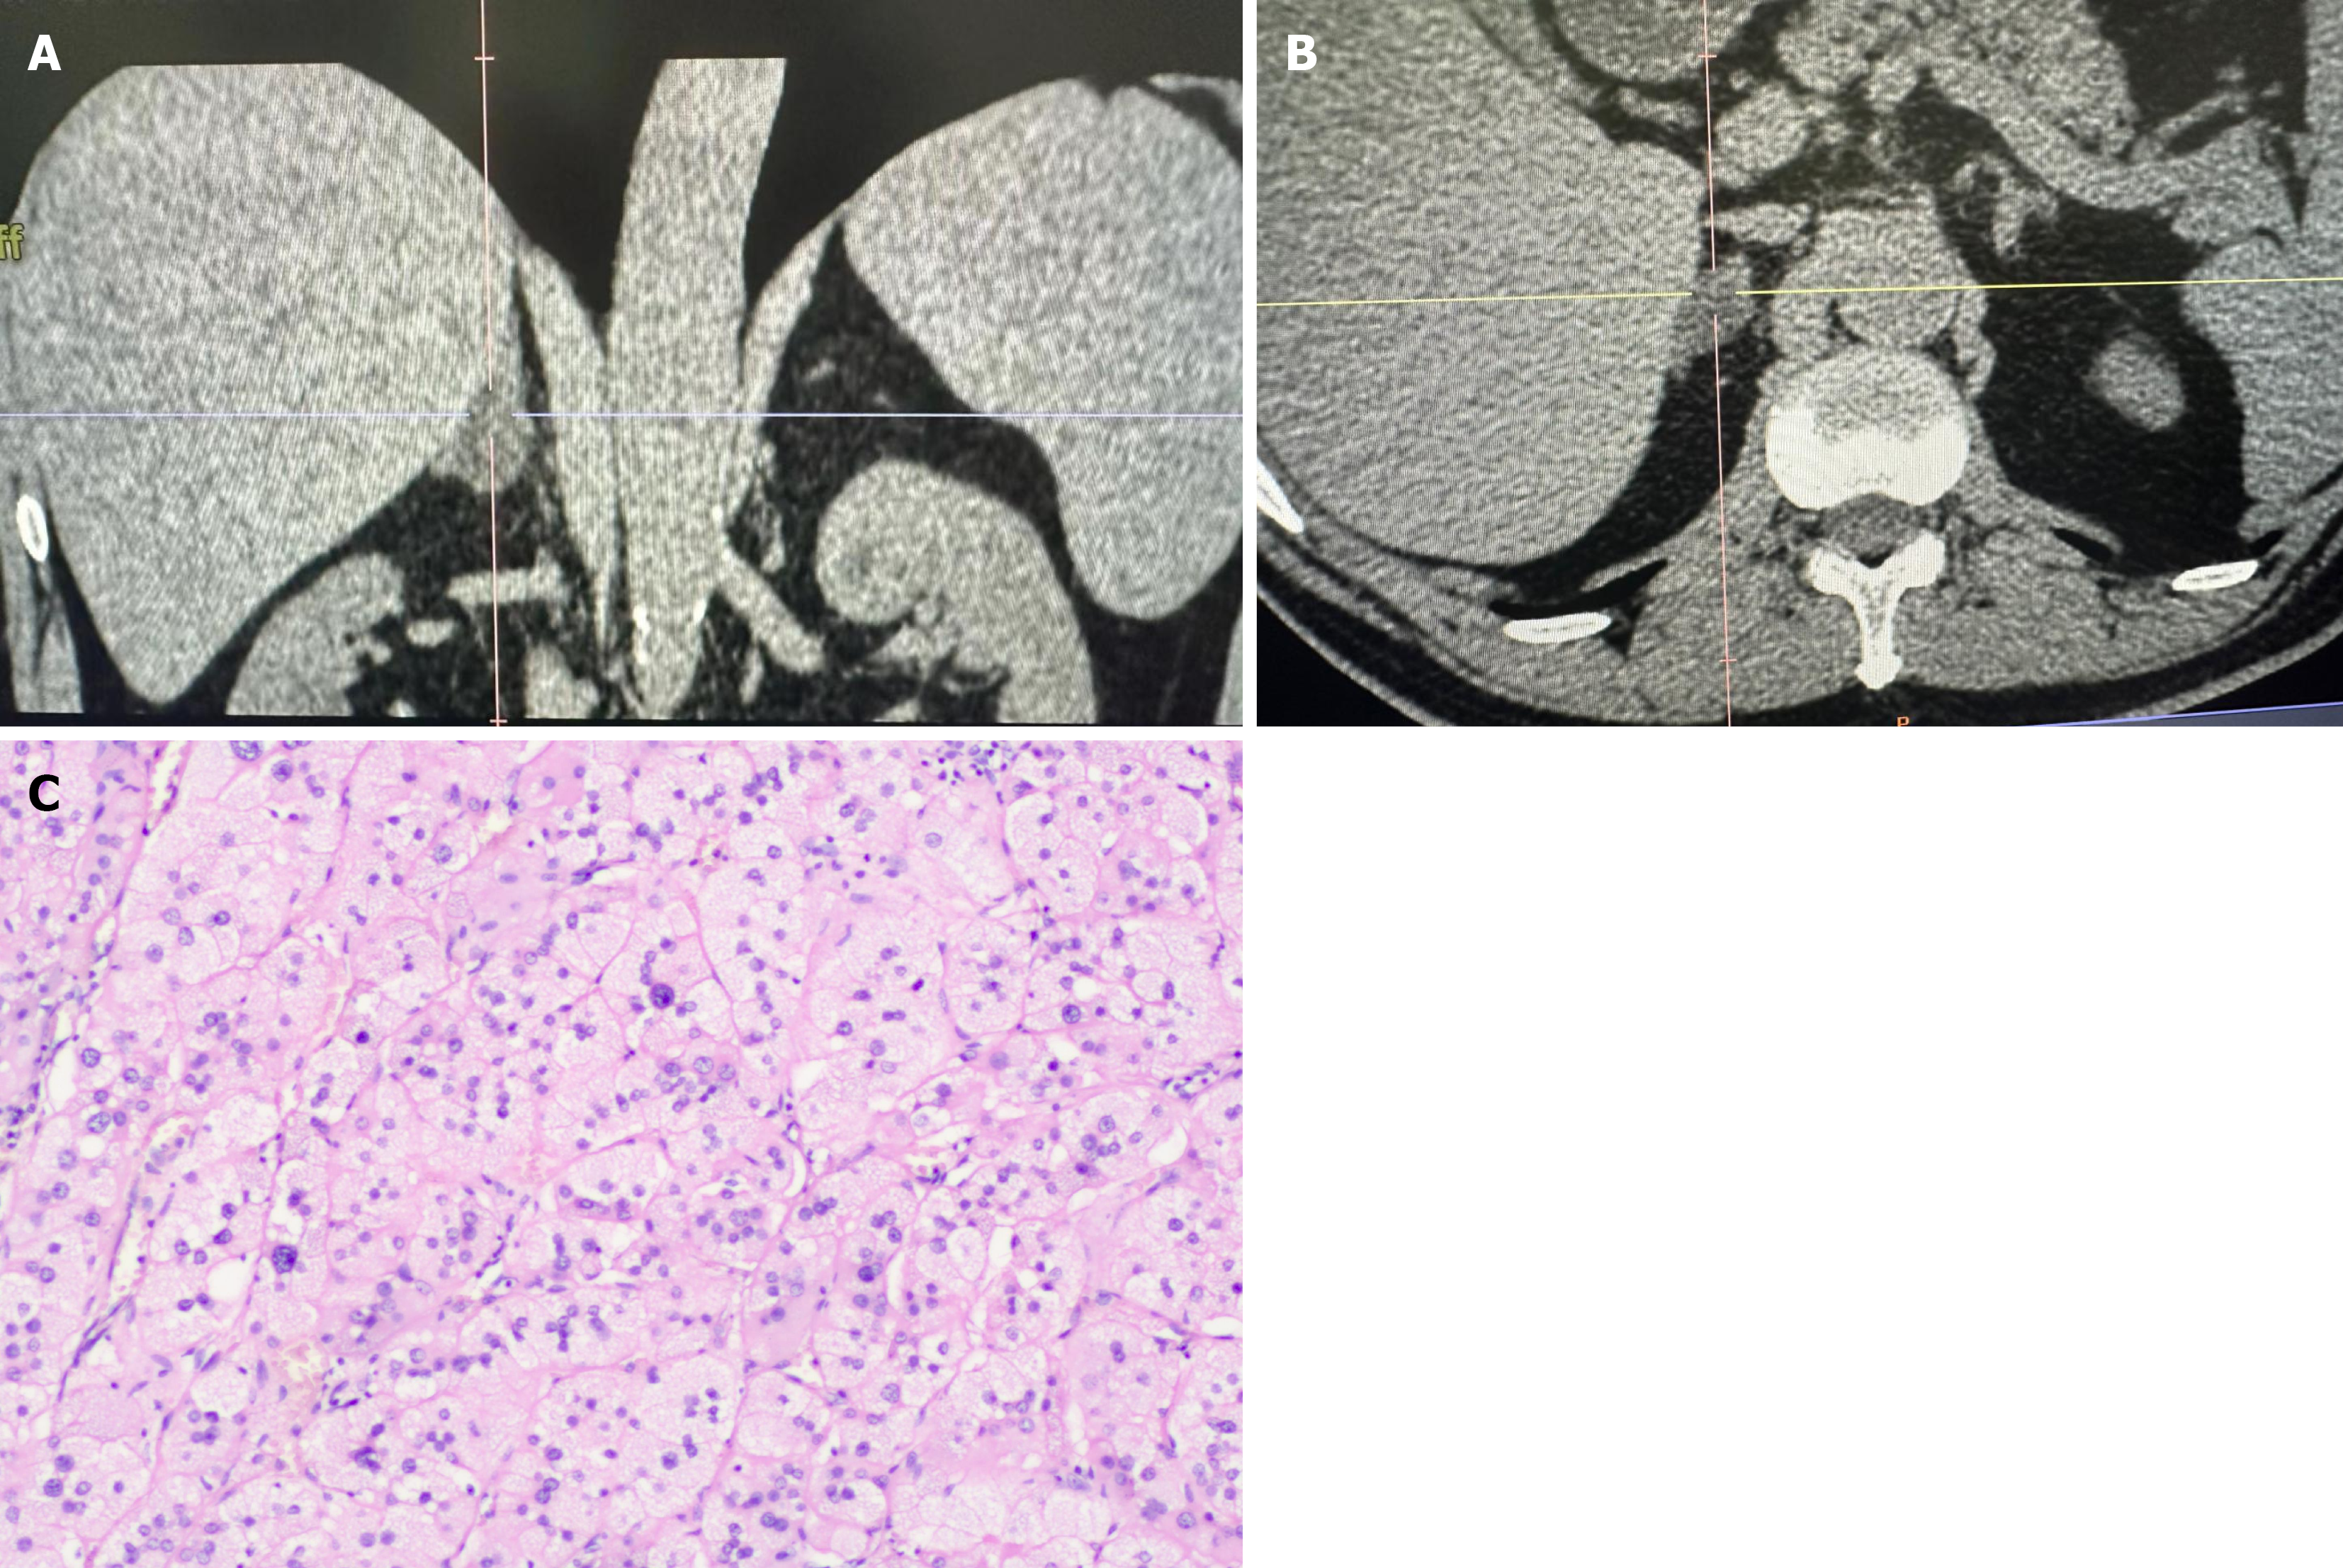
Figure 4 The adrenal pathology report indicated a benign adrenal cortical tumor.
A: Cross-hair marker indicating the right adrenal tumor; B: Cross-hair marker indicating the right adrenal tumor; C: Right adrenal tumor findings: Hematoxylin and eosin staining show a benign right adrenal tumor (magnification, × 100). The observed disorganized cellular architecture, nuclear enlargement, and inflammatory/Lymphocytic infiltration indicate significant pathological changes. The proportion is 50 µm.
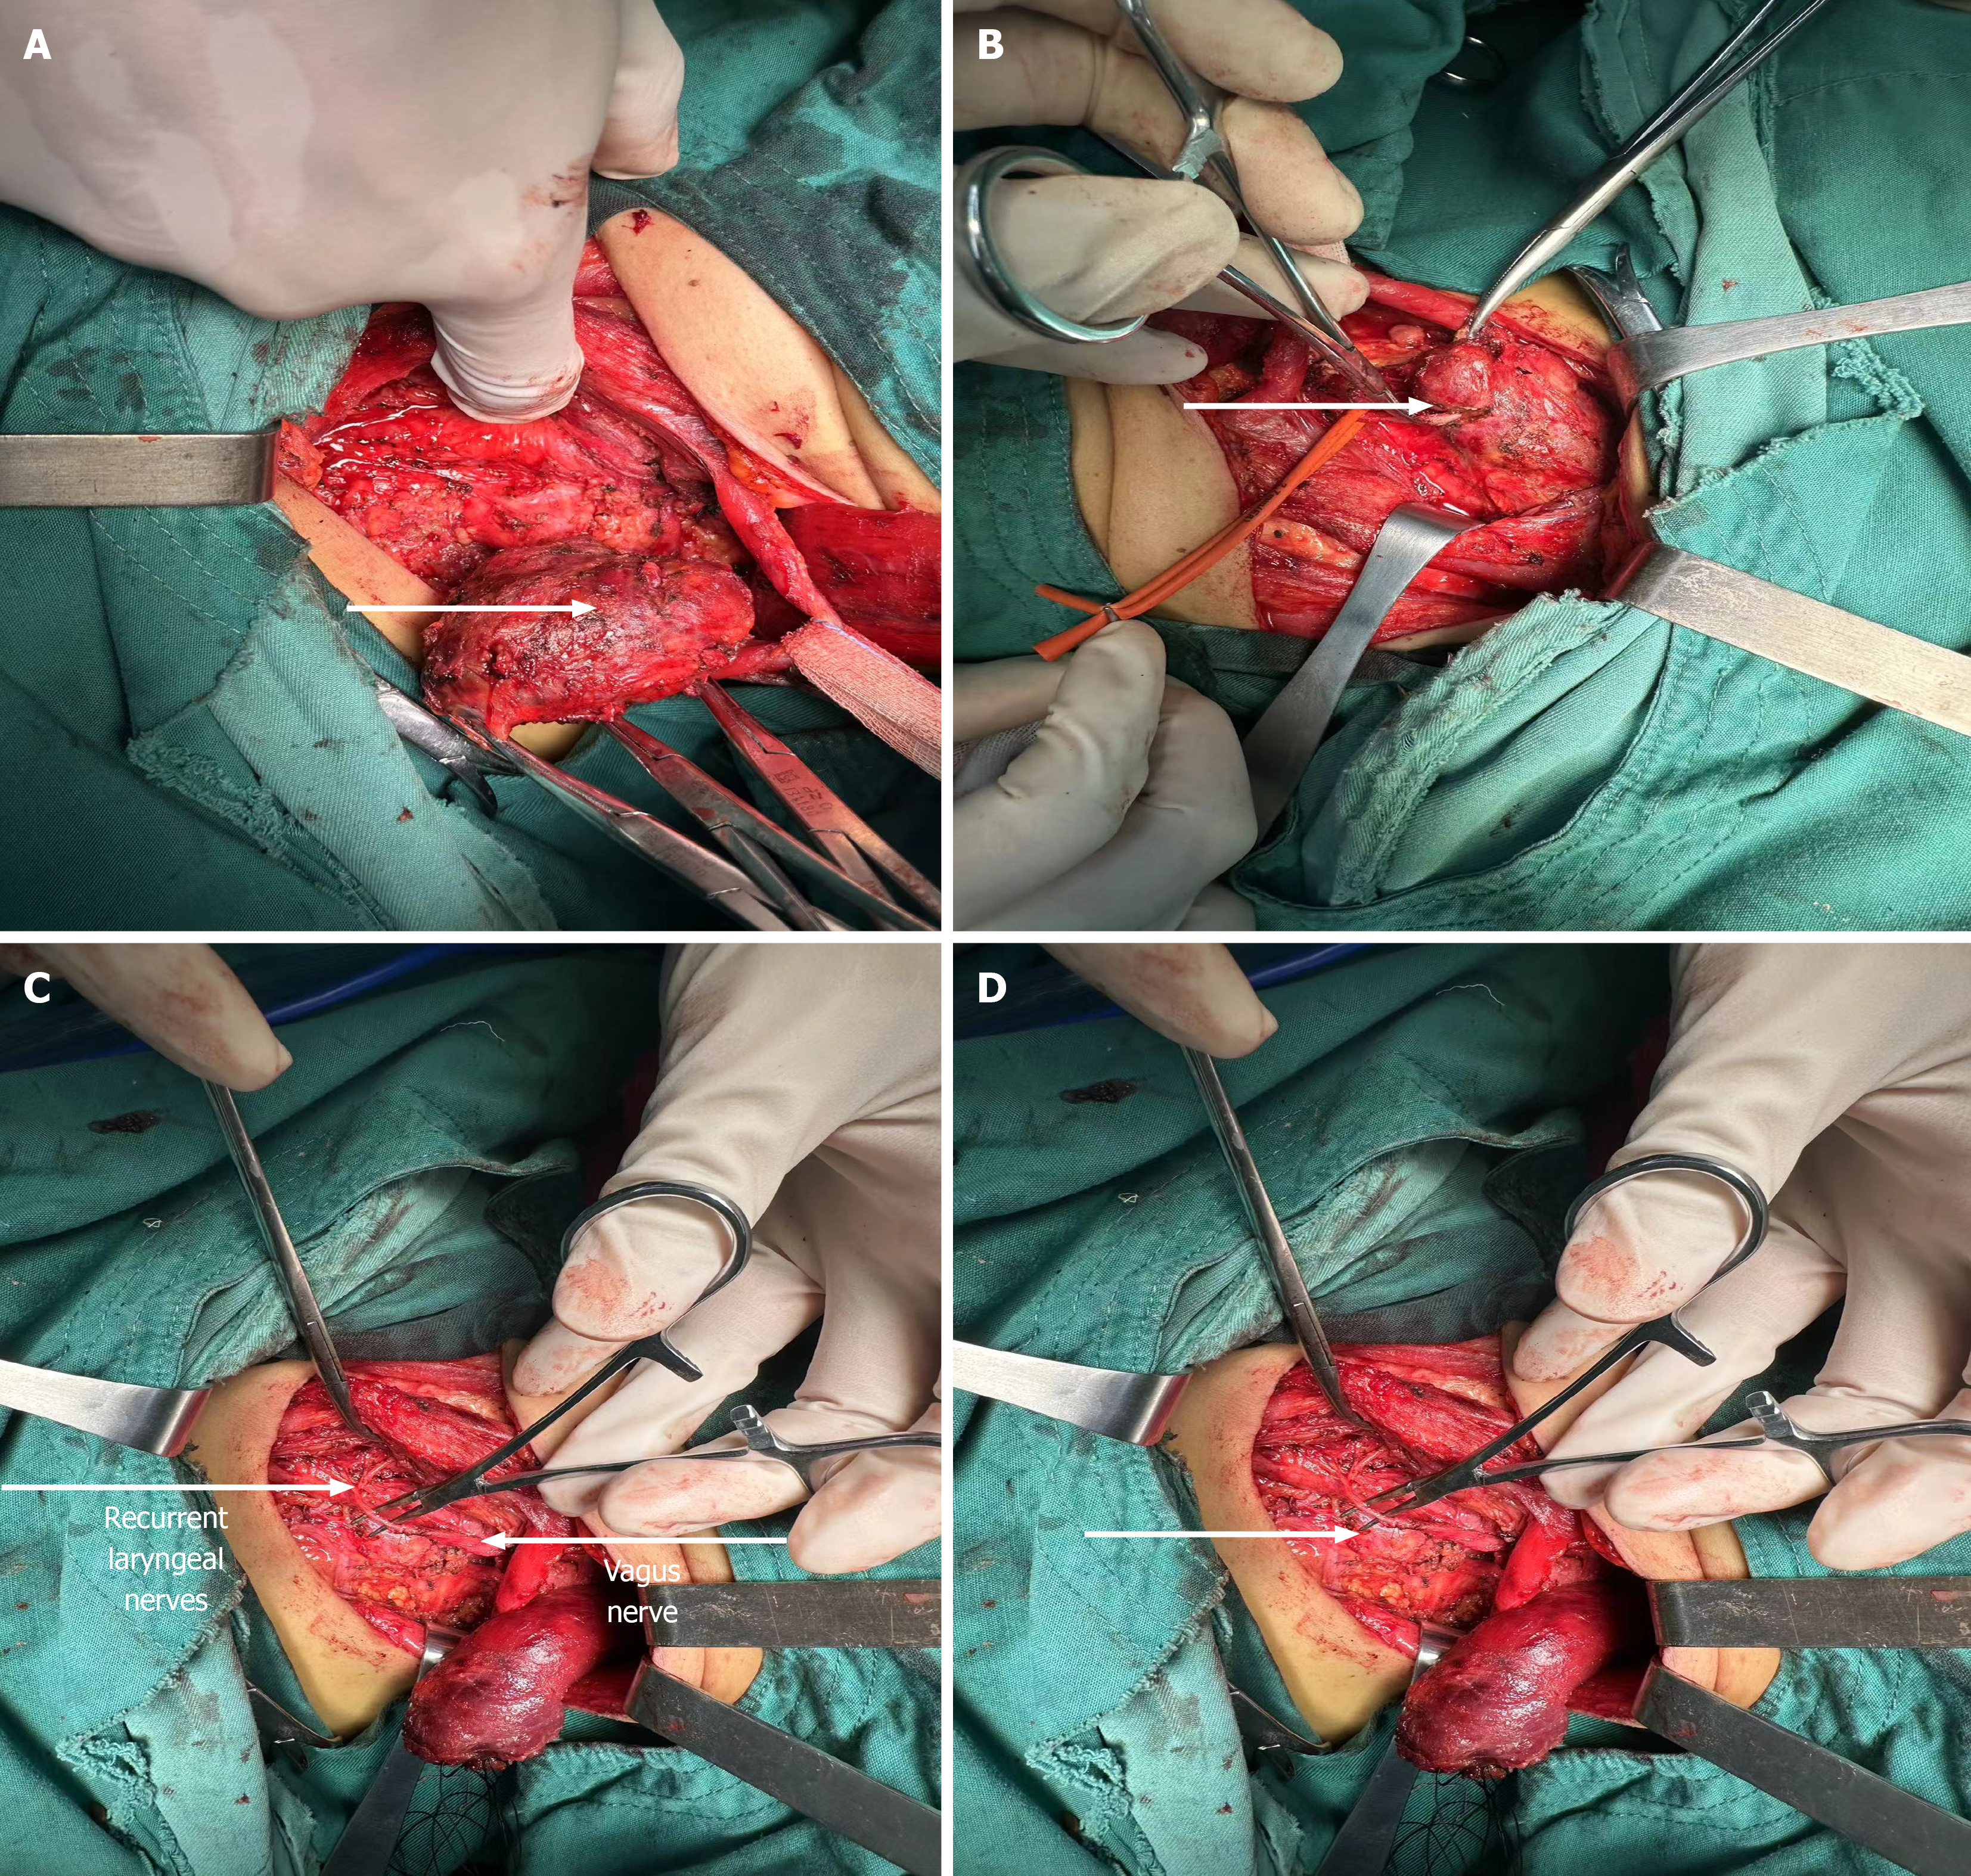
Figure 5 Immunohistochemistry result.
A: White arrow indicating the left neck tumor; B: White arrow indicating the complete invasion of the tumor into the vagus nerve; C: White arrows pointing to the cut ends of the vagus and recurrent laryngeal nerves; D: White arrow indicating the condition following vagus-recurrent laryngeal nerve anastomosis.
Figure 6 Hematoxylin and eosin staining showing classic papillary thyroid carcinoma.
A: The right thyroid (magnification, × 100); B: The left neck mass (magnification, × 100). The proportion is 50 µm.
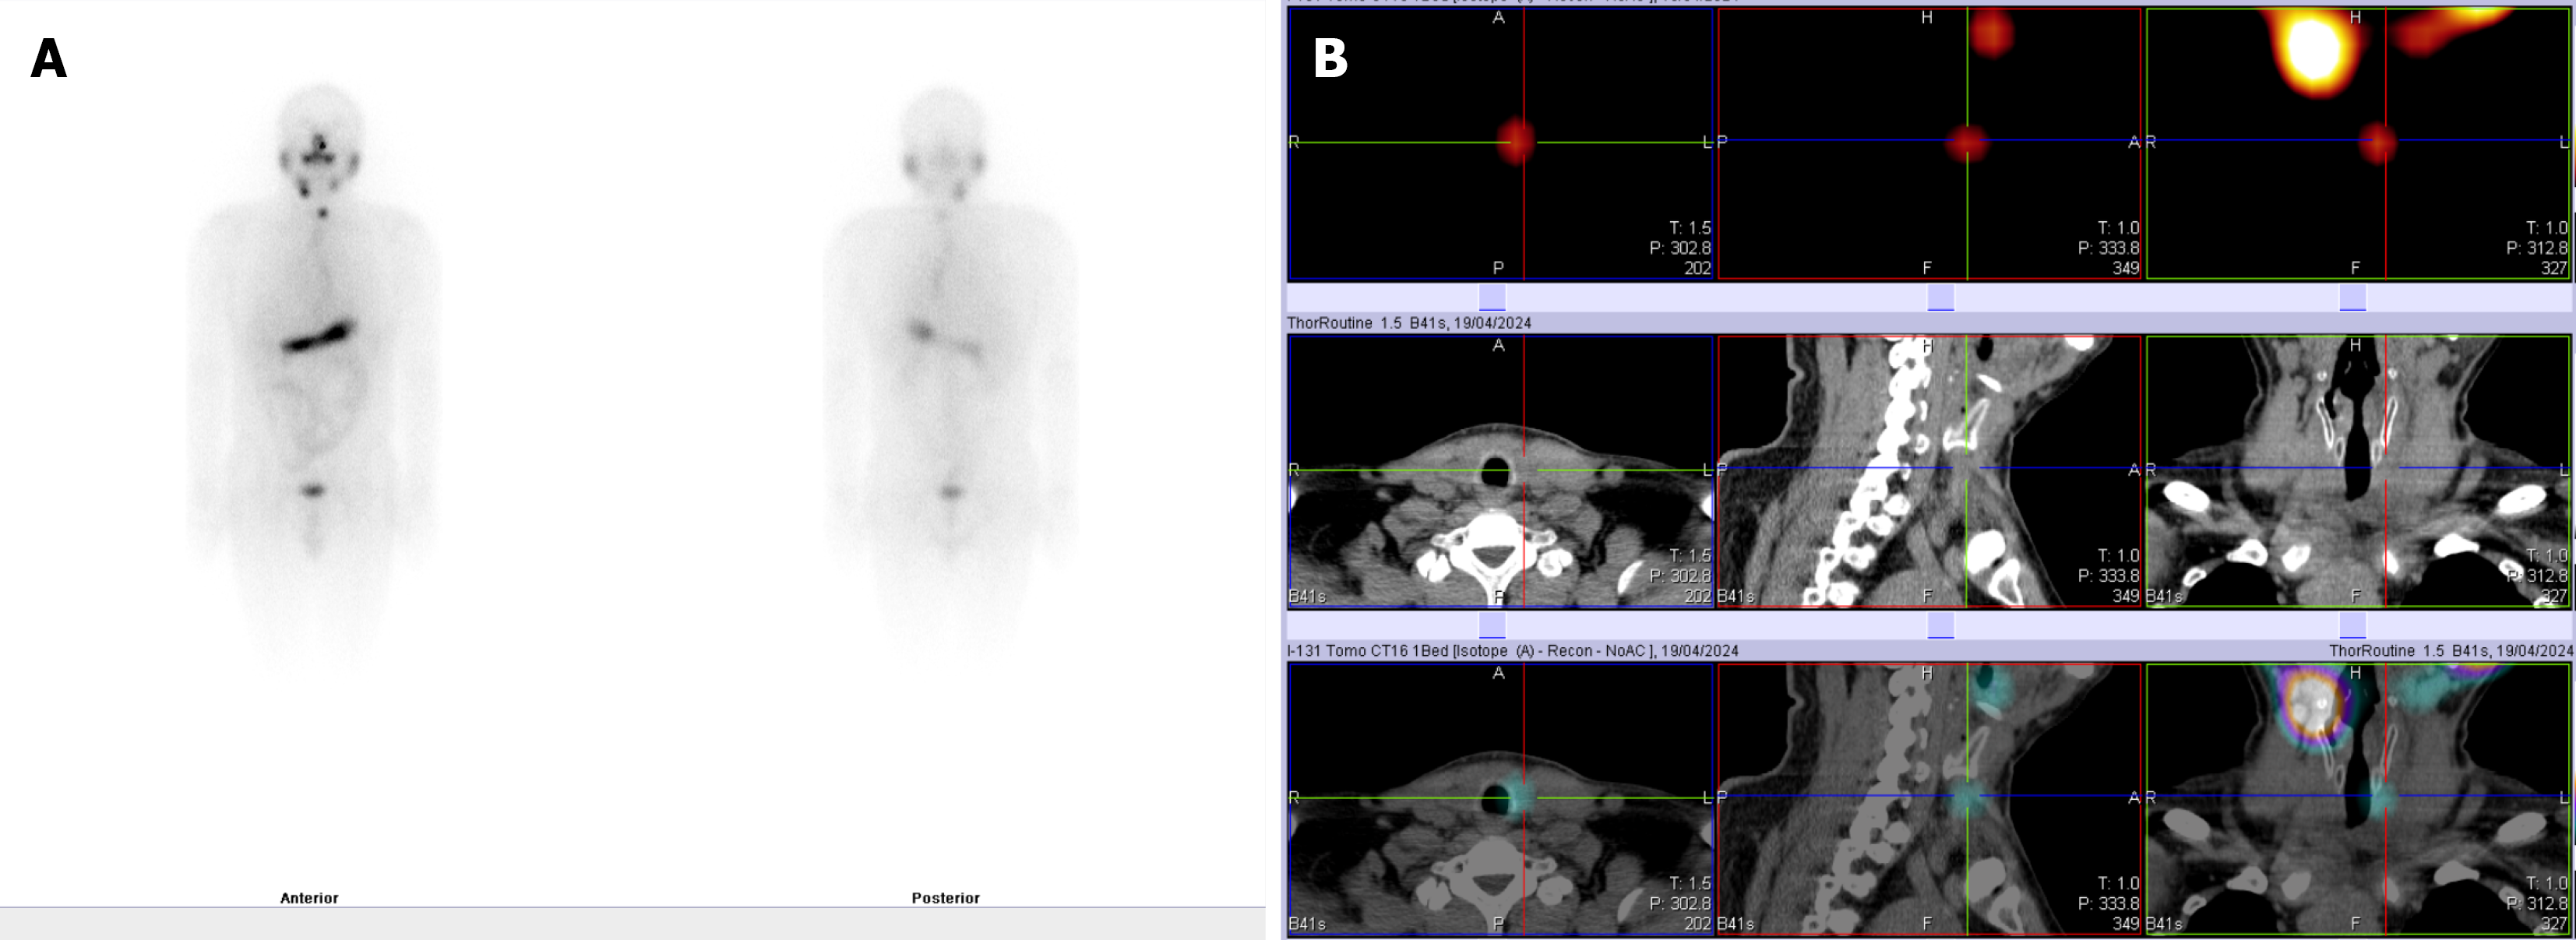
Figure 7 The patient received radioactive iodine (I-131) treatment and TSH suppression therapy postoperatively.
A: Whole-body I-131 imaging; B: I-131 imaging for targeted treatment.
- Citation: Li YL, Xia XL, Zhang SY, Tang L, Liu LN, Liu LS. Contralateral metastatic papillary thyroid carcinoma and complicated by primary hyperaldosteronism: A case report. World J Clin Cases 2025; 13(30): 108828
- URL: https://www.wjgnet.com/2307-8960/full/v13/i30/108828.htm
- DOI: https://dx.doi.org/10.12998/wjcc.v13.i30.108828


