©The Author(s) 2025.
World J Clin Cases. Sep 6, 2025; 13(25): 105204
Published online Sep 6, 2025. doi: 10.12998/wjcc.v13.i25.105204
Published online Sep 6, 2025. doi: 10.12998/wjcc.v13.i25.105204
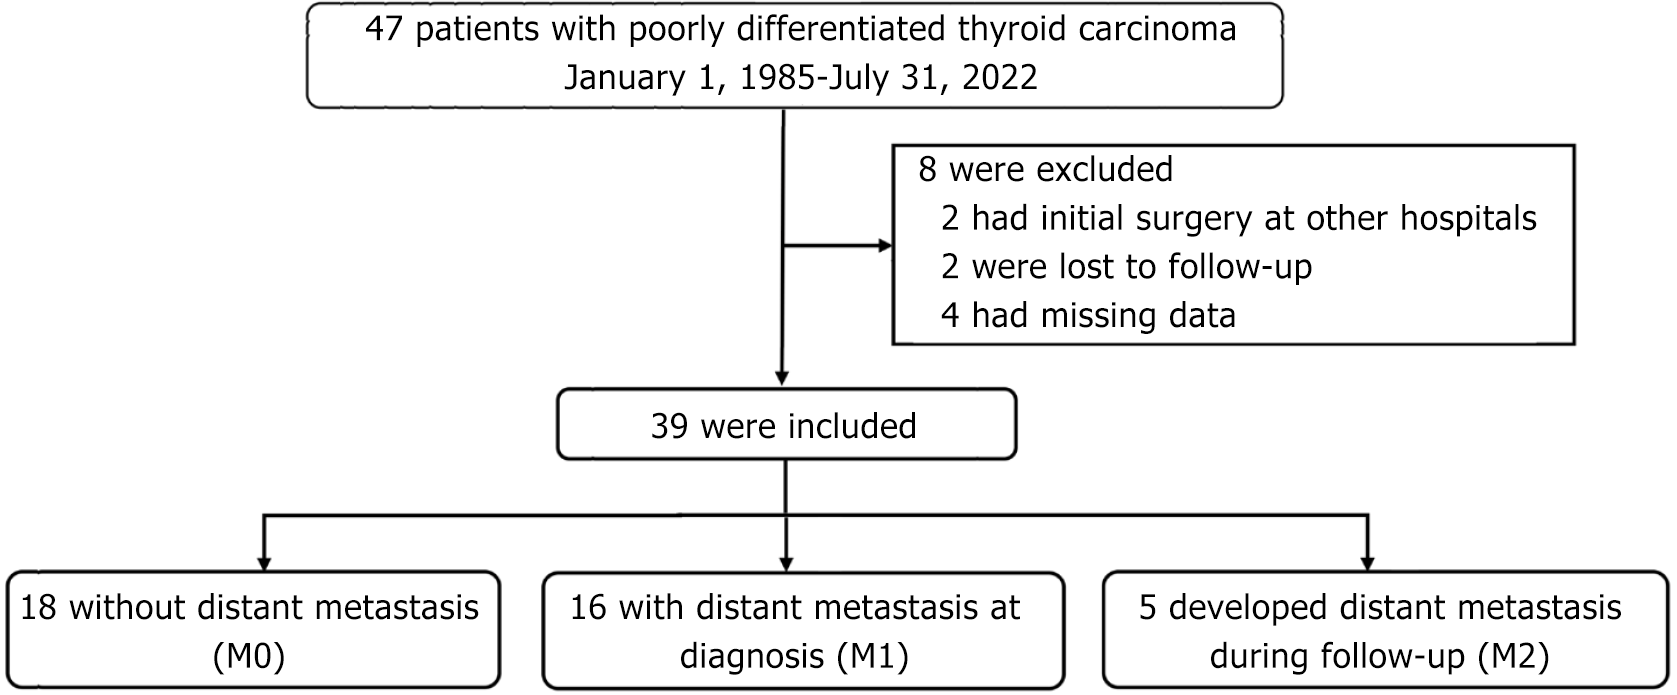
Figure 1 Flowchart of cohort establishment.
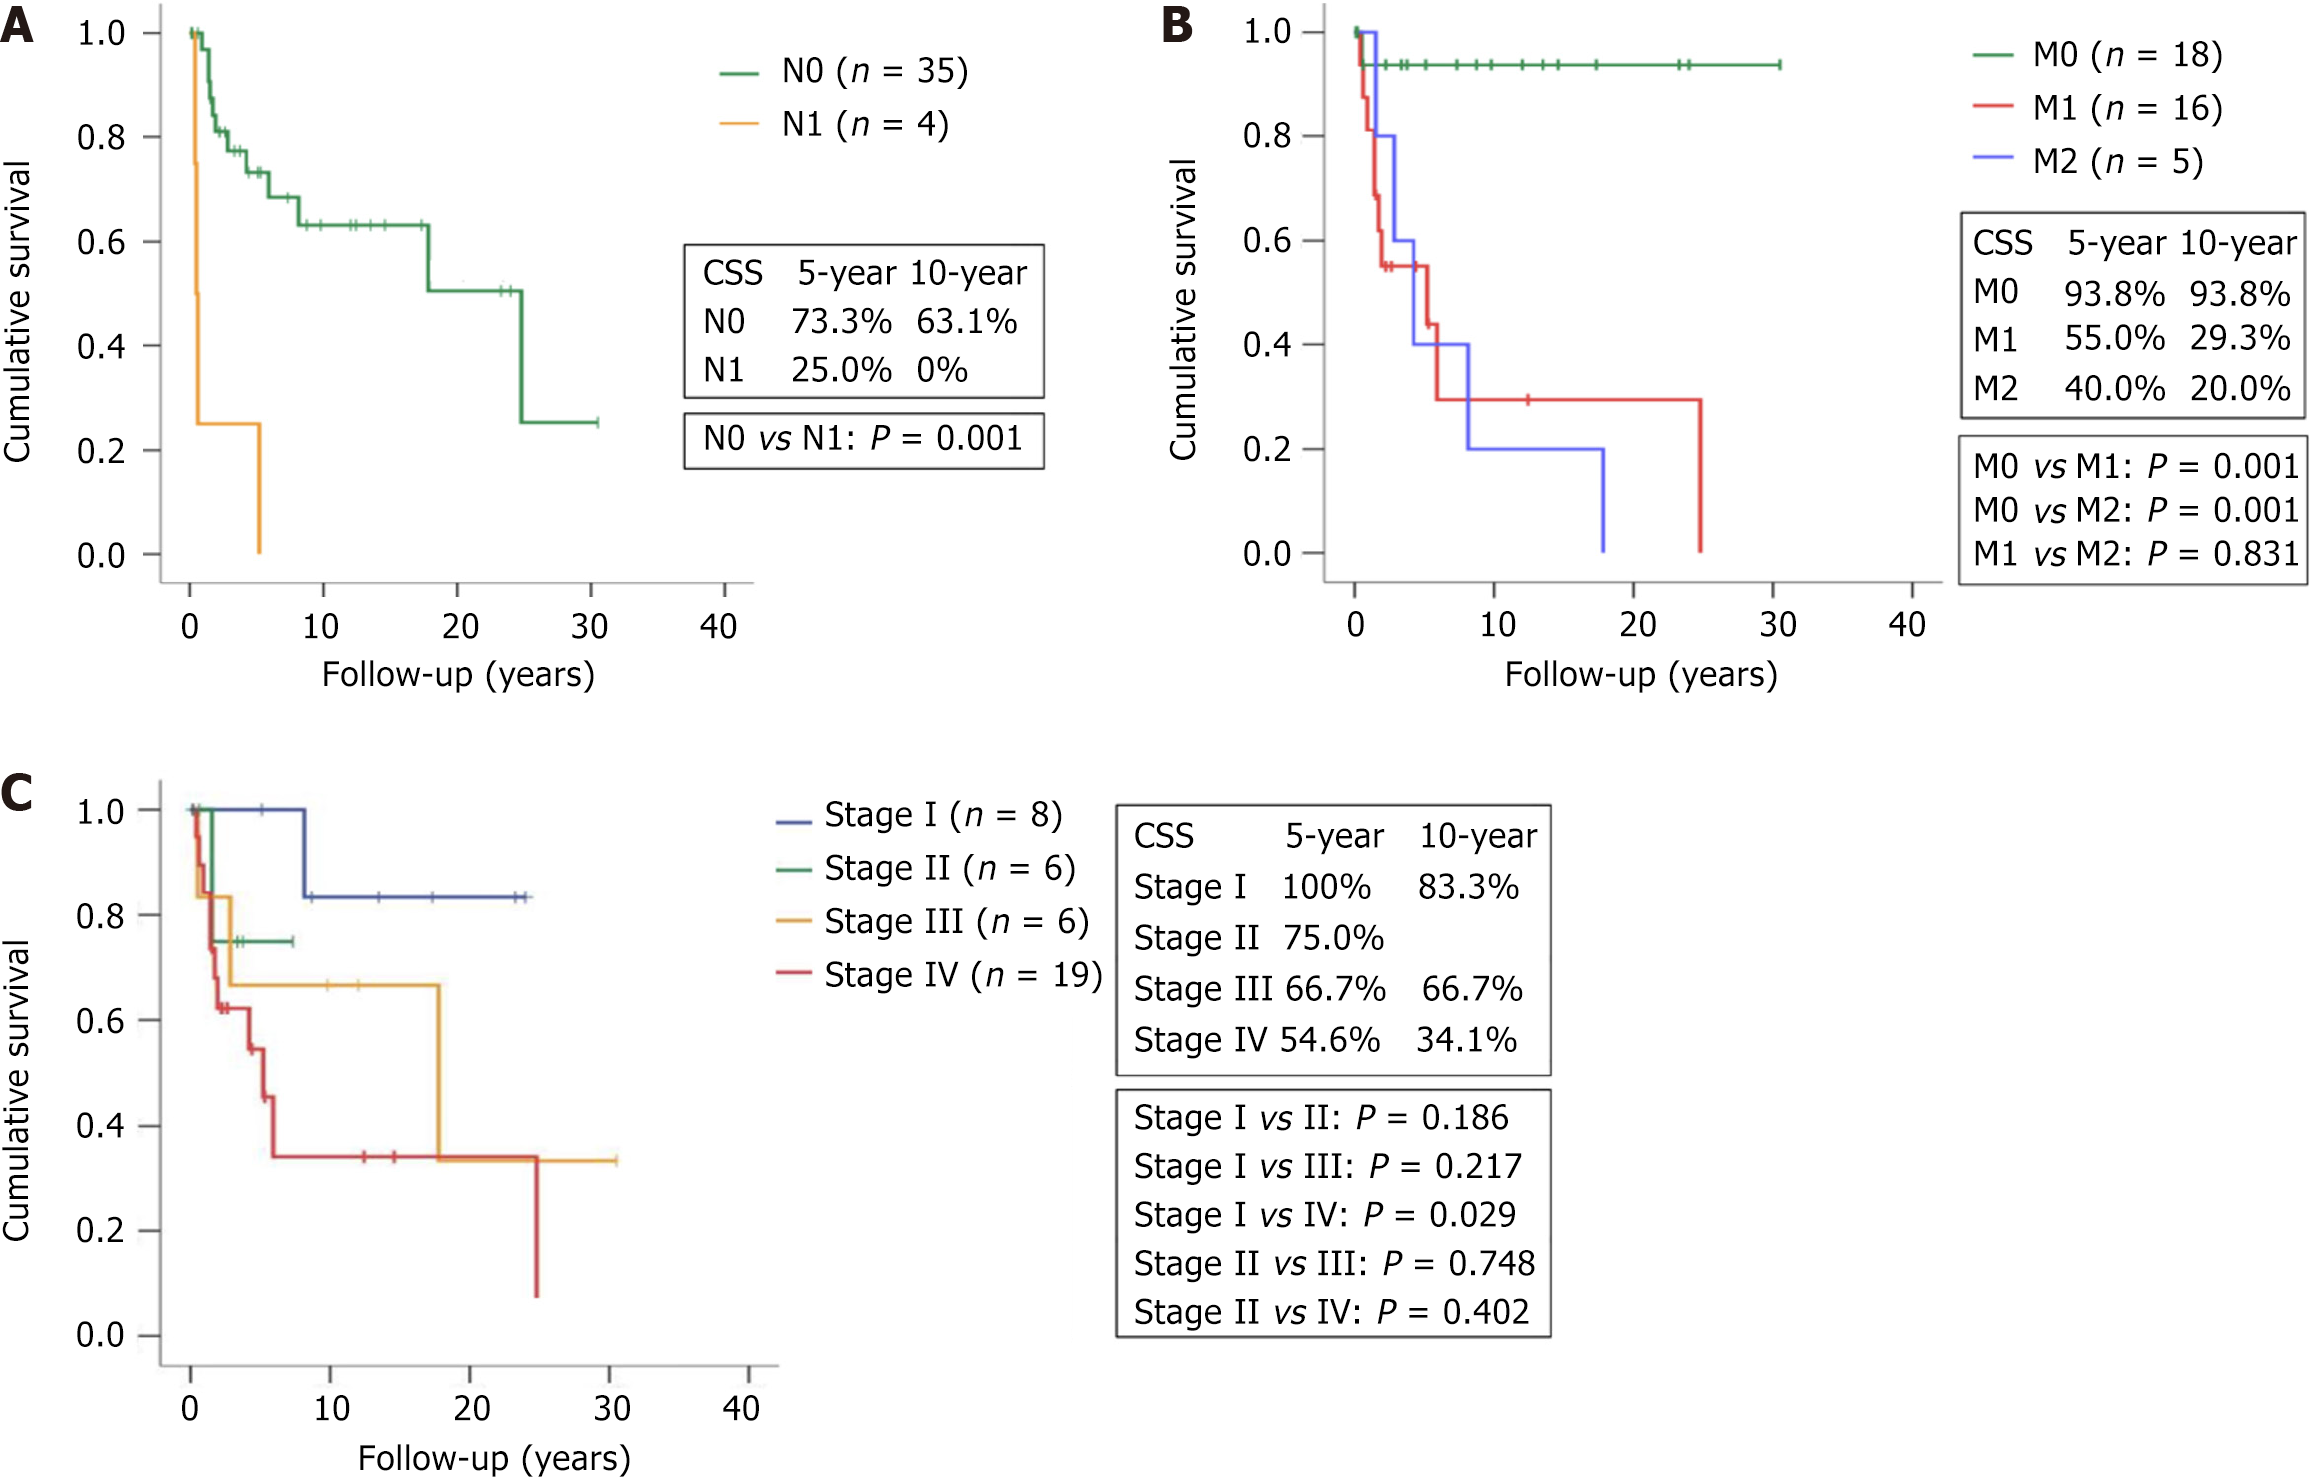
Figure 2 Kaplan–Meier curves of cancer-specific survival in poorly differentiated thyroid carcinoma patients.
A: Kaplan–Meier survival curves for patients with (N1) and without (N0) lymph node metastasis; B: Kaplan–Meier survival curves for patients with distant metastasis at presentation (M1), distant metastasis developing during follow-up (M2), and no metastasis (M0); C: Kaplan–Meier survival curves for poorly differentiated thyroid carcinoma patients with stages I, II, III, and IV disease at diagnosis.
- Citation: Hsu CW, Hsueh C, Lu YL, Hsu CJ, Wong RJ, Lin SF. Risk factors and outcomes of metastatic poorly differentiated thyroid carcinoma. World J Clin Cases 2025; 13(25): 105204
- URL: https://www.wjgnet.com/2307-8960/full/v13/i25/105204.htm
- DOI: https://dx.doi.org/10.12998/wjcc.v13.i25.105204


