©The Author(s) 2024.
World J Clin Cases. Sep 6, 2024; 12(25): 5739-5748
Published online Sep 6, 2024. doi: 10.12998/wjcc.v12.i25.5739
Published online Sep 6, 2024. doi: 10.12998/wjcc.v12.i25.5739
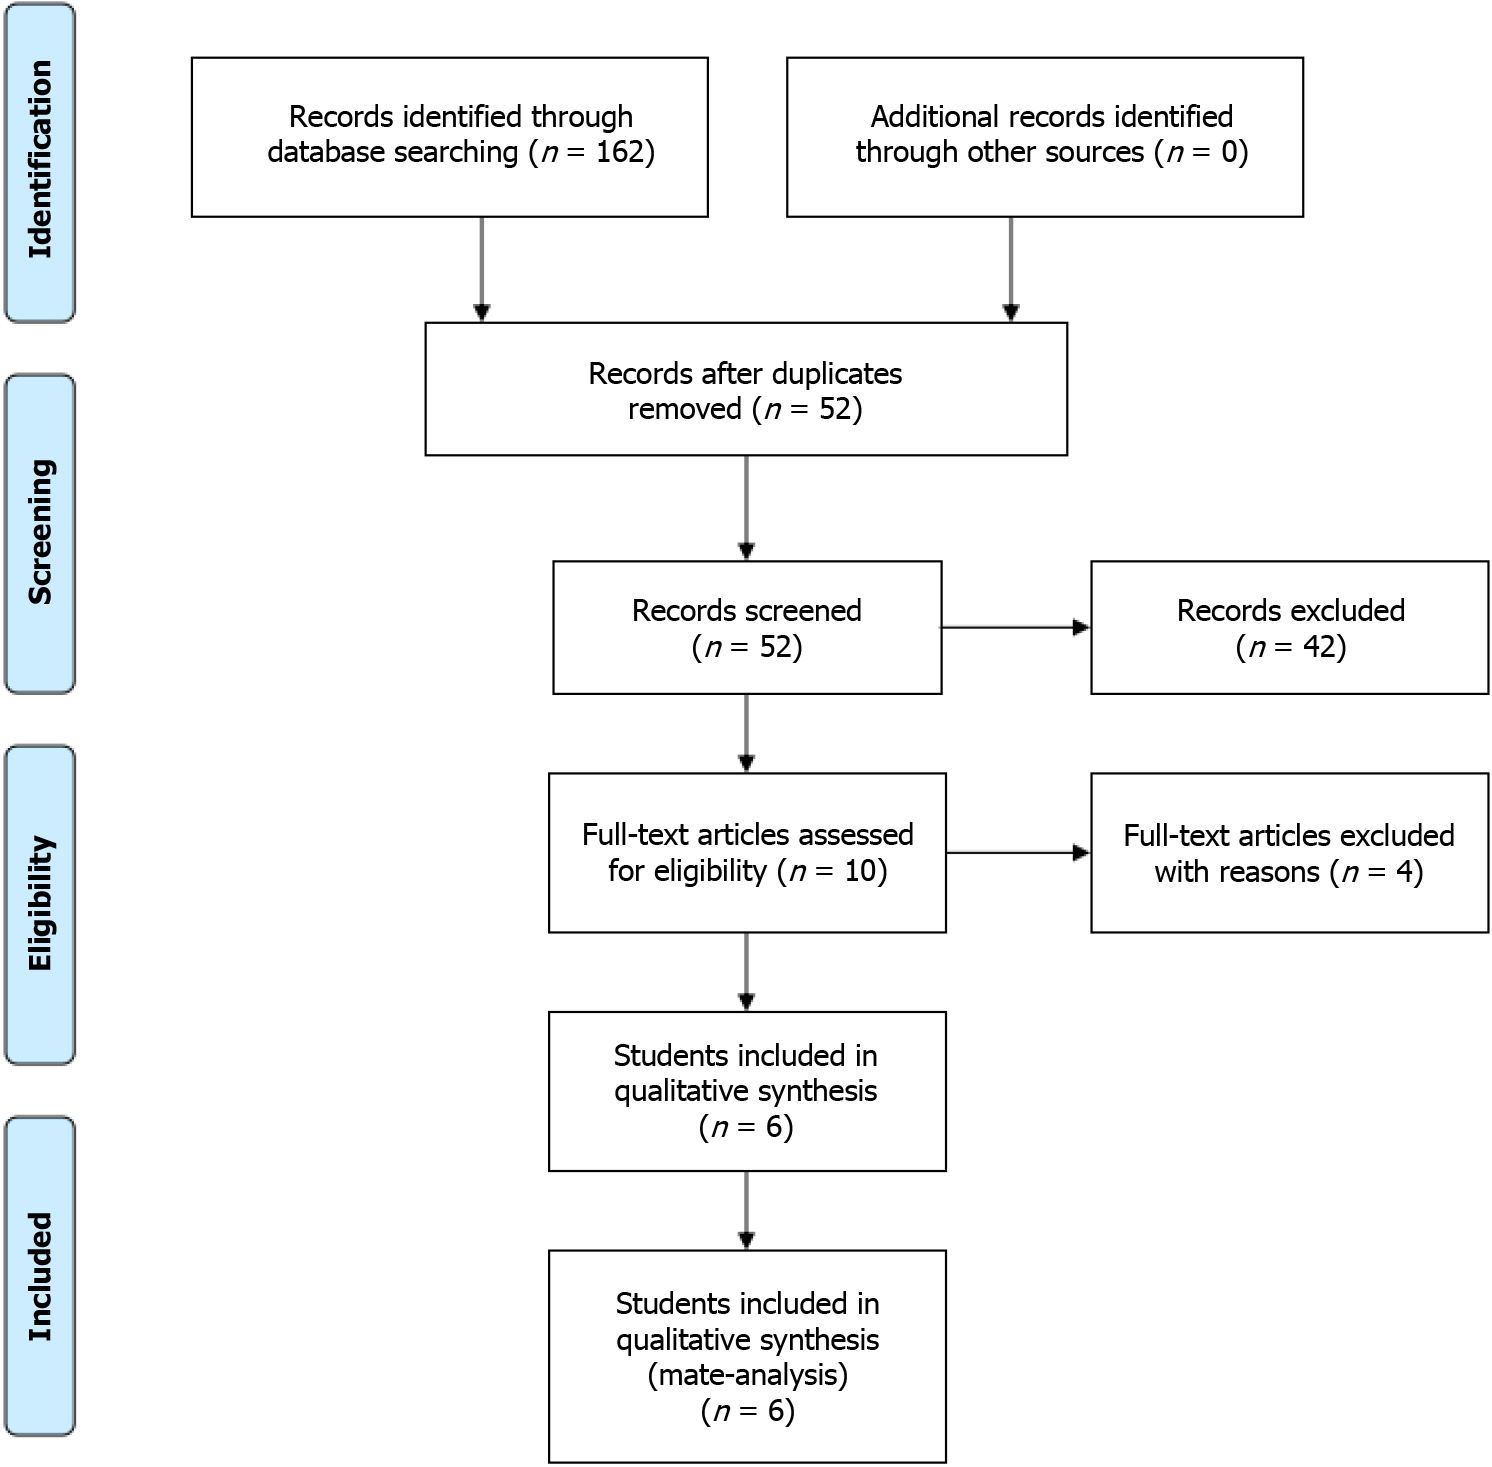
Figure 1 Flow diagram of the literature search and study selection protocols.
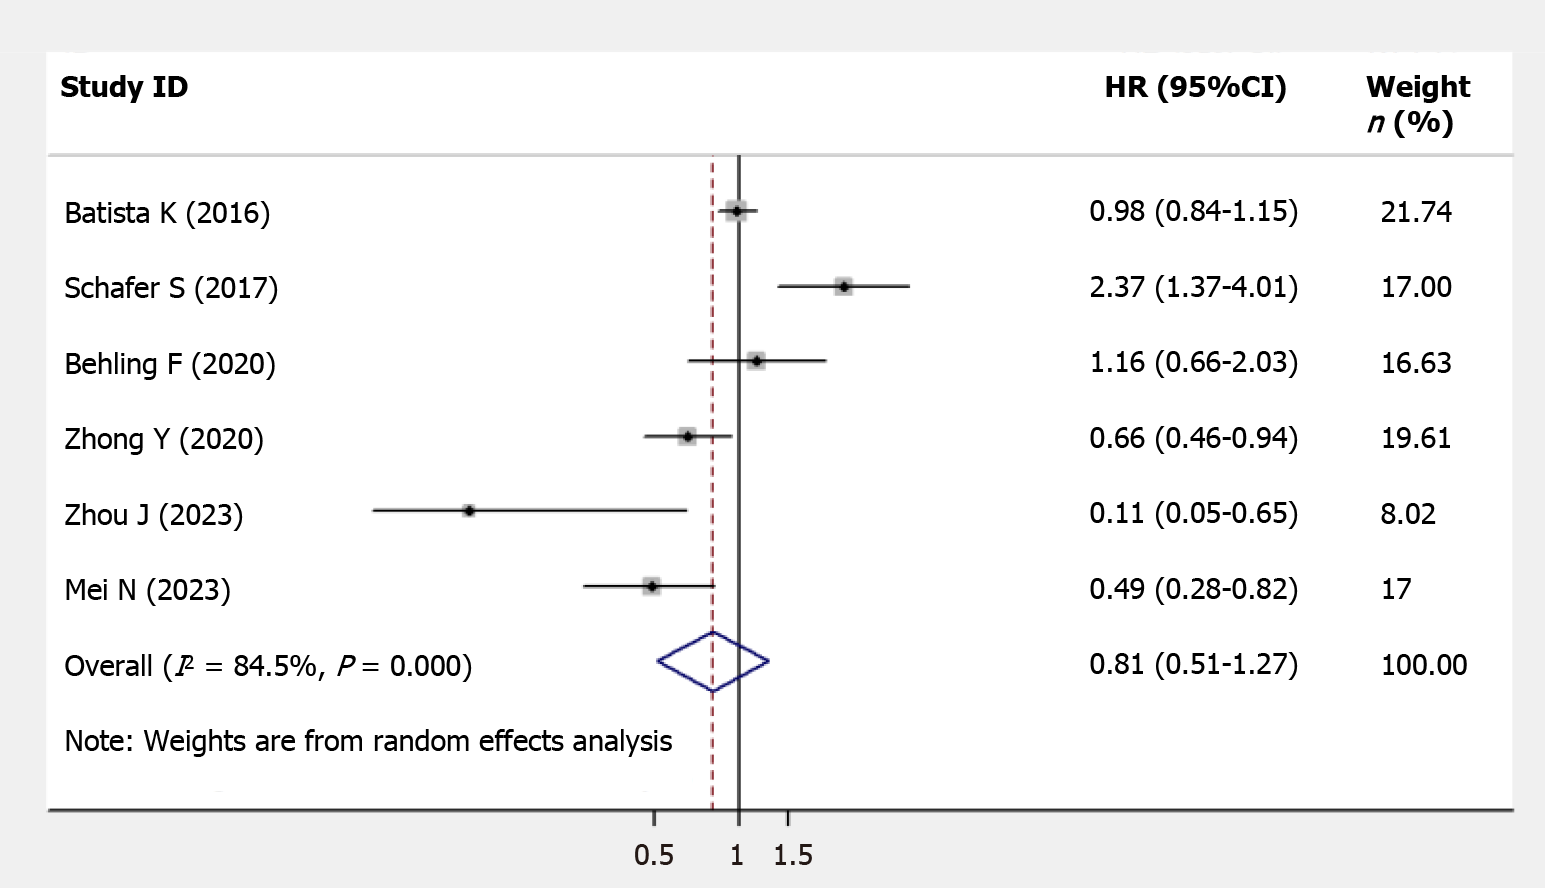
Figure 2 Forest plot illustrating the relationship between oligodendrocyte transcription factor 2 expression and overall survival in glioma patients.
Each study is accompanied by a point estimate of its hazard ratio (HR) and 95% confidence interval (CI) (extending lines). The diamonds represent the estimated pooled effect (labelled ‘total’).
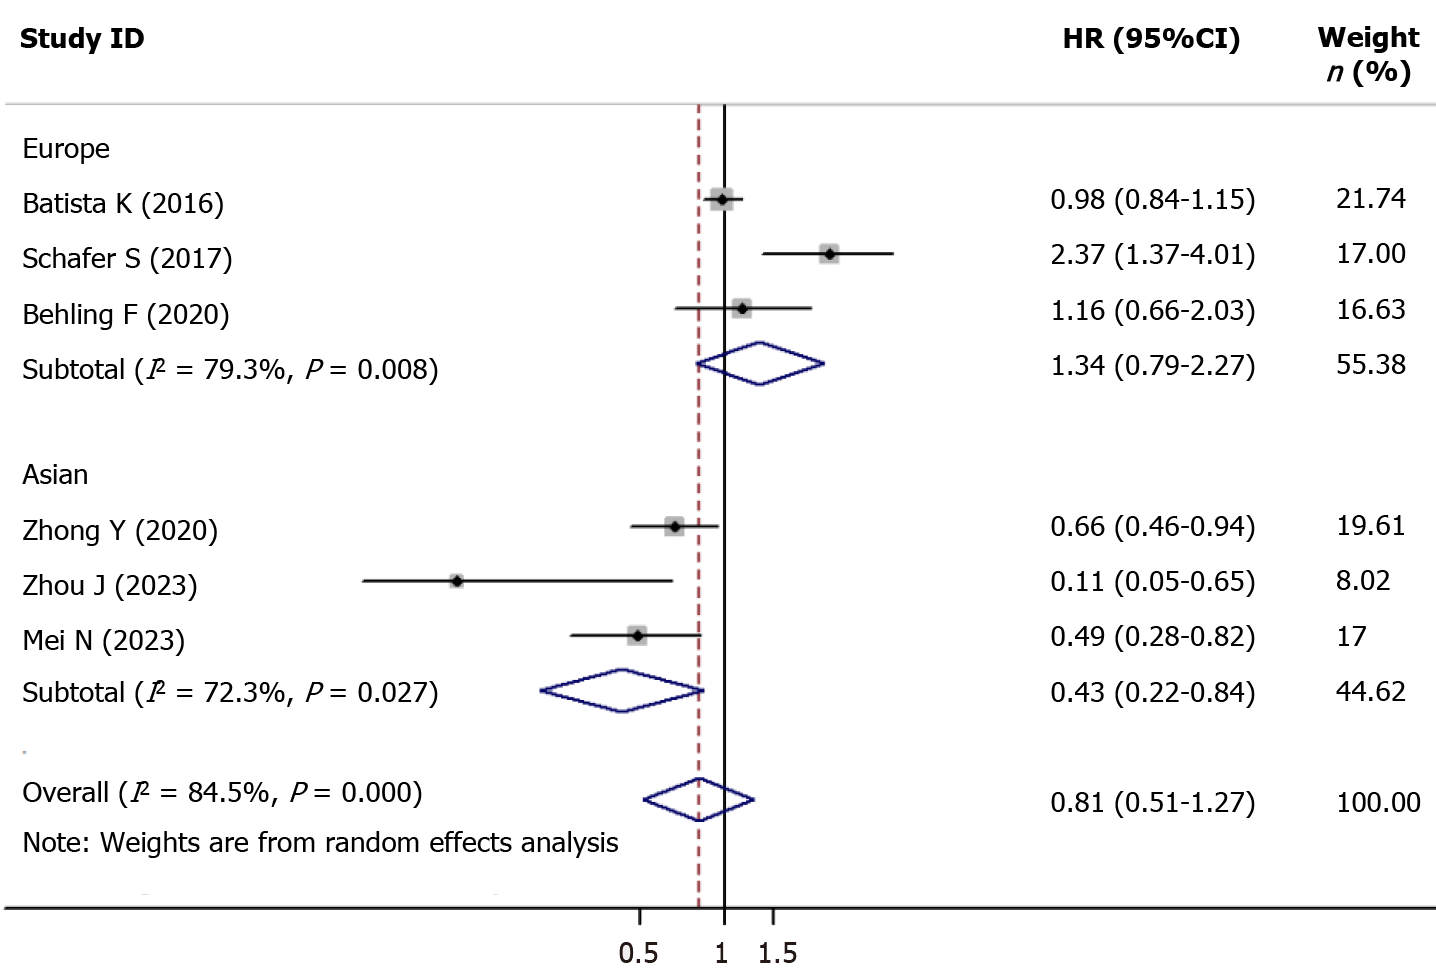
Figure 3 Forest plot for the association between oligodendrocyte transcription factor 2 expression and overall survival in terms of subgroup analysis of the testing index.
HR: Hazard ratio.
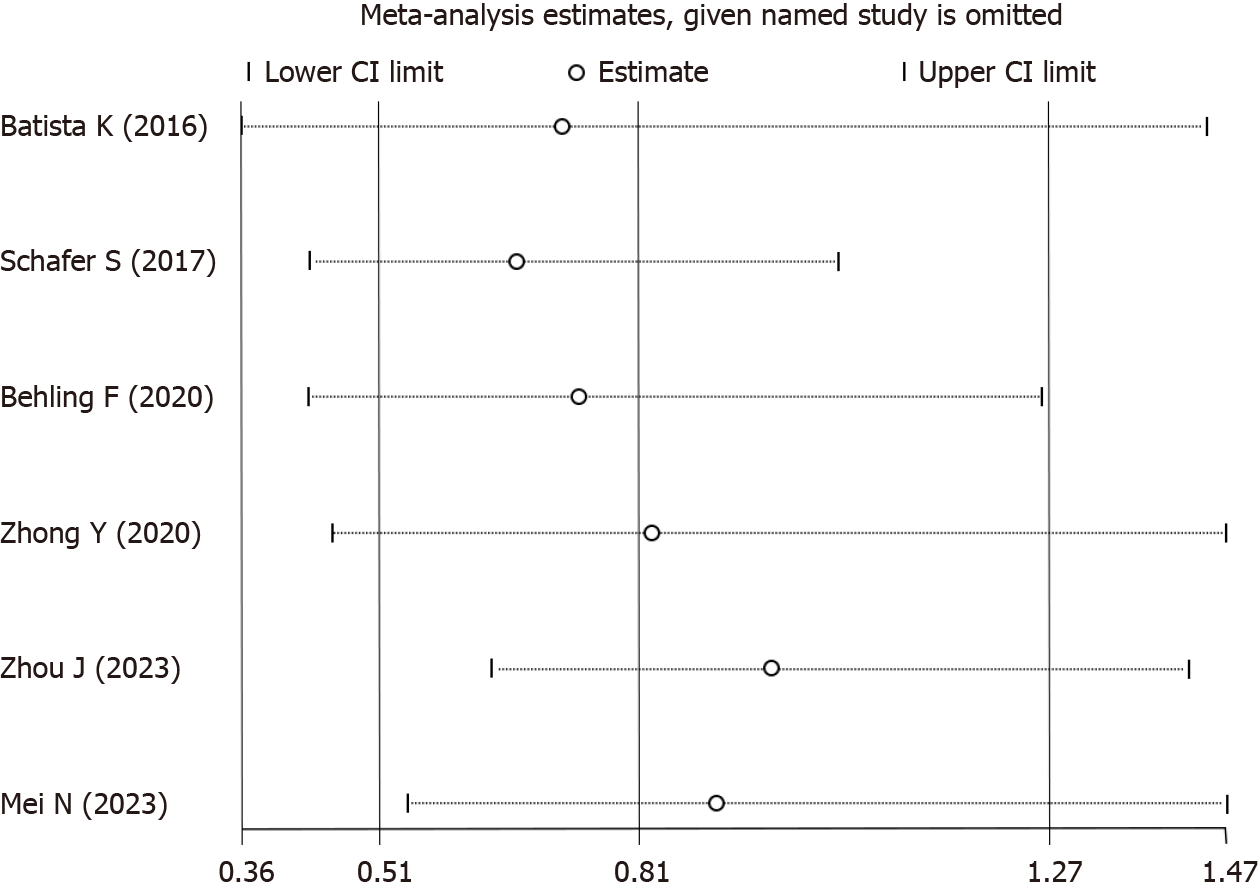
Figure 4 Sensitivity analysis of the relationship between oligodendrocyte transcription factor 2 and overall survival.
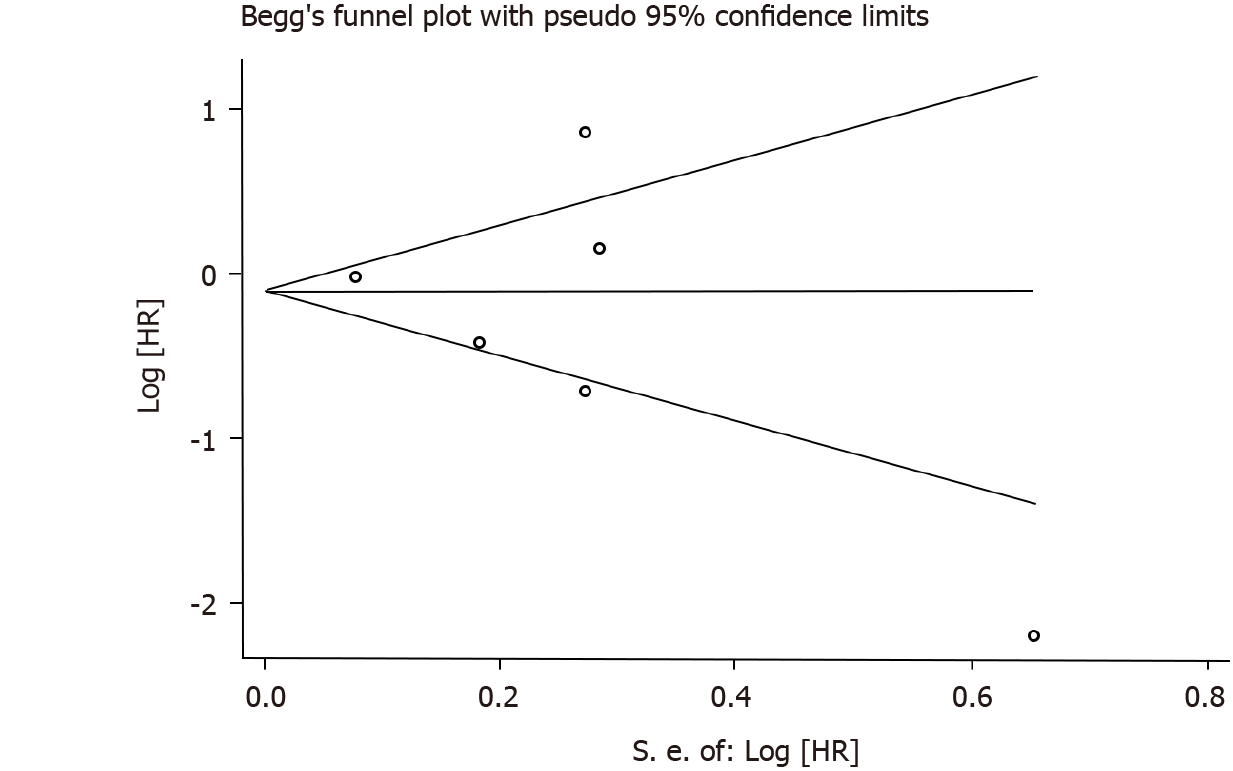
Figure 5 Begger’s funnel plot for the publication bias test of the oligodendrocyte transcription factor 2 expression and overall survival of gliomas.
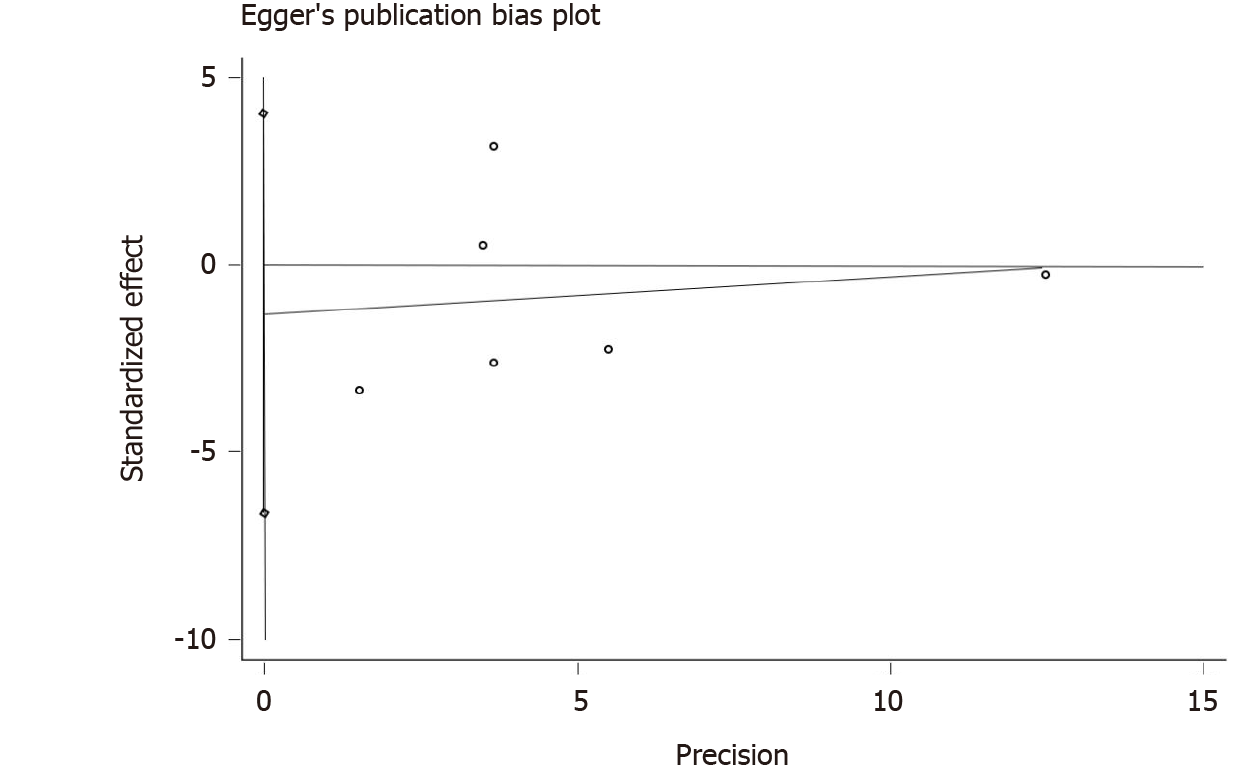
Figure 6 Egger’s funnel plot for the publication bias test of the oligodendrocyte transcription factor 2 expression and overall survival of gliomas.
- Citation: Li PC, Yun DB, Huang YX, Huang QY. Prognostic significance of oligodendrocyte transcription factor 2 expression in glioma patients: A systematic review and meta-analysis. World J Clin Cases 2024; 12(25): 5739-5748
- URL: https://www.wjgnet.com/2307-8960/full/v12/i25/5739.htm
- DOI: https://dx.doi.org/10.12998/wjcc.v12.i25.5739


