Copyright
©The Author(s) 2025.
World J Psychiatry. Oct 19, 2025; 15(10): 105932
Published online Oct 19, 2025. doi: 10.5498/wjp.v15.i10.105932
Published online Oct 19, 2025. doi: 10.5498/wjp.v15.i10.105932
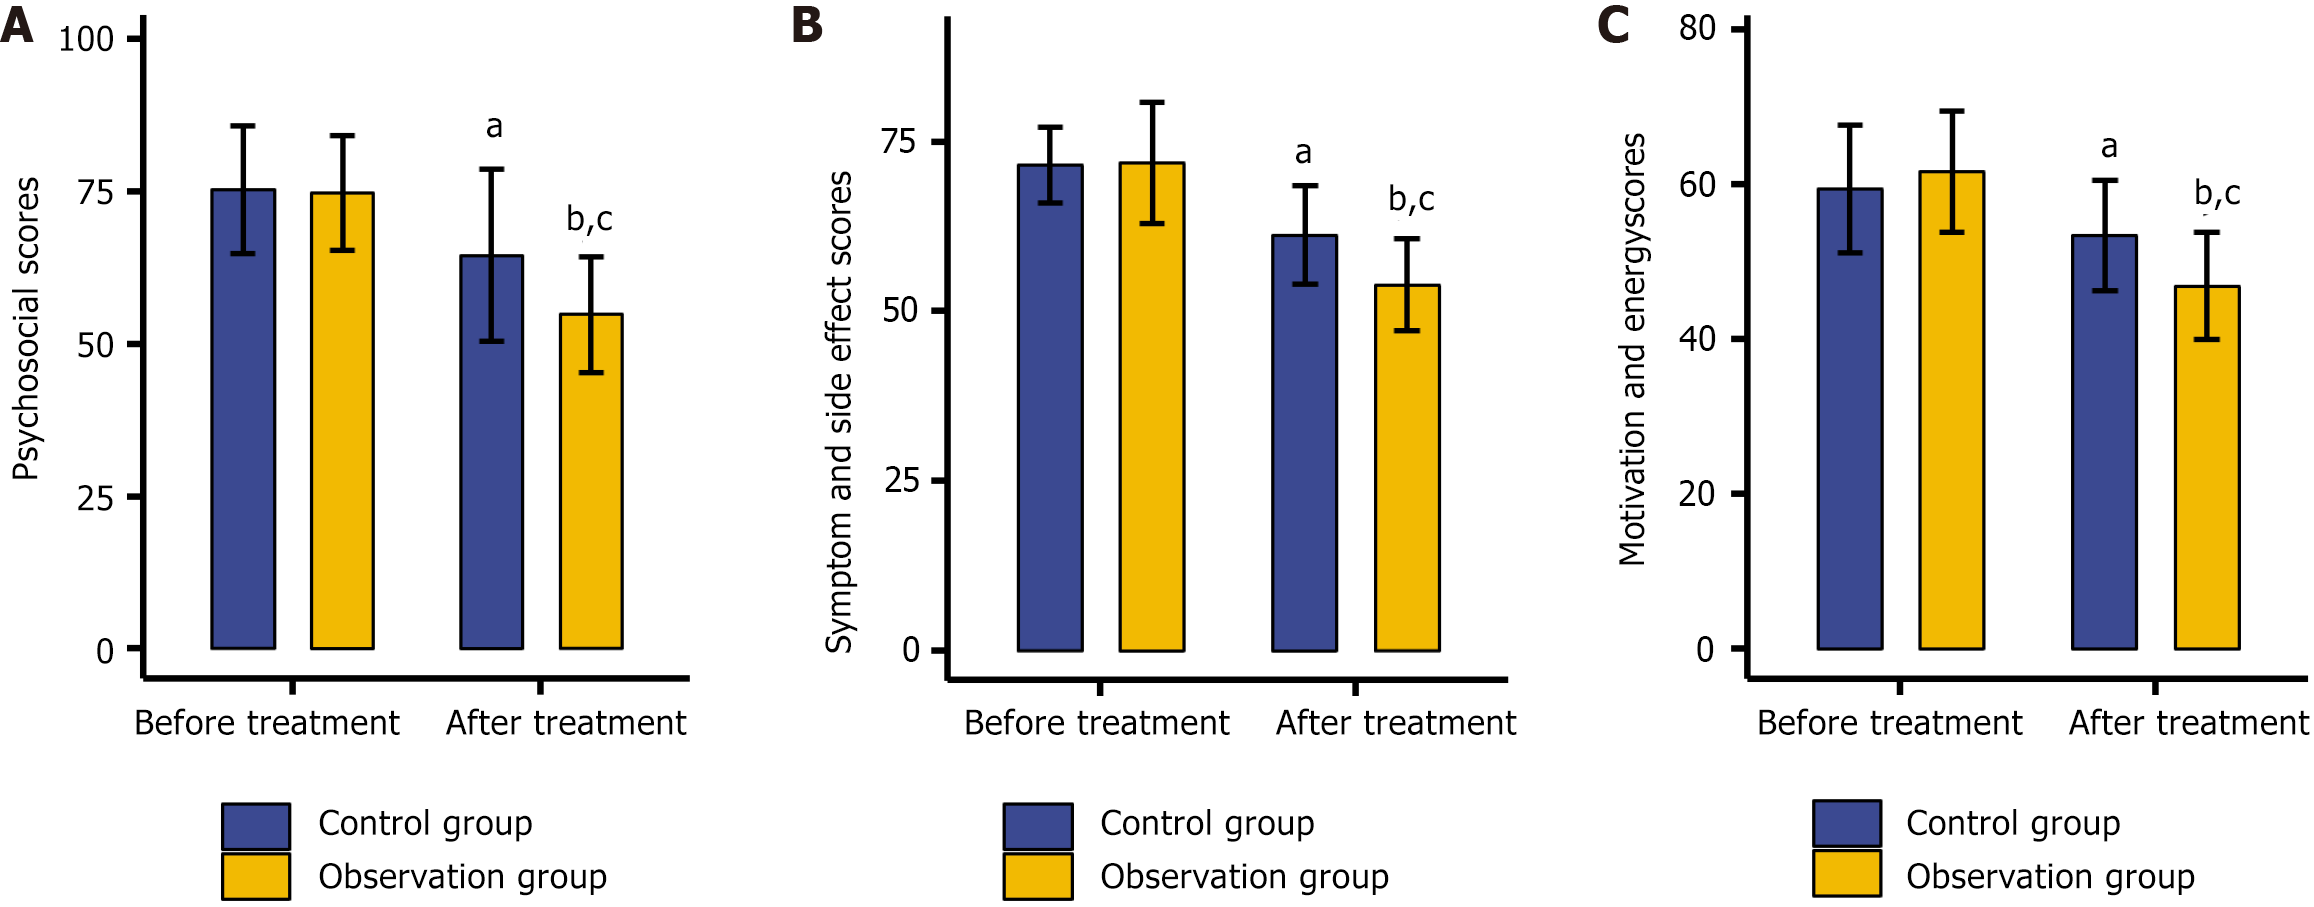
Figure 1 Quality of life evaluation of the two patient groups.
A: Pre-treatment and post-treatment psychosocial scores of the two groups; B: Pre-treatment and post-treatment symptoms and side effect scores of the two groups; C: Pre-treatment and post-treatment motivation and energy scores of the two groups. aP < 0.05 and bP < 0.01 vs the pre-treatment levels; cP < 0.05 vs control.
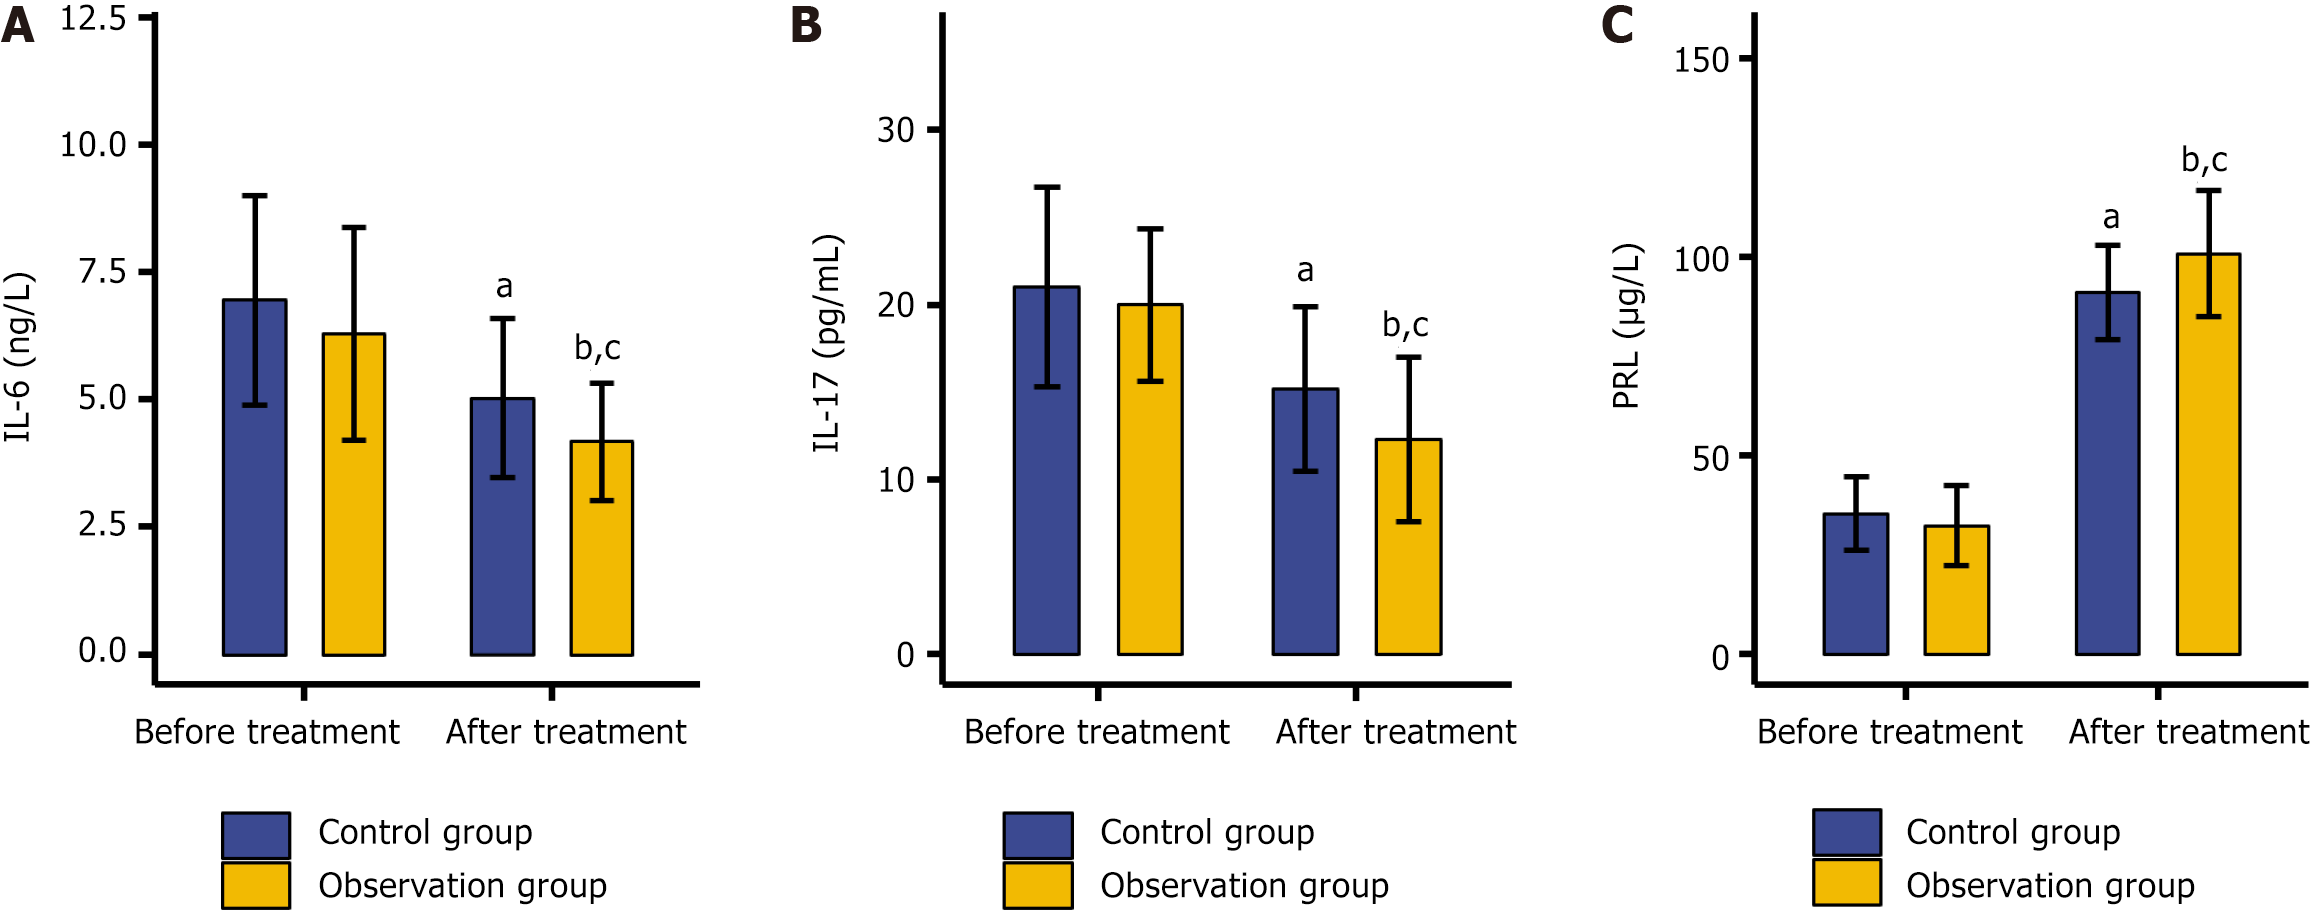
Figure 2 Serum markers of the two patient groups.
A: Pre-treatment and post-treatment interleukin 6 (IL-6) levels; B: Pre-treatment and post-treatment IL-17 Levels; C: Pre-treatment and post-treatment prolactin levels. PRL: Prolactin. aP < 0.05 and bP < 0.01 vs the pre-treatment levels; cP < 0.05 vs control.
- Citation: Zhao JJ, Han CY, Xu GX, Zhou M, Jin ZM. Effect of lurasidone plus sulpiride on treatment efficacy, psychiatric manifestations, and quality of life among patients with schizophrenia. World J Psychiatry 2025; 15(10): 105932
- URL: https://www.wjgnet.com/2220-3206/full/v15/i10/105932.htm
- DOI: https://dx.doi.org/10.5498/wjp.v15.i10.105932


