©The Author(s) 2025.
World J Clin Oncol. Nov 24, 2025; 16(11): 111627
Published online Nov 24, 2025. doi: 10.5306/wjco.v16.i11.111627
Published online Nov 24, 2025. doi: 10.5306/wjco.v16.i11.111627
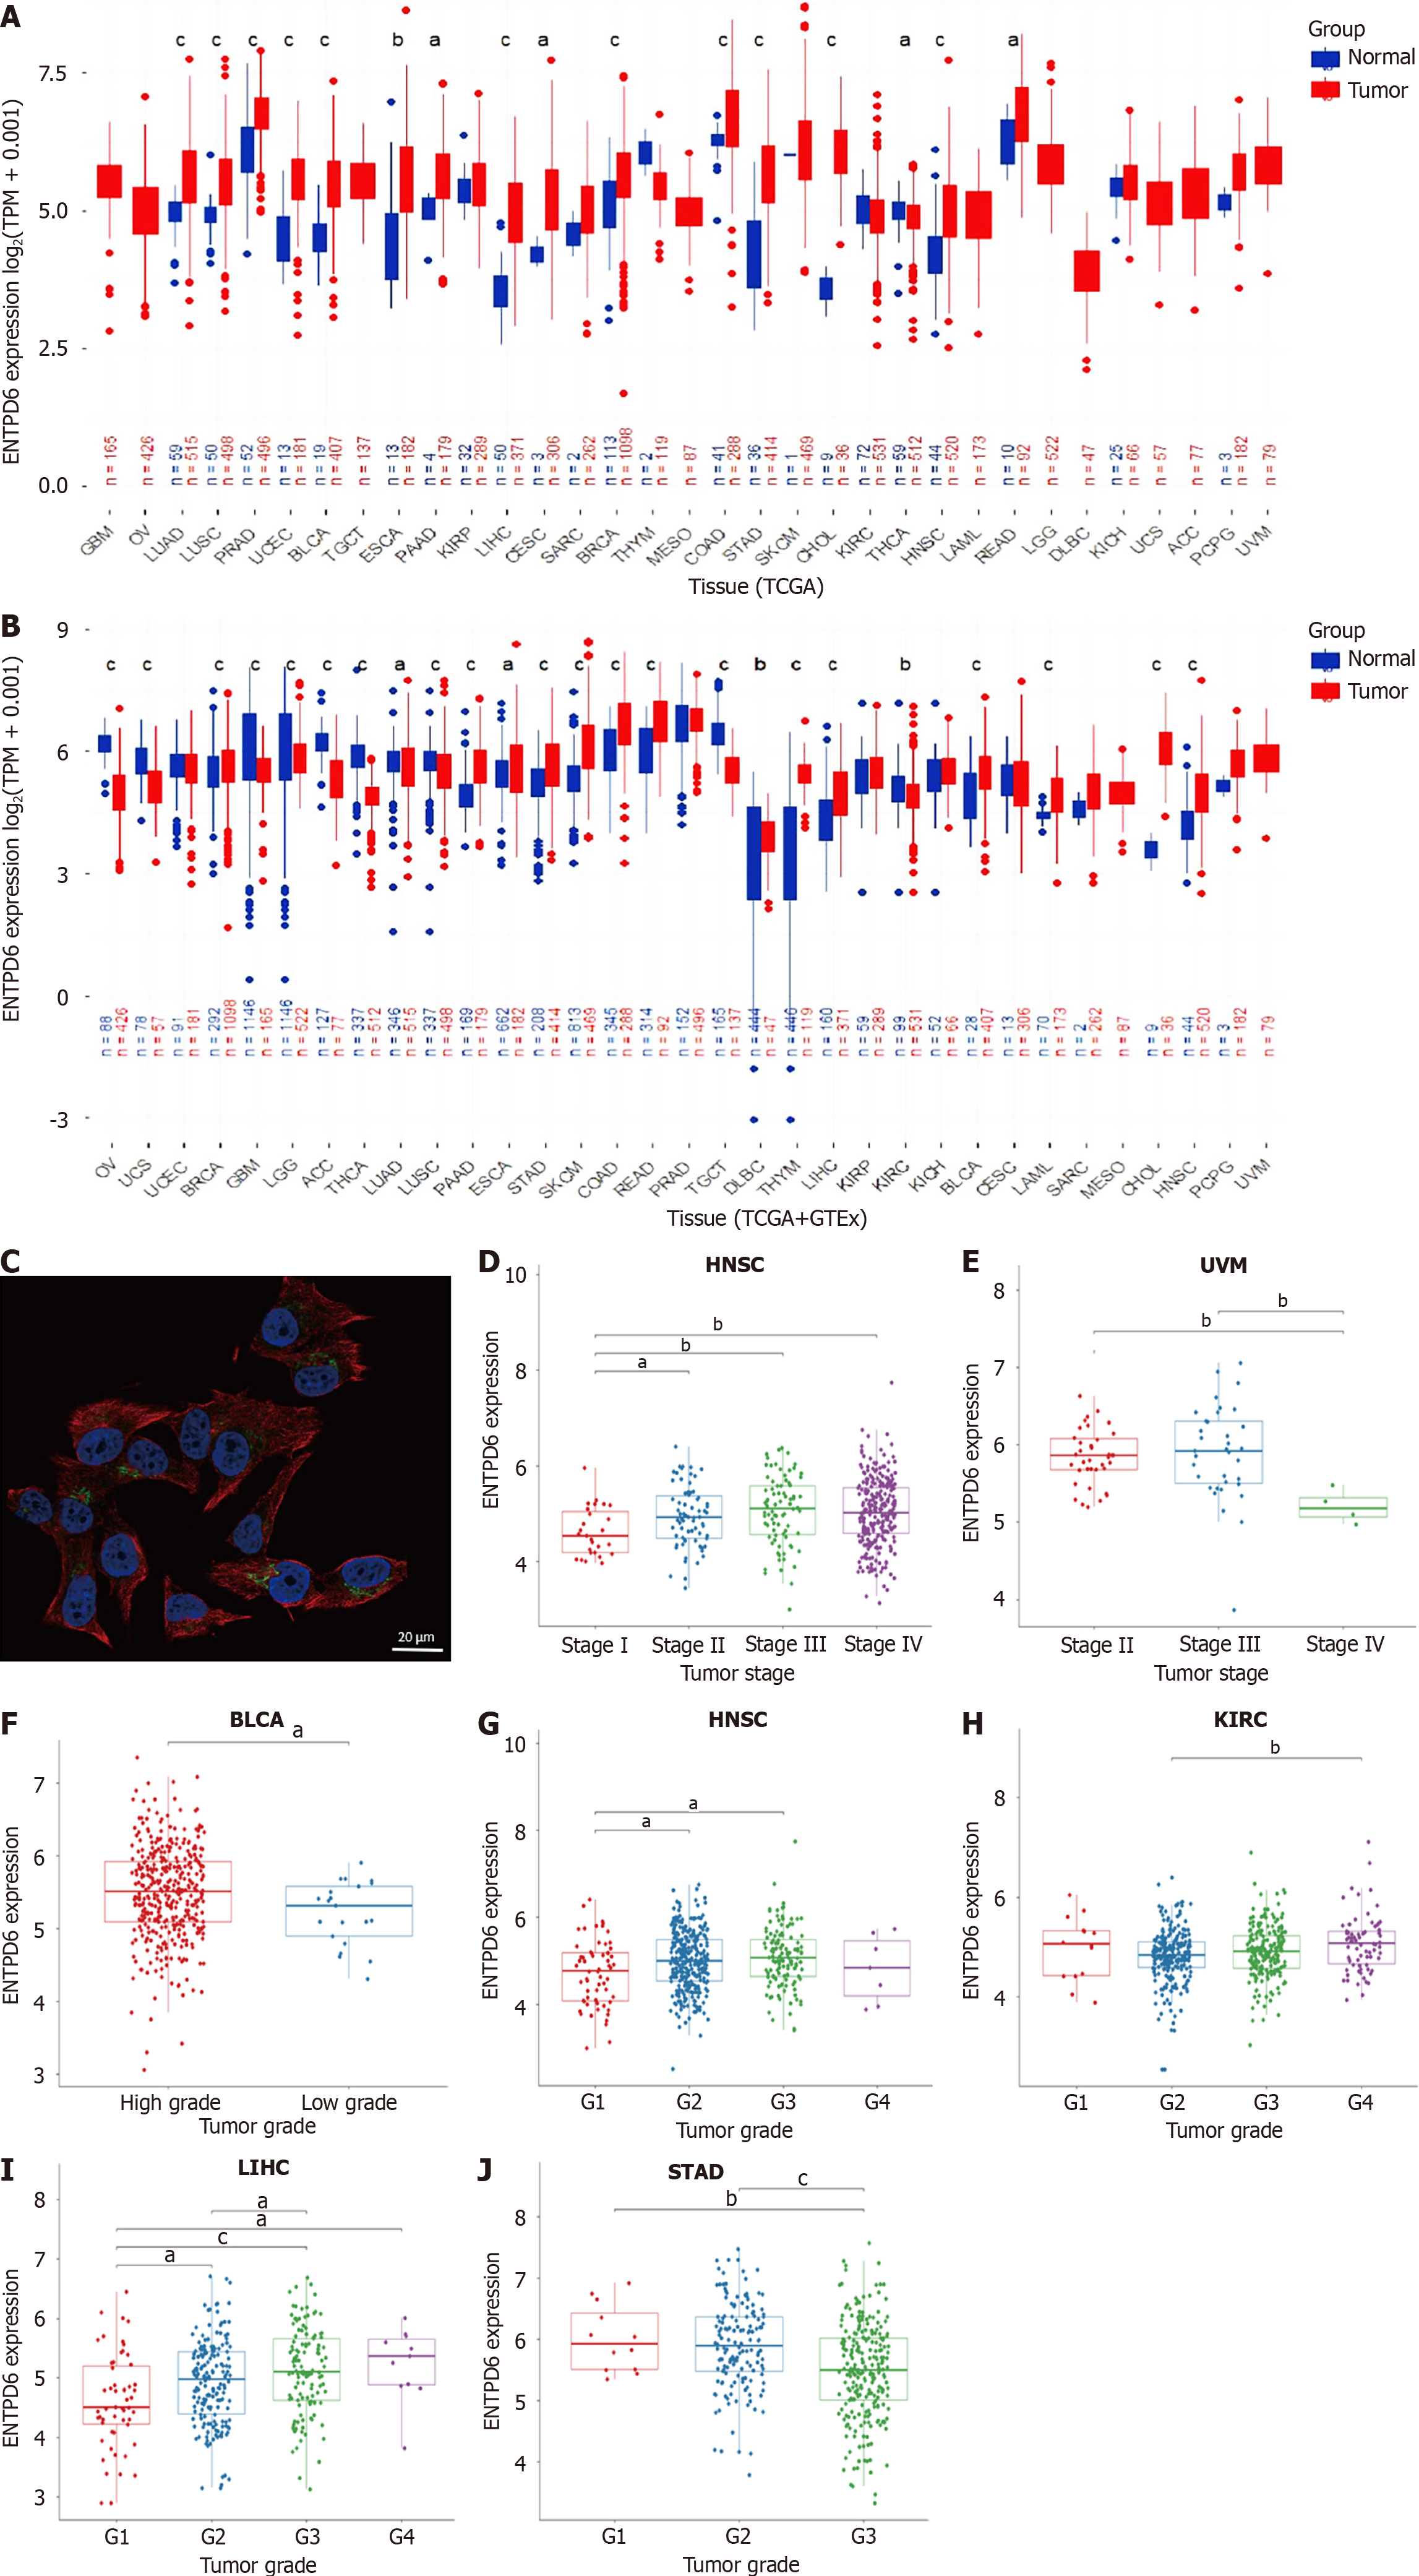
Figure 1 Ectonucleoside triphosphate diphosphohydrolase 6 expressions in pan-cancer.
A: Ectonucleoside triphosphate diphosphohydrolase 6 (ENTPD6) expression levels both in the tumor and normal tissues from The Cancer Genome Atlas dataset; B: ENTPD6 expression levels in the paired tumor/normal samples of the datasets from The Cancer Genome Atlas and Genotype-Tissue Expression databases; C: Subcellular localization of ENTPD6 in SK-MEL-30 cell line from The Human Protein Atlas database, scale bar: 20 μm. Red, green, and blue represent microtubules, the target protein, and the nucleus, respectively; D and E: The association between ENTPD6 expression and pathological stages in head and neck squamous cell carcinoma and uveal melanoma; F-J: ENTPD6 expression correlated with tumor grades in bladder urothelial carcinoma, head and neck squamous cell carcinoma, kidney renal clear cell carcinoma, liver hepatocellular carcinoma, and stomach adenocarcinoma. aP < 0.05; bP < 0.01; cP < 0.001. ENTPD6: Ectonucleoside triphosphate diphosphohydrolase 6; TPM: Transcripts per million; TCGA: The Cancer Genome Atlas; GTEx: Genotype-Tissue Expression; HNSC: Head and neck squamous cell carcinoma; UVM: Uveal melanoma; BLCA: Bladder urothelial carcinoma; KIRC: Kidney renal clear cell carcinoma; LIHC: Liver hepatocellular carcinoma; STAD: Stomach adenocarcinoma.
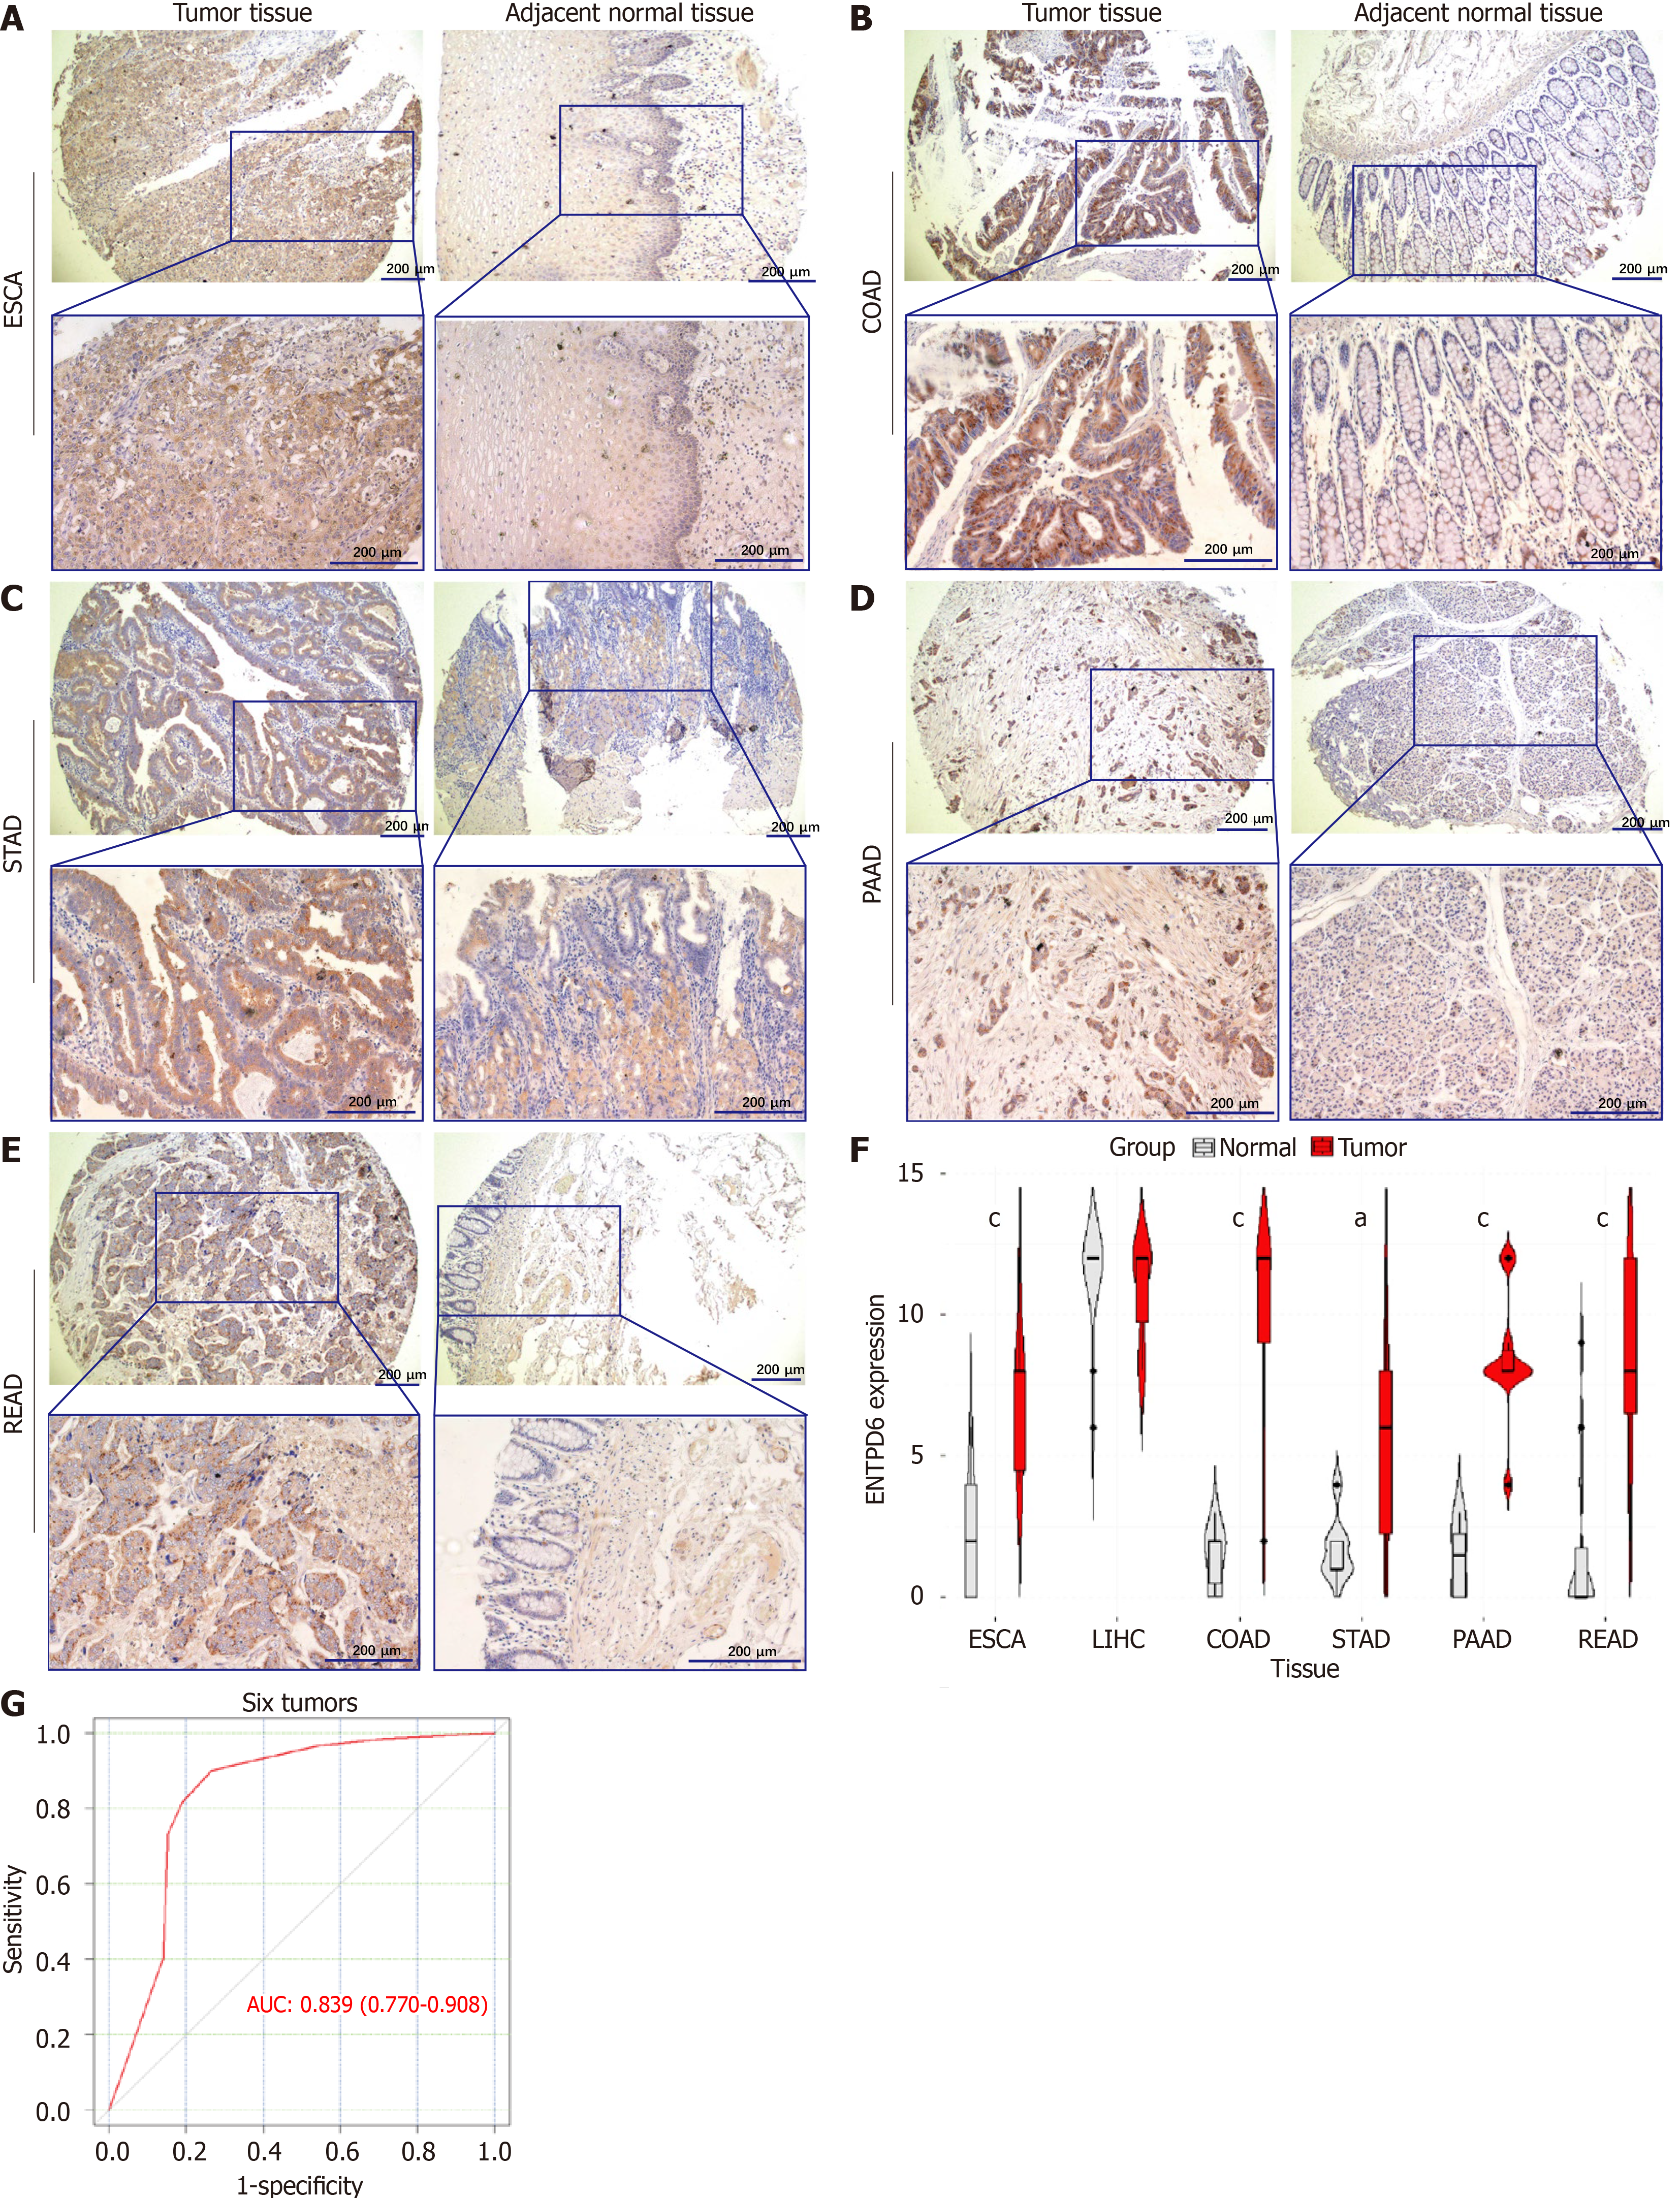
Figure 2 Ectonucleoside triphosphate diphosphohydrolase 6 expressions in gastrointestinal tumors.
A-E: Immunohistochemistry staining results of ectonucleoside triphosphate diphosphohydrolase 6 (ENTPD6) expression in gastrointestinal tumors and adjacent normal tissues, including esophageal carcinoma, colon adenocarcinoma, stomach adenocarcinoma, pancreatic adenocarcinoma, rectal adenocarcinoma, scale bar: 200 μm; F: Differential expression plot of ENTPD6; G: The receiver operating characteristic curve and area under the curve value of ENTPD6 in six tumors. aP < 0.05; cP < 0.001. ESCA: Esophageal carcinoma; COAD: Colon adenocarcinoma; STAD: Stomach adenocarcinoma; PAAD: Pancreatic adenocarcinoma; READ: Rectal adenocarcinoma; ENTPD6: Ectonucleoside triphosphate diphosphohydrolase 6; AUC: Area under the curve.
Figure 3 Prognosis and diagnostic value analysis of ectonucleoside triphosphate diphosphohydrolase 6 in various cancers.
A-D: The univariate Cox regression analysis of overall survival, disease-specific survival, disease-free interval, and progression-free interval; E-I: The results of Kaplan-Meier curves analysis of overall survival in liver hepatocellular carcinoma, kidney renal clear cell carcinoma, kidney renal papillary cell carcinoma, thymoma, and rectal adenocarcinoma; J-N: The results of the Kaplan-Meier curves analysis of progression-free interval in cervical squamous cell carcinoma and endocervical adenocarcinoma, diffuse large B-cell lymphoma, head and neck squamous cell carcinoma, lung squamous cell carcinoma, and stomach adenocarcinoma; O-Q: The results of the Kaplan-Meier curves analysis of disease-specific survival in lung squamous cell carcinoma, kidney renal papillary cell carcinoma, and kidney renal clear cell carcinoma. ENTPD6: Ectonucleoside triphosphate diphosphohydrolase 6; OS: Overall survival; DSS: Disease-specific survival; DFI: Disease-free interval; PFI: Progression-free interval; LIHC: Liver hepatocellular carcinoma; KIRC: Kidney renal clear cell carcinoma; KIRP: Kidney renal papillary cell carcinoma; THYM: Thymoma; READ: Rectal adenocarcinoma; CESC: Cervical squamous cell carcinoma and endocervical adenocarcinoma; DLBC: Diffuse large B-cell lymphoma; HNSC: Head and neck squamous cell carcinoma; LUSC: Lung squamous cell carcinoma; STAD: Stomach adenocarcinoma.
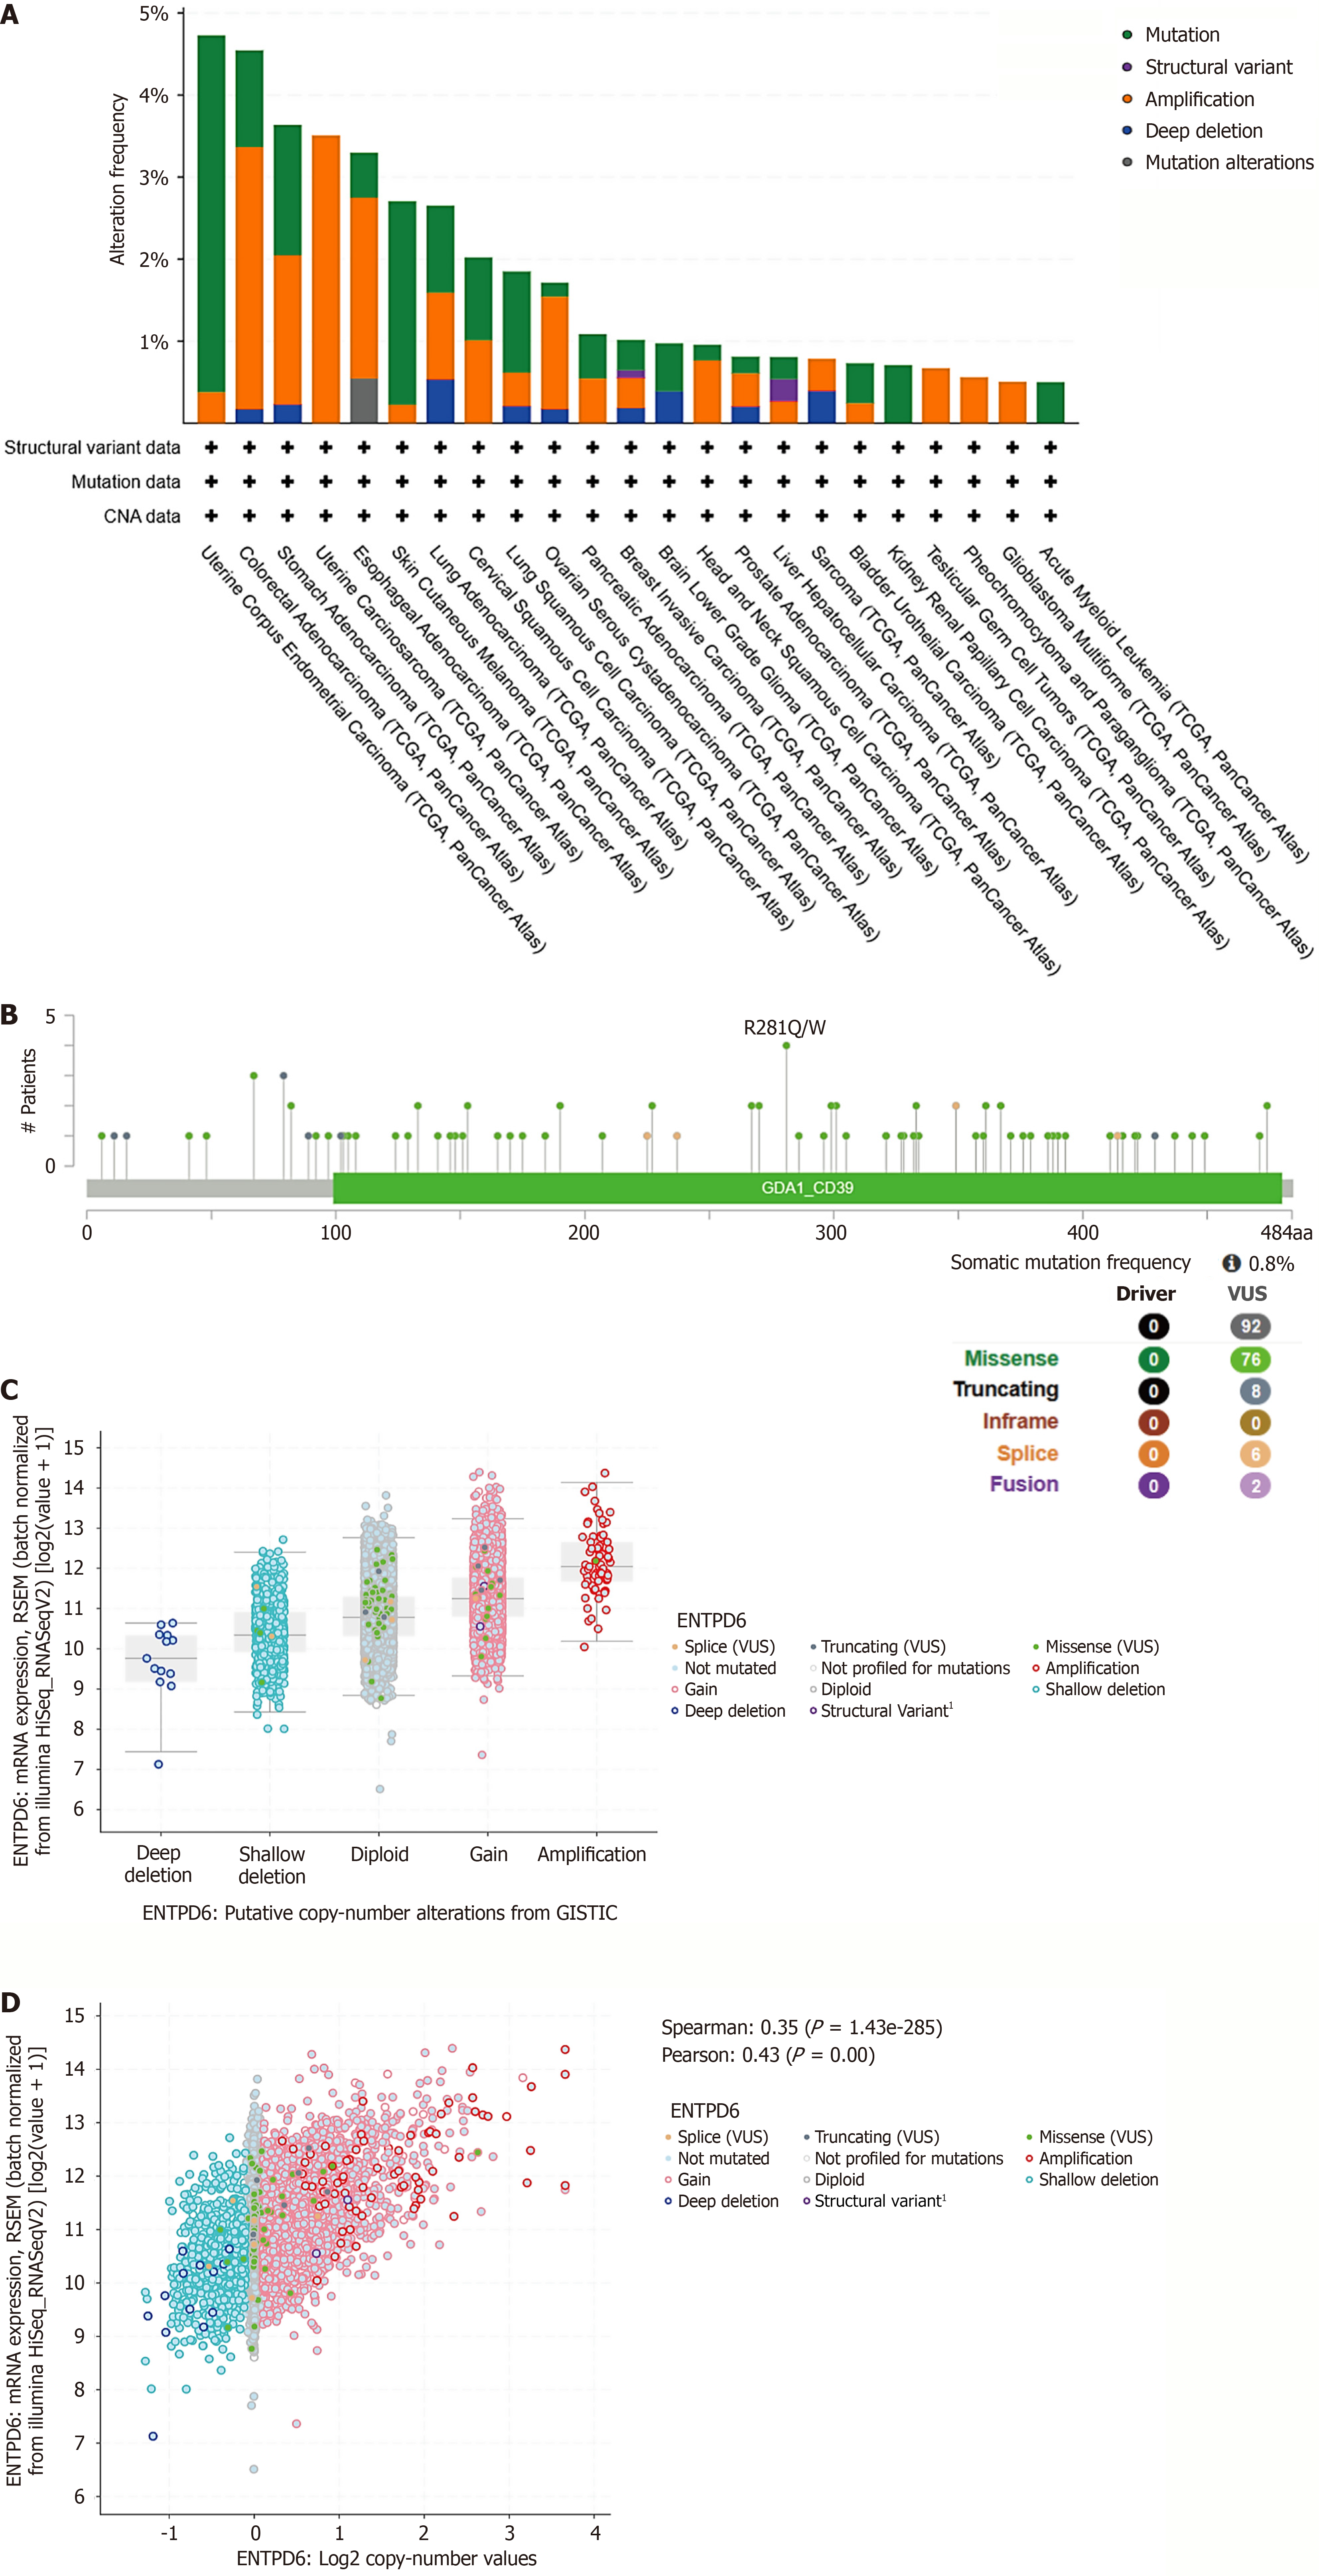
Figure 4 The correlation between ectonucleoside triphosphate diphosphohydrolase 6 expression and genetic alterations, as well as genomic instability.
A: Pan-cancer analyses of genomic changes in ectonucleoside triphosphate diphosphohydrolase 6 (ENTPD6) expression were conducted, including analyses of mutations, amplifications, and deep deletions; B: Genetic alterations of ENTPD6, including missense, frameshift deletion, and splice site mutations; C: ENTPD6 expression in different copy number alteration categories; D: The correlation between copy number alteration and ENTPD6 expression. CAN: Copy number alteration; VUS: Variant of uncertain significance; ENTPD6: Ectonucleoside triphosphate diphosphohydrolase 6; RSEM: RNA-Seq by Expectation Maximization; GSTIC: Genomic Identification of Significant Targets in Cancer.
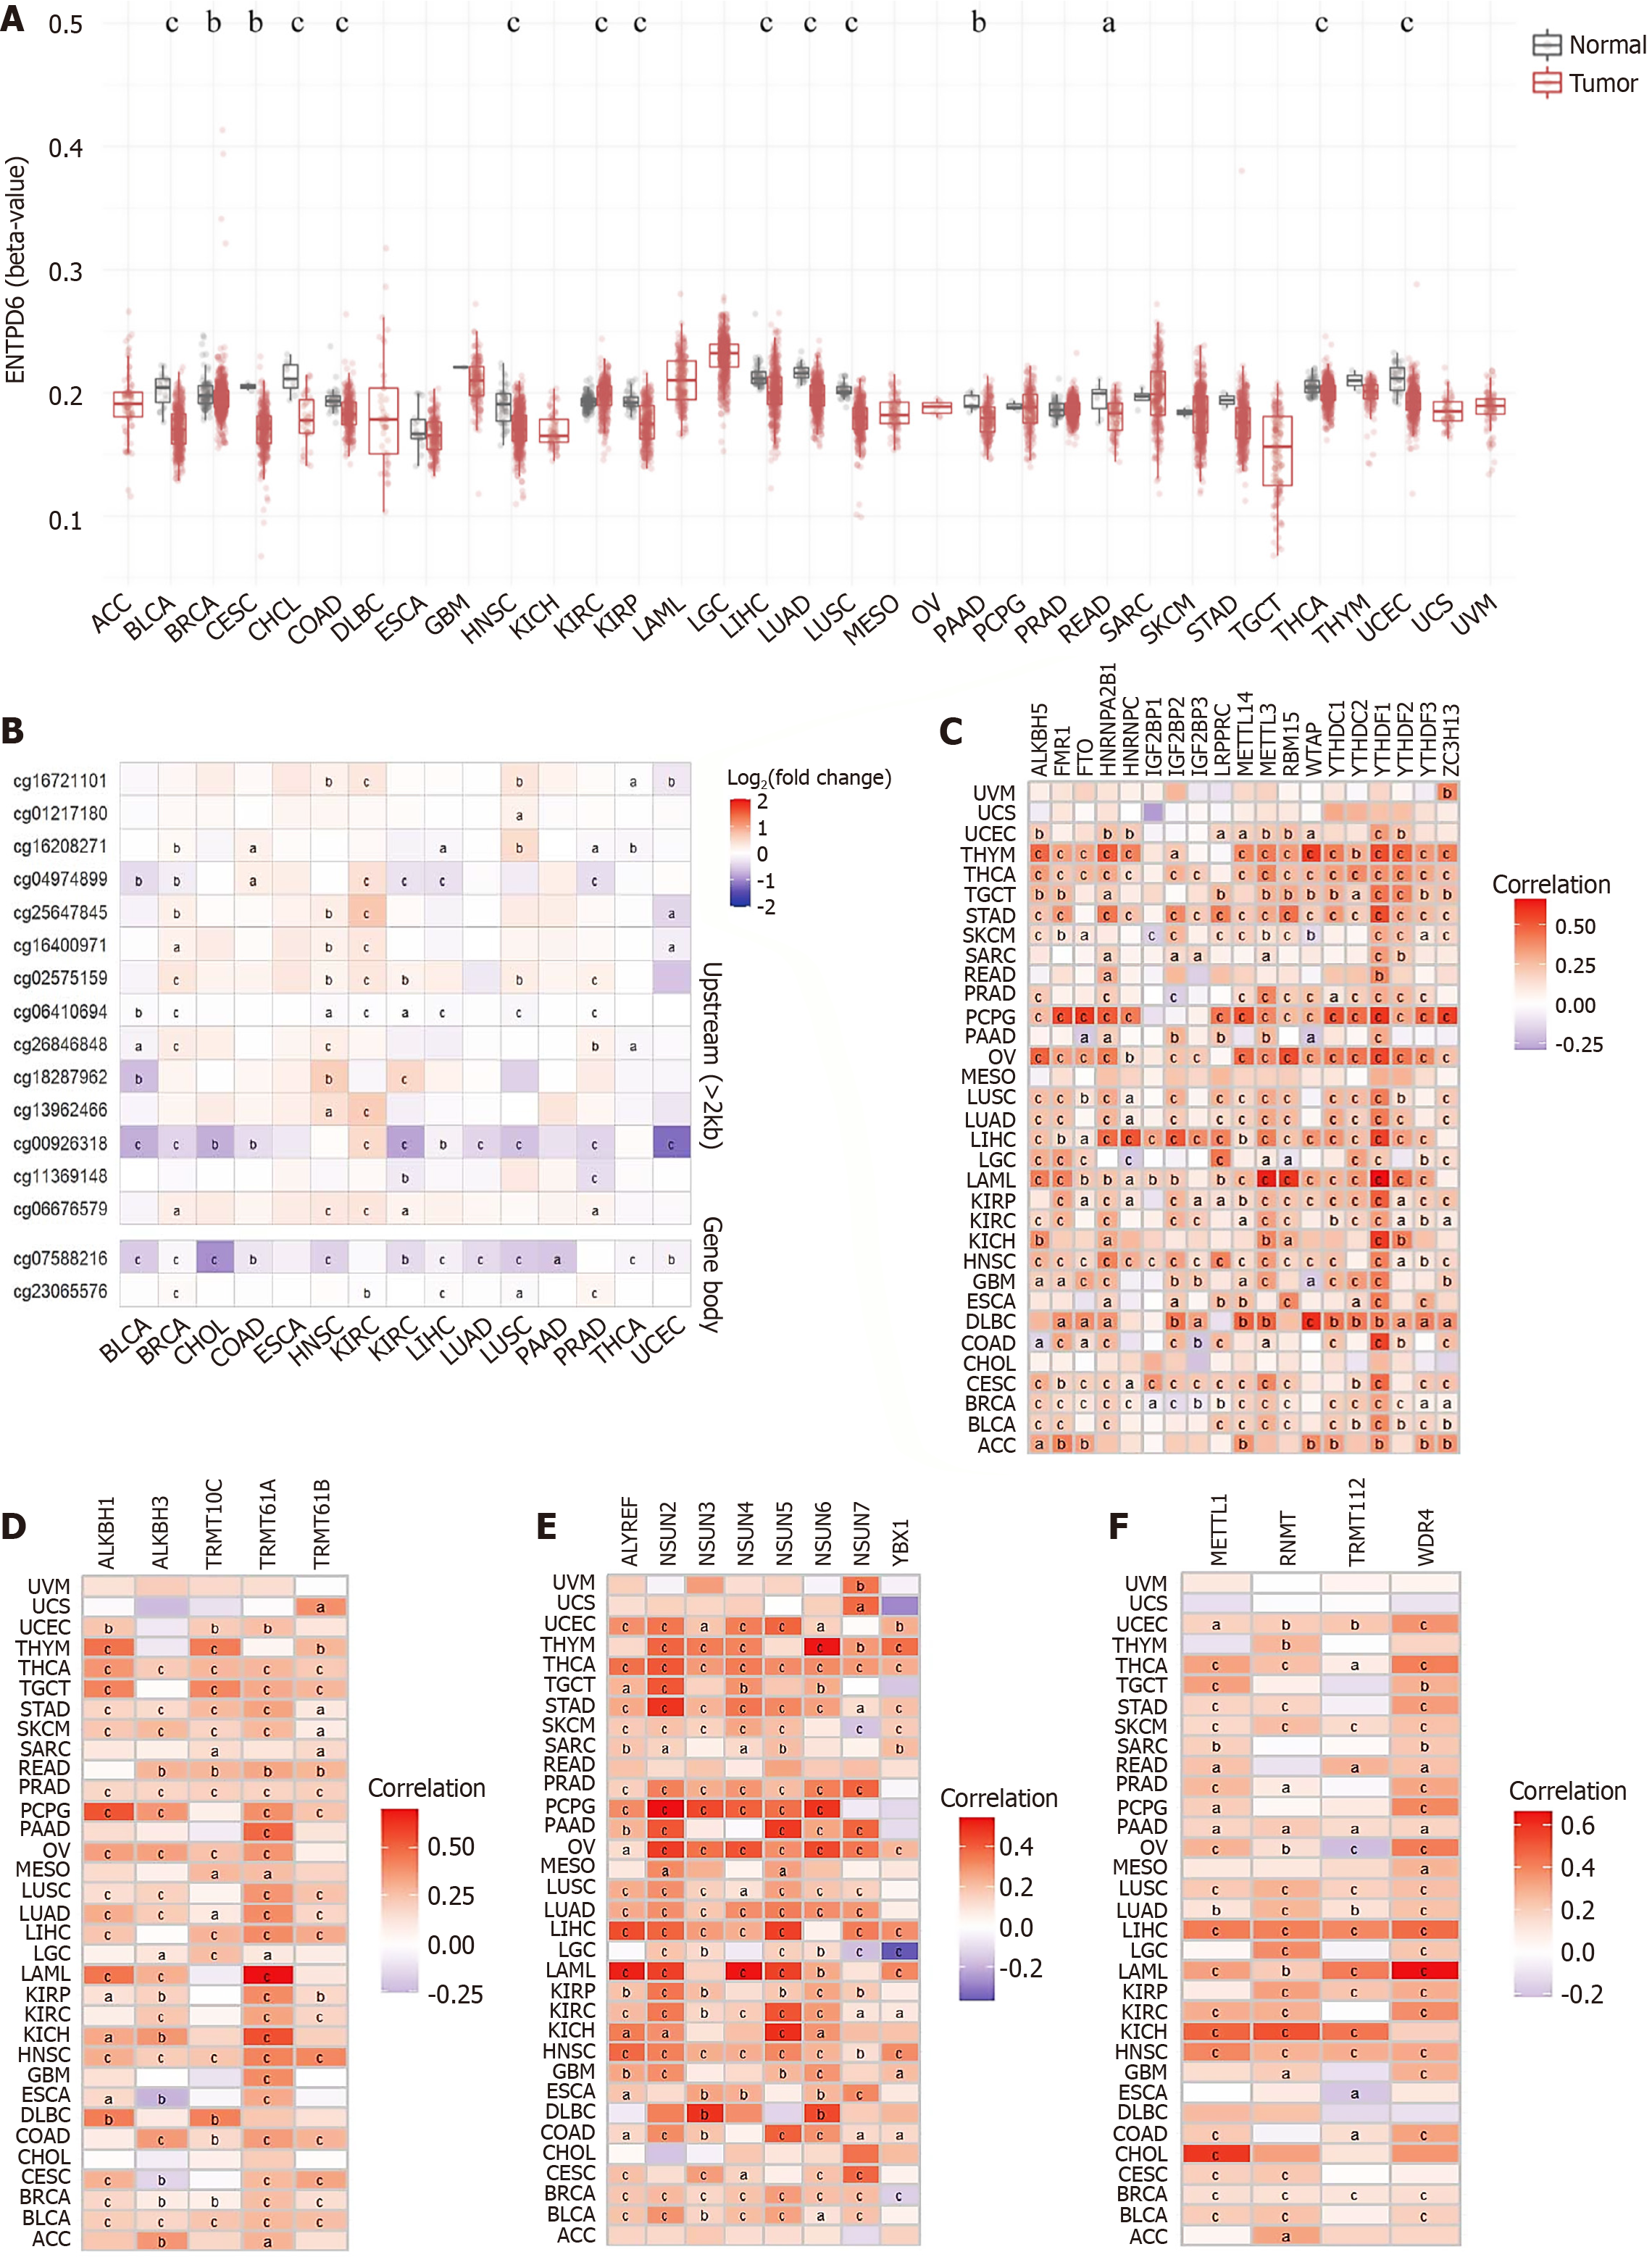
Figure 5 Epigenetic modification analyses.
A: The DNA methylation levels of ectonucleoside triphosphate diphosphohydrolase 6 (ENTPD6) were obtained from the Shiny Methylation Analysis Resource Tool database; B: Differential methylation of DNA methylation probes in upstream (> 2 kb) and gene body regions of ENTPD6; C-F: Correlation analysis between ENTPD6 expression and the genes related to m6A, m1A, m5C, and m7G modifications. aP < 0.05; bP < 0.01; cP < 0.001. ENTPD6: Ectonucleoside triphosphate diphosphohydrolase 6.
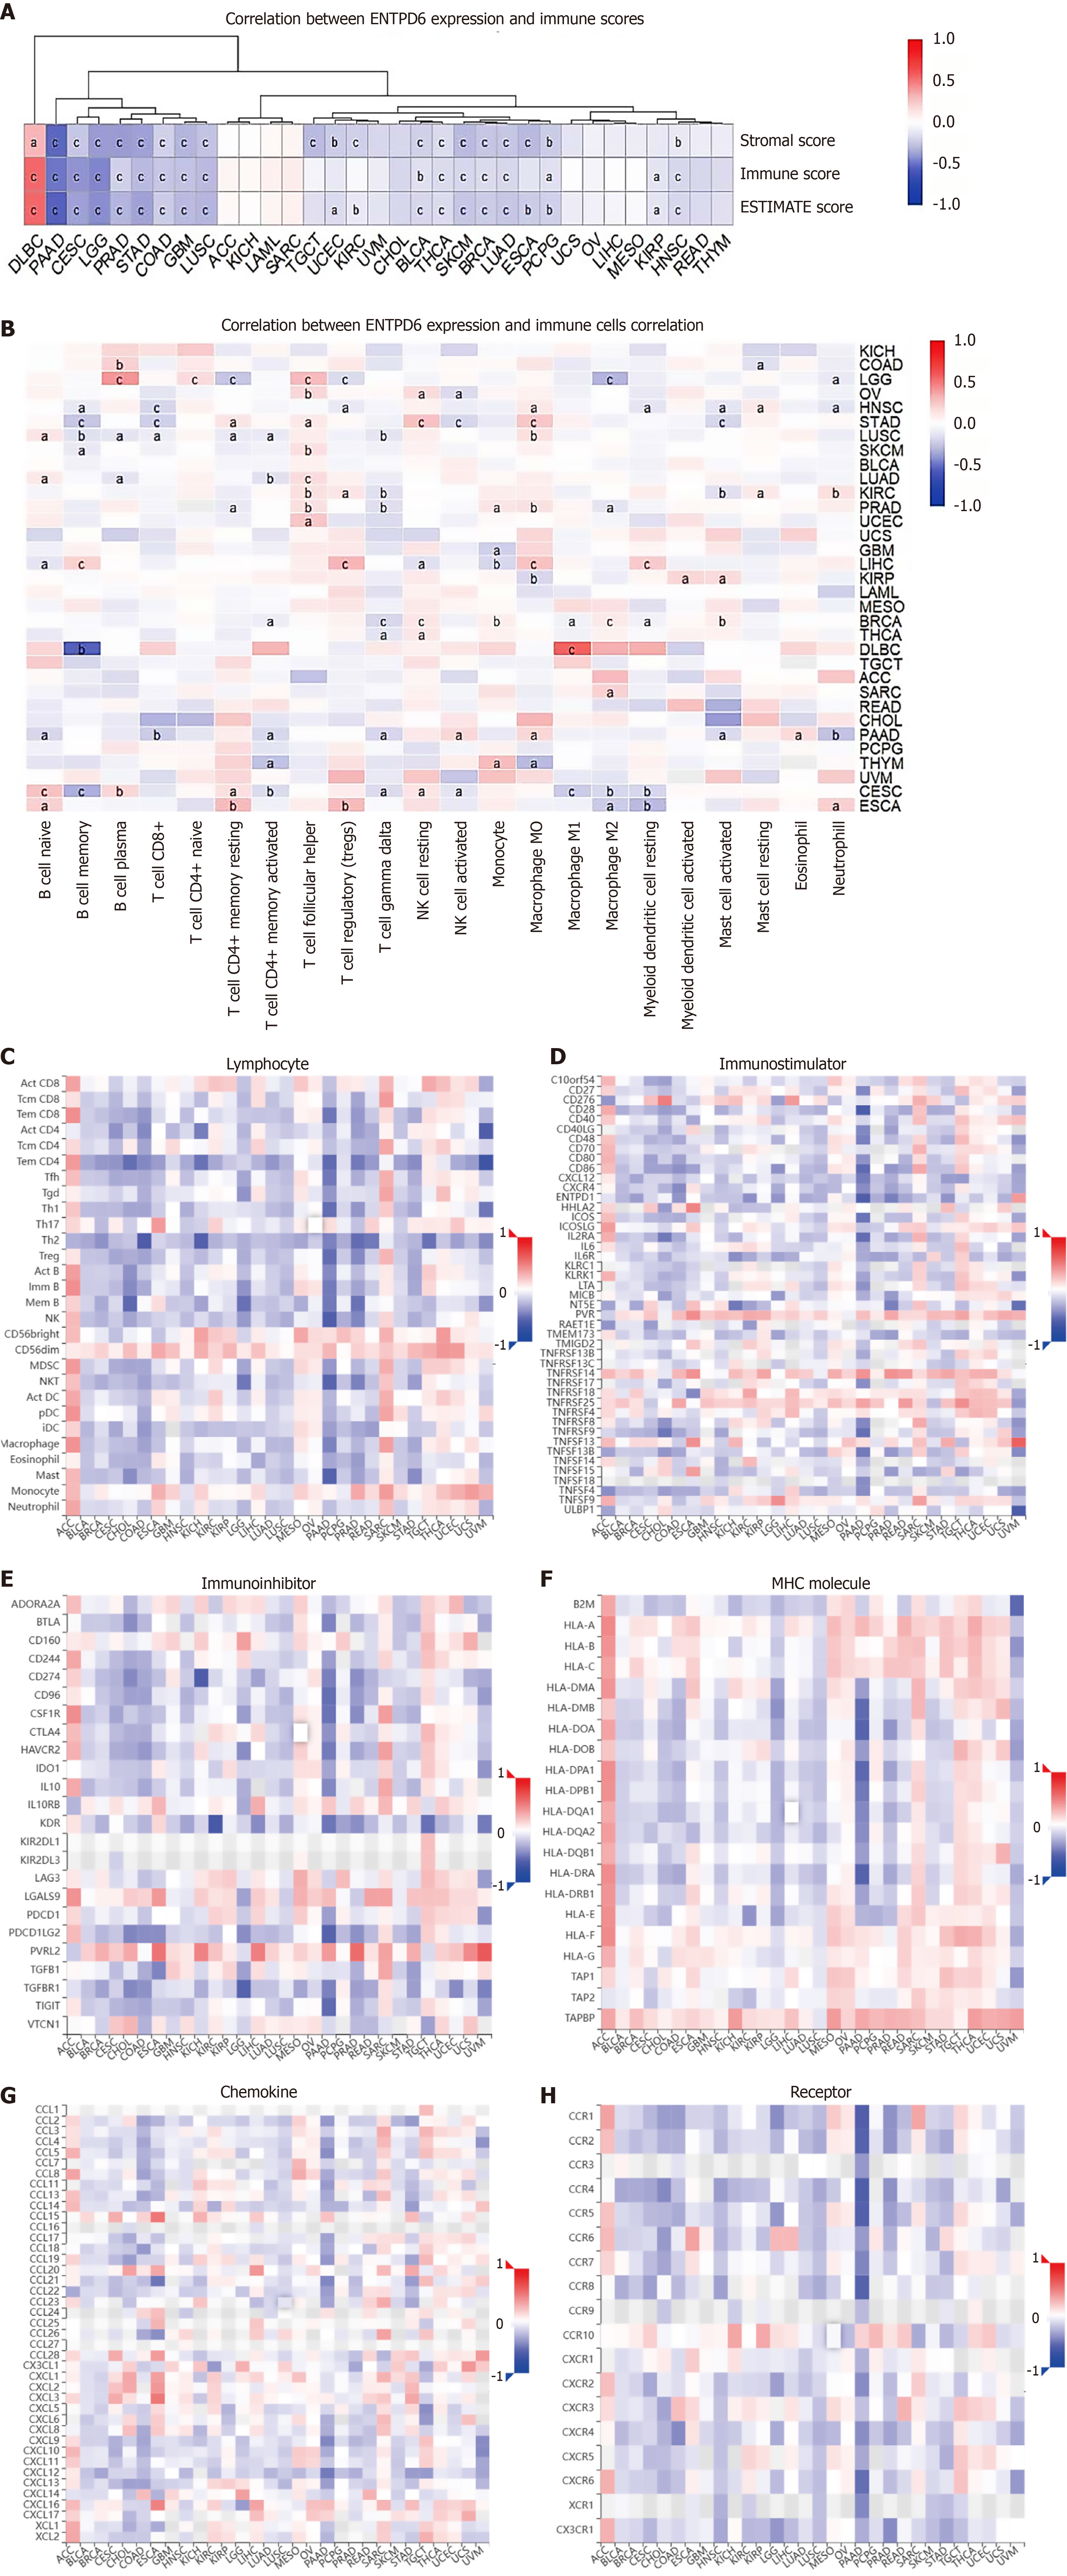
Figure 6 The correlation between ectonucleoside triphosphate diphosphohydrolase 6 expression and tumor microenvironment.
A: The relationship between ectonucleoside triphosphate diphosphohydrolase 6 (ENTPD6) expression levels and Estimation of STromal and Immune cells in MAlignant Tumor tissues using Expression data scores, immune scores, and stromal scores; B: The correlation between ENTPD6 expression and immune cells; C-H: The relationships between ENTPD6 expression and immune-related genes in the tumor-immune system interaction database, including lymphocyte, immunostimulator, immunoinhibitor, major histocompatibility complex molecule, chemokine, and receptor. aP < 0.05; bP < 0.01; cP < 0.001. ENTPD6: Ectonucleoside triphosphate diphosphohydrolase 6; MHC: Major histocompatibility complex molecule.
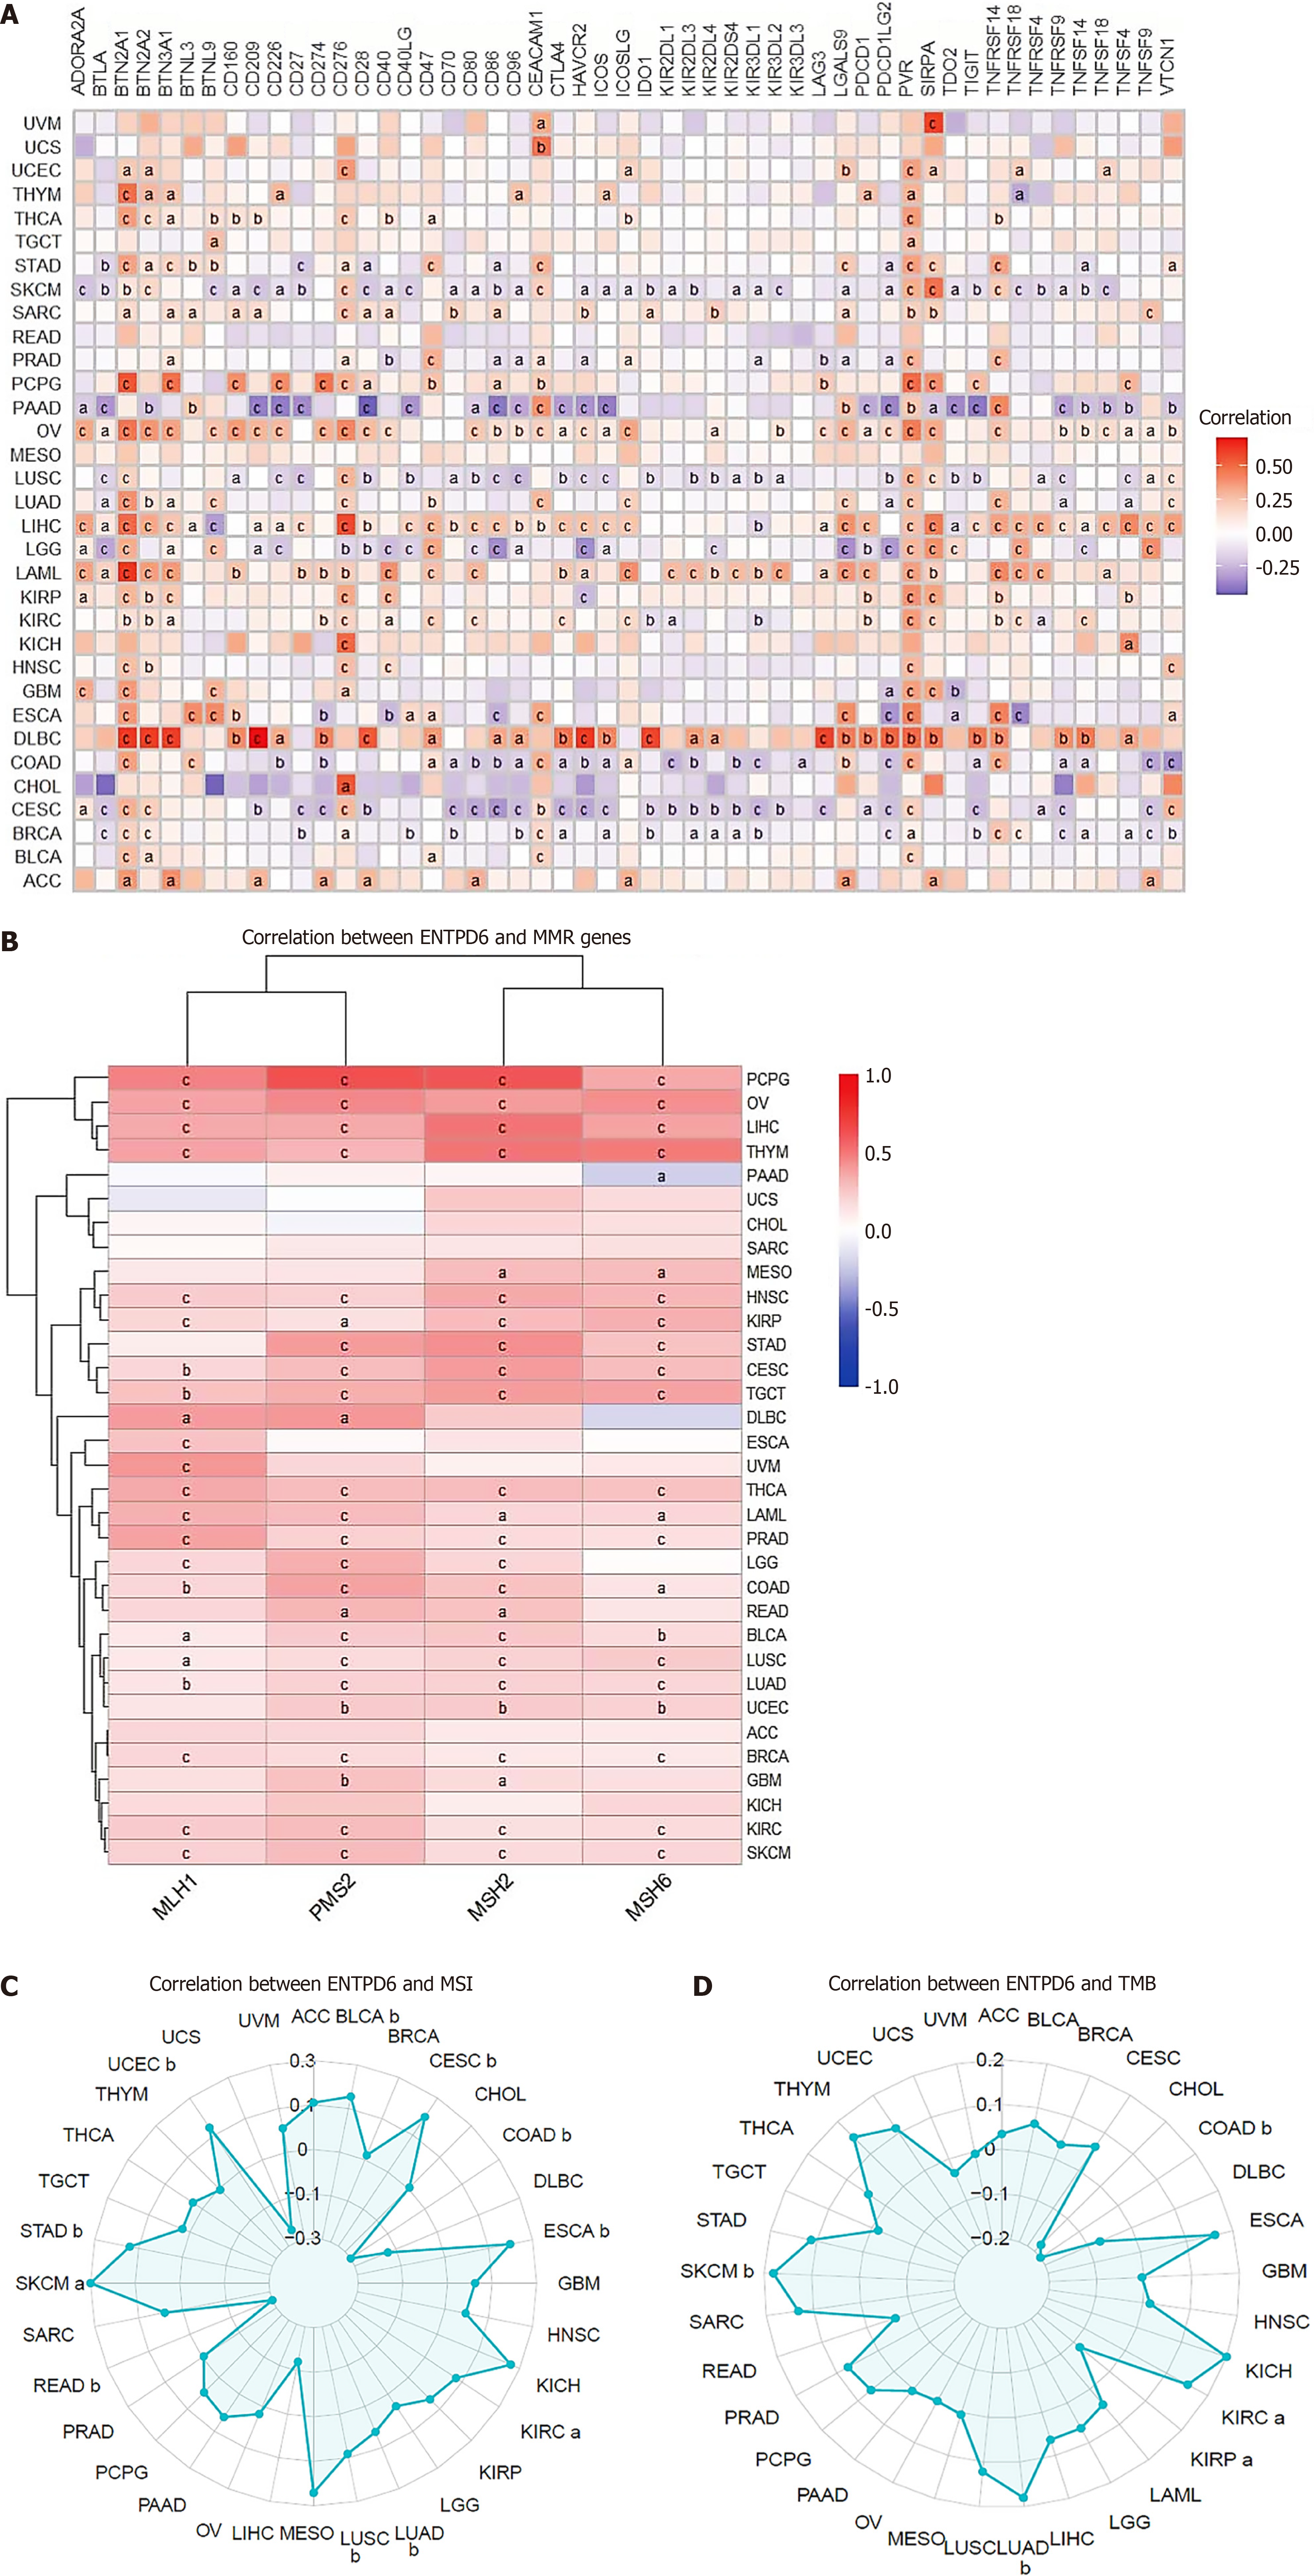
Figure 7 Correlation between ectonucleoside triphosphate diphosphohydrolase 6 expression and immunotherapy.
A: The association between ectonucleoside triphosphate diphosphohydrolase 6 expression and 51 immune checkpoint genes; B-D: Mismatch repair genes, microsatellite instability, as well as tumor mutational burden. aP < 0.05; bP < 0.01; cP < 0.001. ENTPD6: Ectonucleoside triphosphate diphosphohydrolase 6; MMR: Mismatch repair; MSI: Microsatellite instability; TMB: Tumor mutational burden.
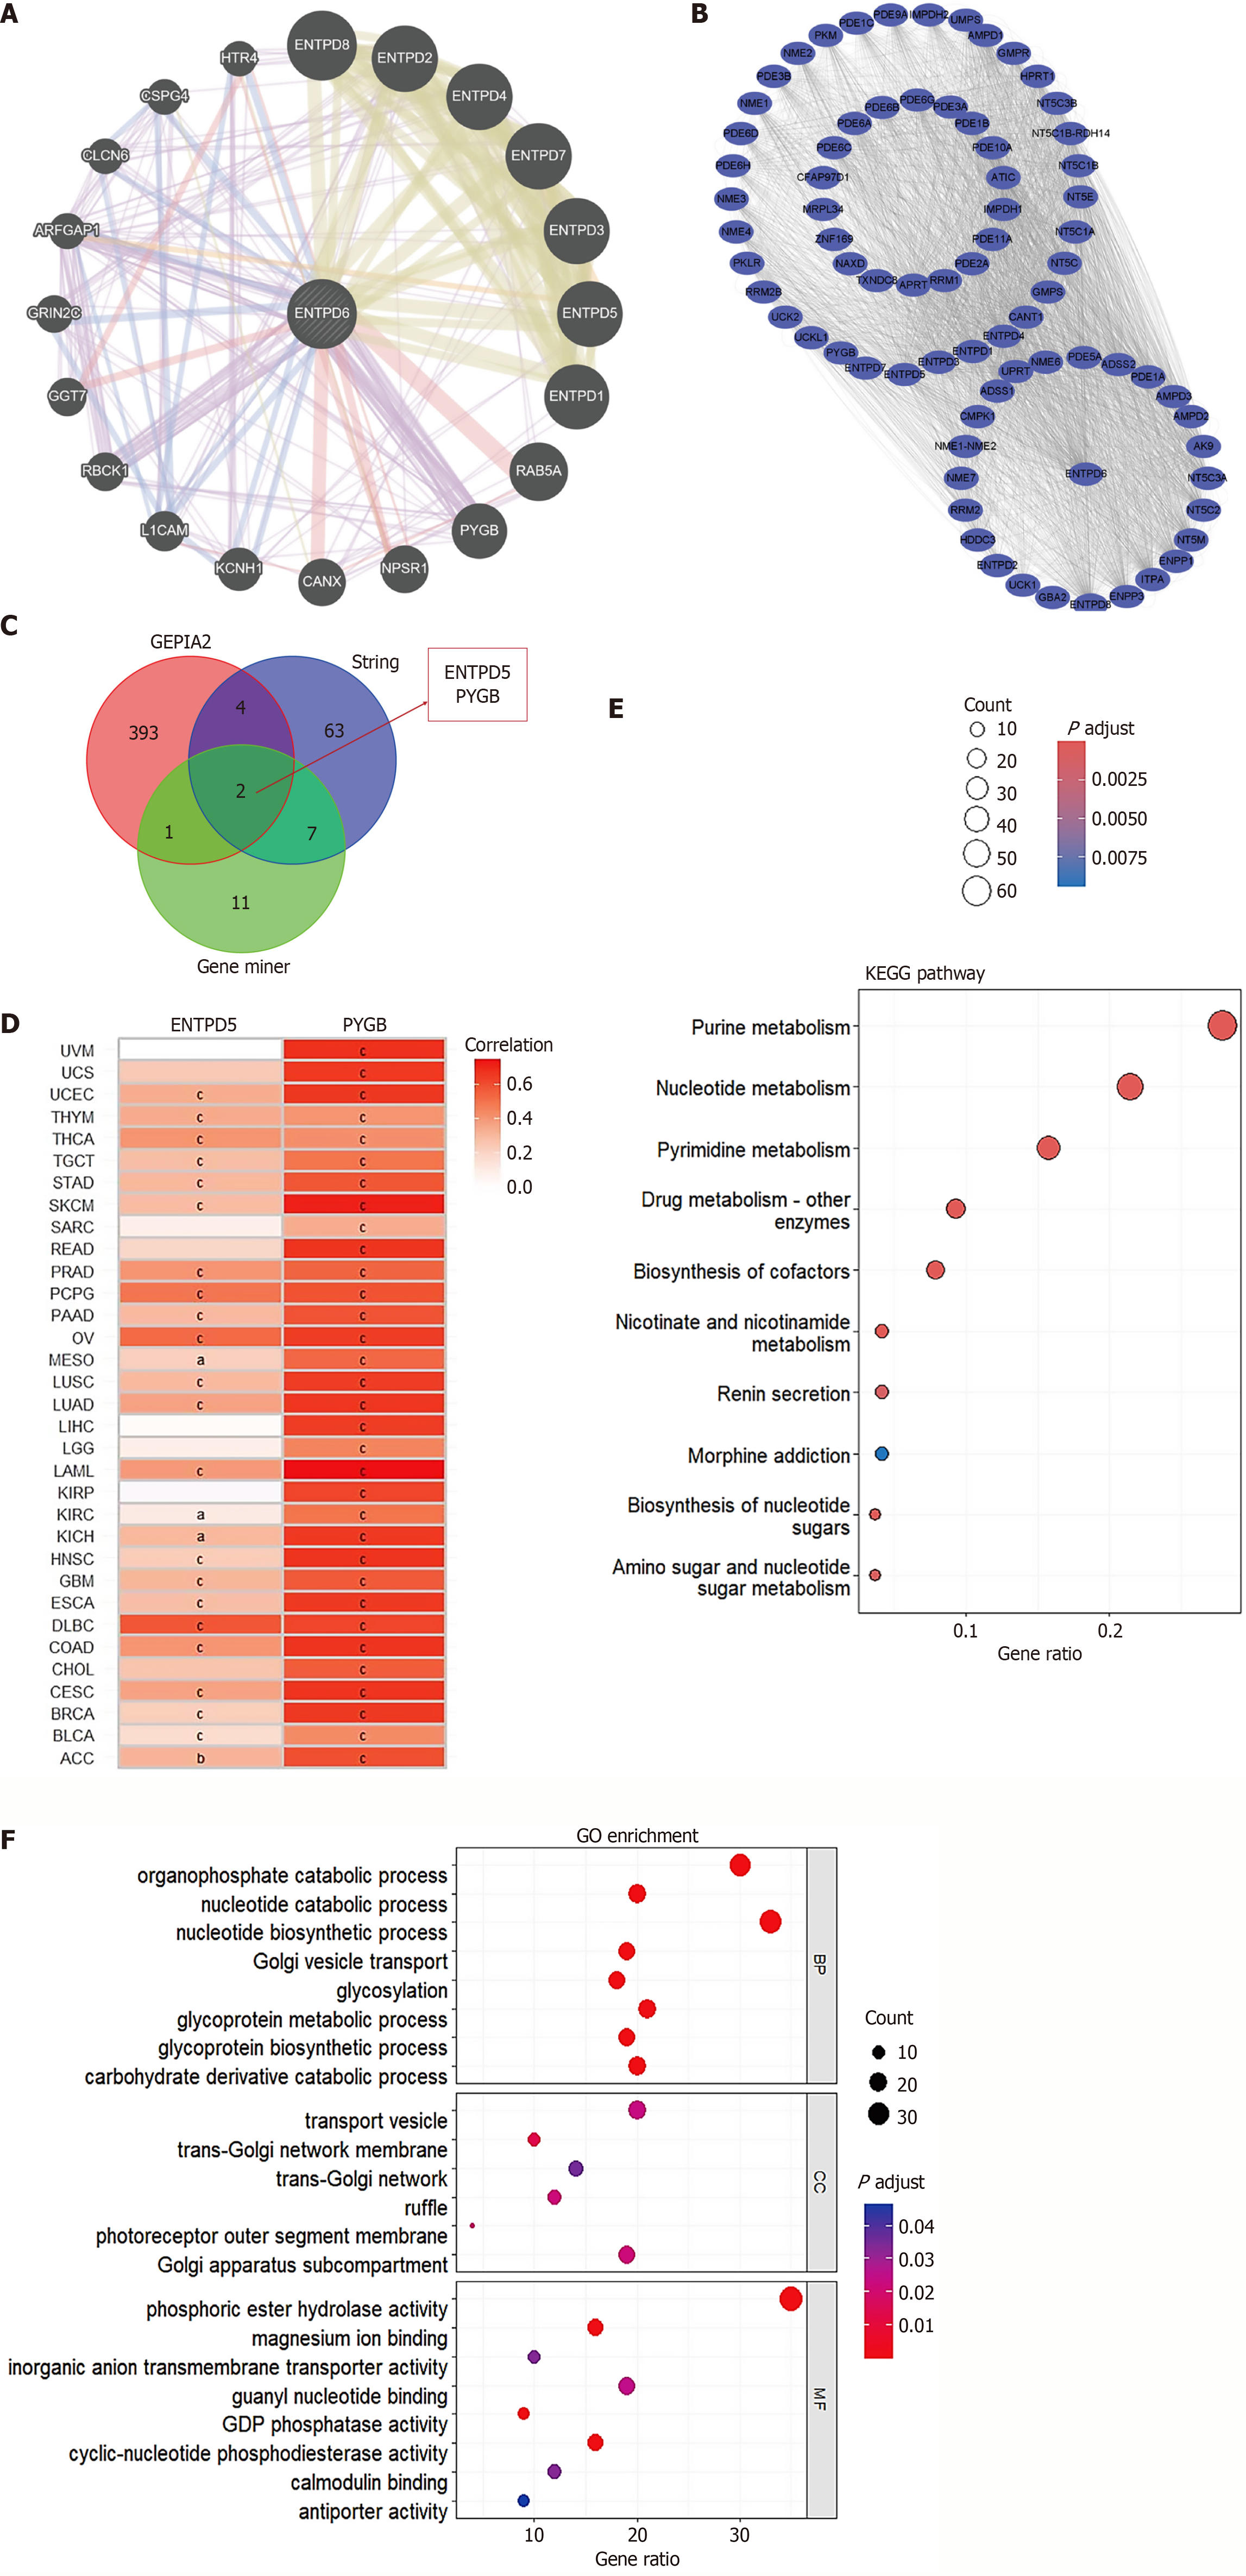
Figure 8 Functional enrichment analysis.
A: The ectonucleoside triphosphate diphosphohydrolase 6 (ENTPD6) interactome was generated with GeneMANIA; B: 76 putative ENTPD6-binding partners were retrieved from STRING; C: A Venn diagram highlights the genes shared by GeneMANIA, STRING, and Gene Expression Profiling Interactive Analysis; D: A pan-cancer heatmap illustrates the correlation between ENTPD6 and ENTPD5/glycogen phosphorylase B expression; E and F: Kyoto Encyclopedia of Genes and Genomes pathway and Gene Ontology enrichment analyses delineate the functional landscape of ENTPD6-associated genes. aP < 0.05; bP < 0.01; cP < 0.001. ENTPD5: Ectonucleoside triphosphate diphosphohydrolase 5; PYGB: Glycogen phosphorylase B; KEGG: Kyoto Encyclopedia of Genes; GO: Gene Ontology.
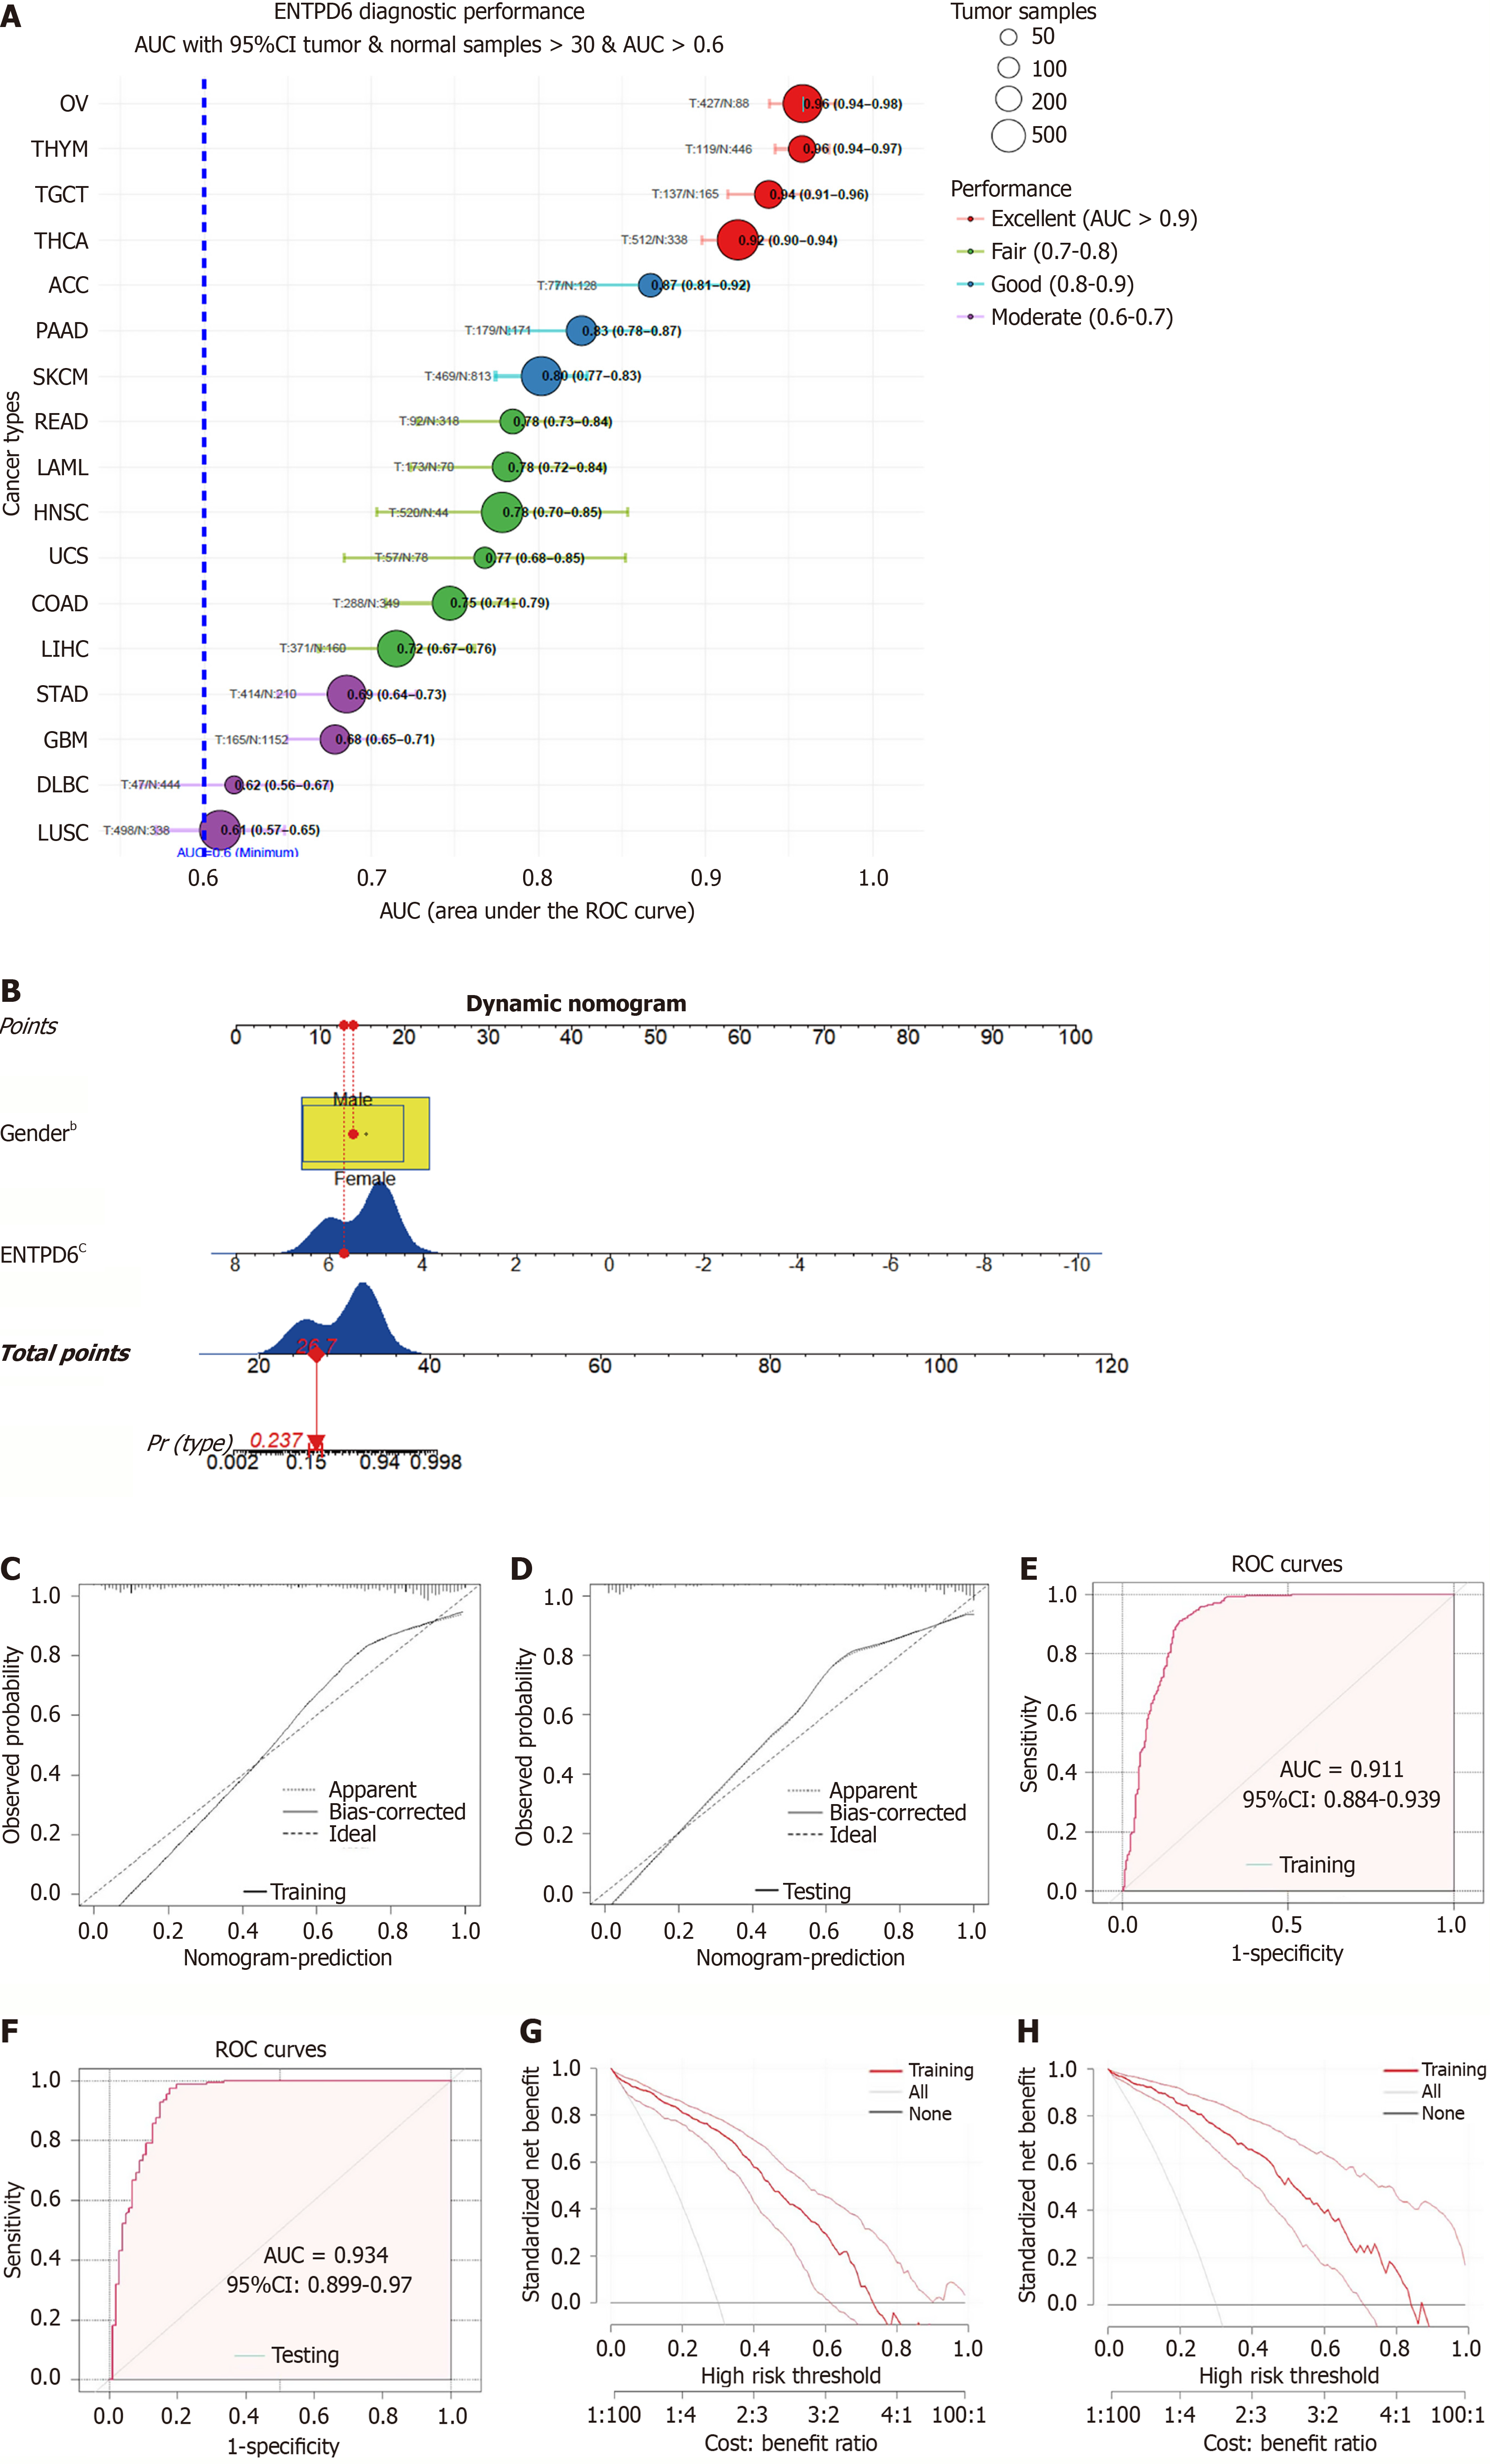
Figure 9 The development of a nomogram.
A: Receiver operating characteristic curve analysis revealed tumor types with area under the curve values > 0.6, based on the combined The Cancer Genome Atlas and Genotype-Tissue Expression databases; B: Risk factors of gender and ectonucleoside triphosphate diphosphohydrolase 6 expression were used to construct a nomogram in thyroid carcinoma; C and D: The calibration curves of the training and testing sets; E and F: The receiver operating characteristic analysis of the training and testing sets; G and H: The decision-curve analysis results of the training and testing sets. bP < 0.01, cP < 0.001. ENTPD6: Ectonucleoside triphosphate diphosphohydrolase 6; AUC: Area under the curve; CI: Confidence interval; ROC: Receiver operating characteristic.
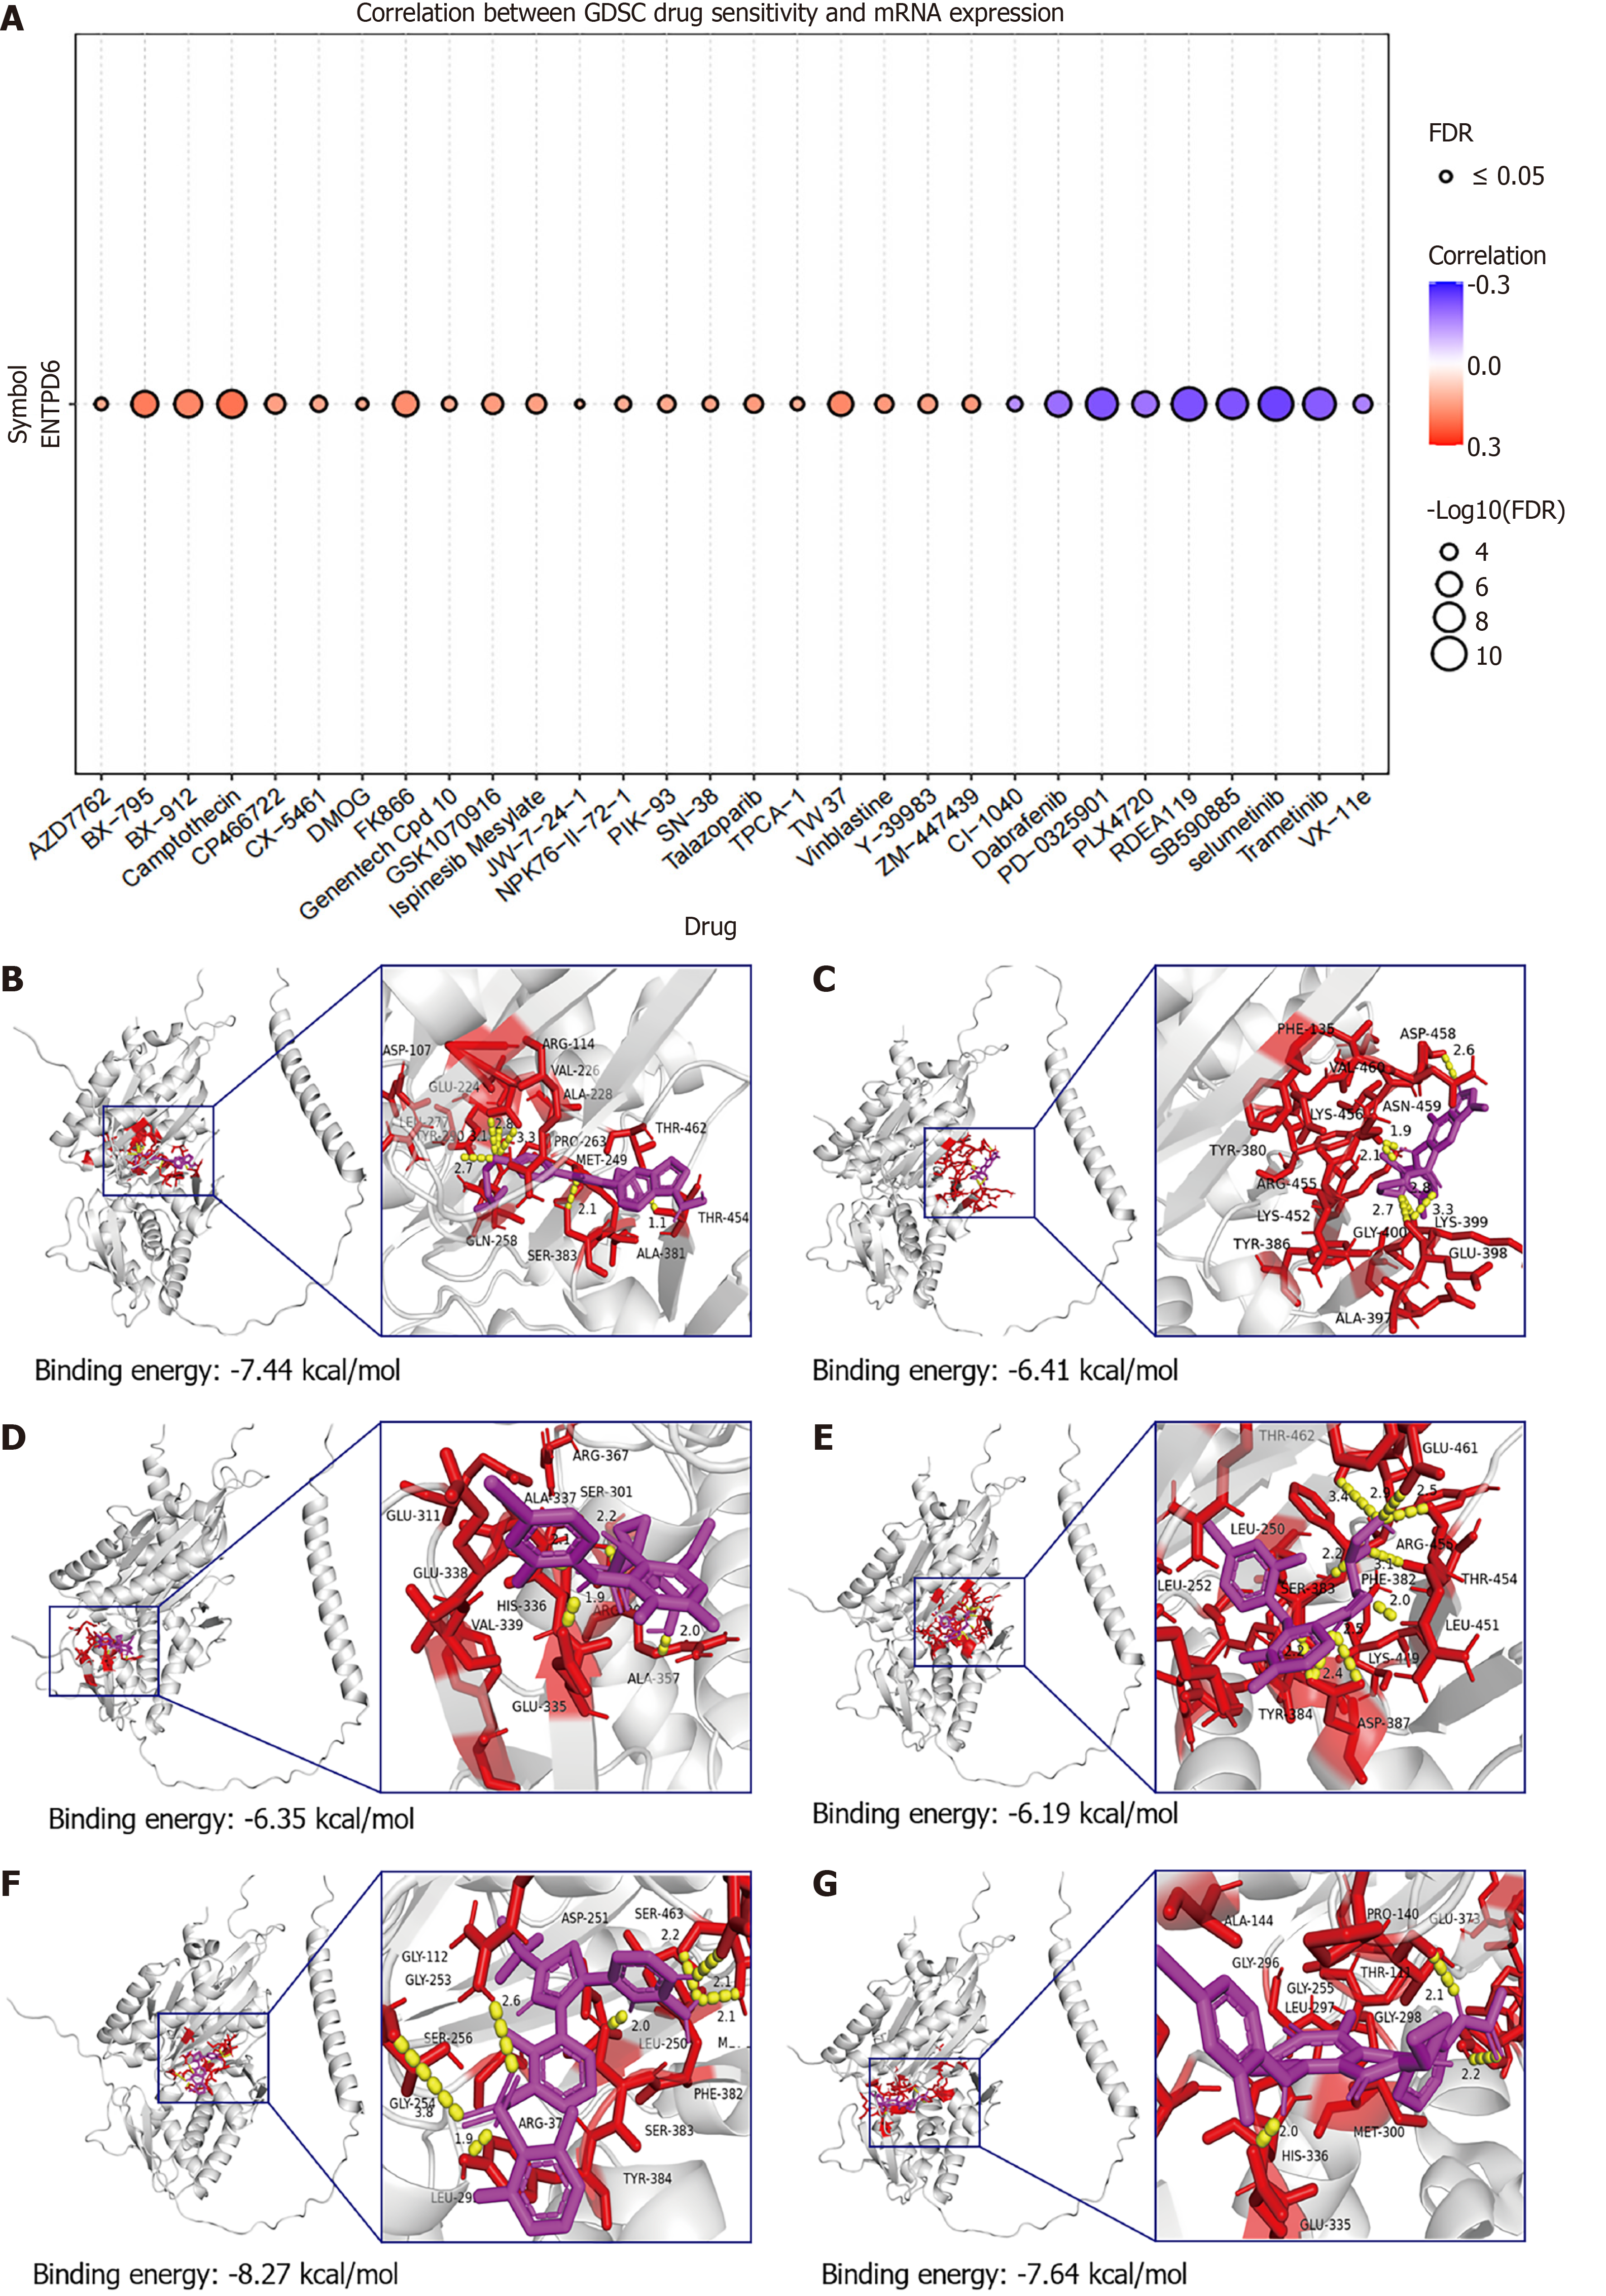
Figure 10 Drug sensitivity analysis.
A: Drug-sensitivity profiling of ectonucleoside triphosphate diphosphohydrolase 6 (ENTPD6) was conducted online using the Gene Set Cancer Analysis platform; B-G: Molecular docking results of ENTPD6 protein with SB590885, selumetinib, RDEA119, PD-0325901, dabrafenib, and trametinib. Silvery white represents ENTPD6 protein, blue represents amino acid residue, yellow represents hydrogen atoms, and magenta represents drugs. GDSC: Genomics of Drug Sensitivity in Cancer; ENTPD6: Ectonucleoside triphosphate diphosphohydrolase 6; FDR: False discovery rate.
- Citation: Wang G, Liu T, Zhang JX, Li YR, Zhu WJ, Wang JL, Dong WW, Zhang YY, Li YM, Yang LX, He LX, He WT. Systematic pan-cancer analysis reveals the prognostic and immunological roles of ectonucleoside triphosphate diphosphohydrolase 6. World J Clin Oncol 2025; 16(11): 111627
- URL: https://www.wjgnet.com/2218-4333/full/v16/i11/111627.htm
- DOI: https://dx.doi.org/10.5306/wjco.v16.i11.111627


