Copyright
©The Author(s) 2025.
World J Clin Oncol. Oct 24, 2025; 16(10): 112097
Published online Oct 24, 2025. doi: 10.5306/wjco.v16.i10.112097
Published online Oct 24, 2025. doi: 10.5306/wjco.v16.i10.112097
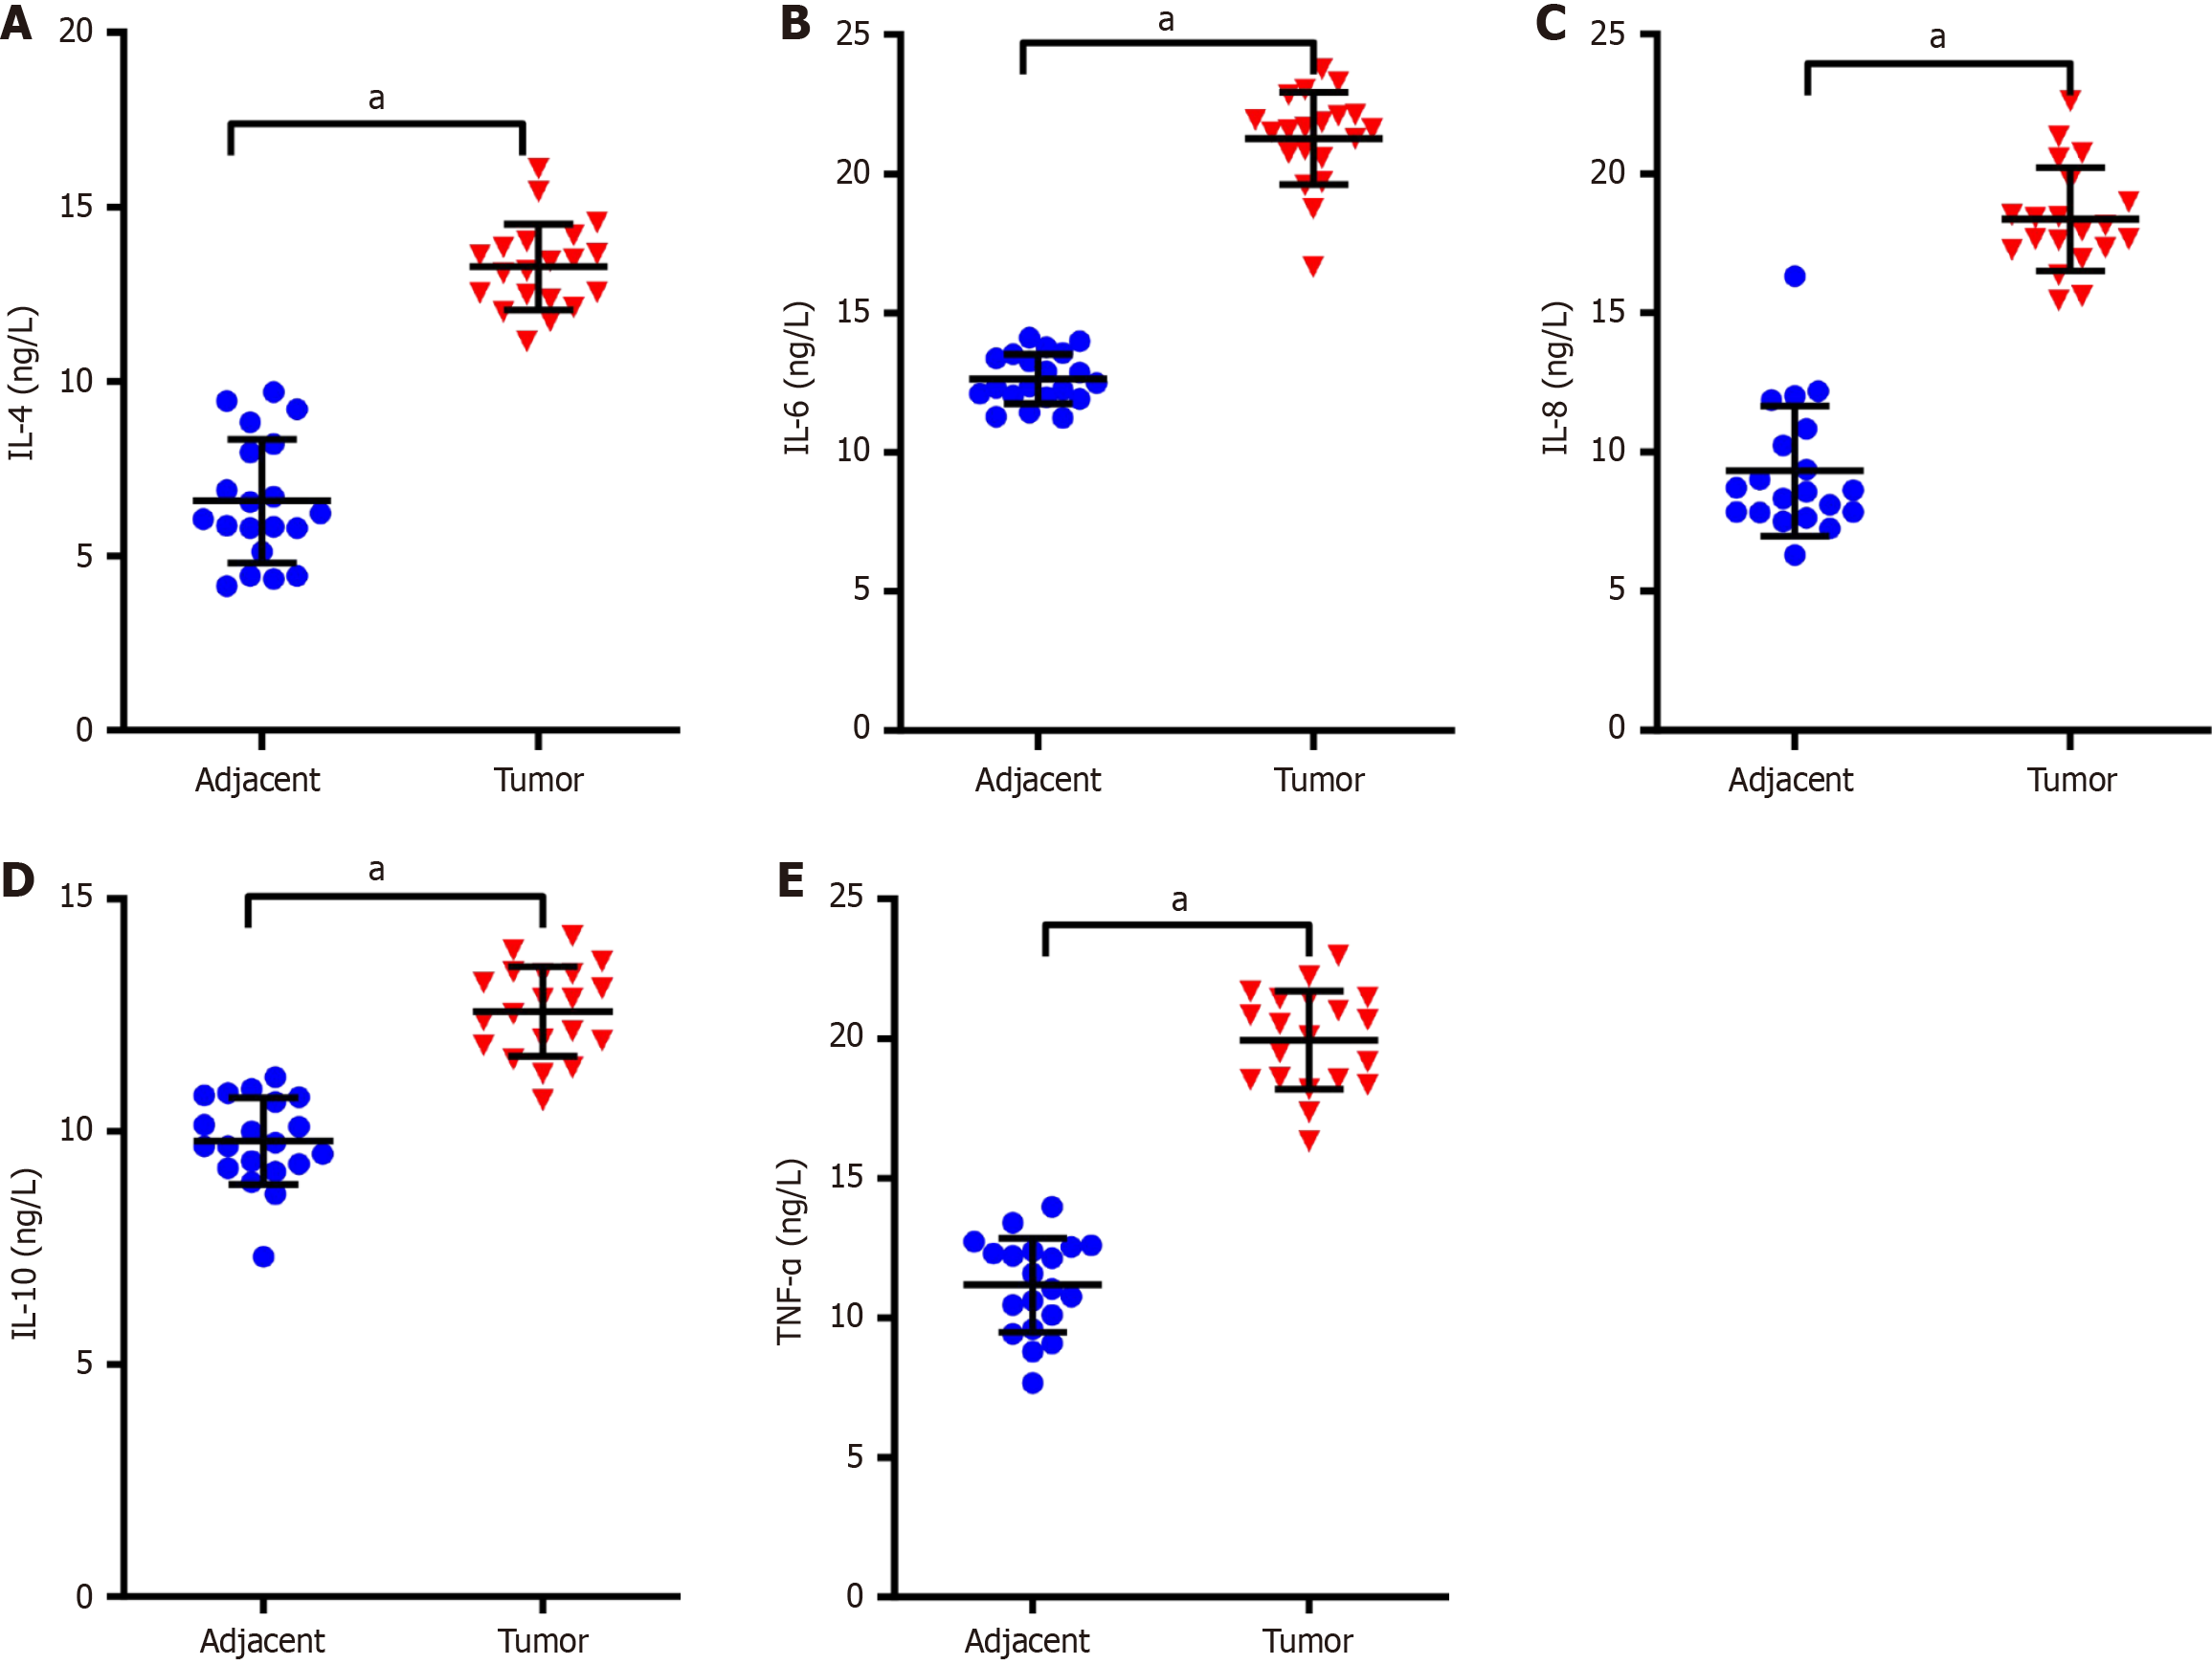
Figure 1 Elevated levels of inflammatory cytokines in tumor tissues of patients with non-small cell lung cancer.
A-E: Enzyme-linked immunosorbent assay was used to measure the levels of interleukin (IL)-4 (A), IL-6 (B), IL-8 (C), IL-10 (D) and tumor necrosis factor-α (E) in tumor tissues and paracancerous tissues. Data were presented as mean ± SD (n = 20). aP < 0.01. Statistical significance was determined using Student’s t-test. IL: Interleukin; TNF-α: Tumor necrosis factor-α.
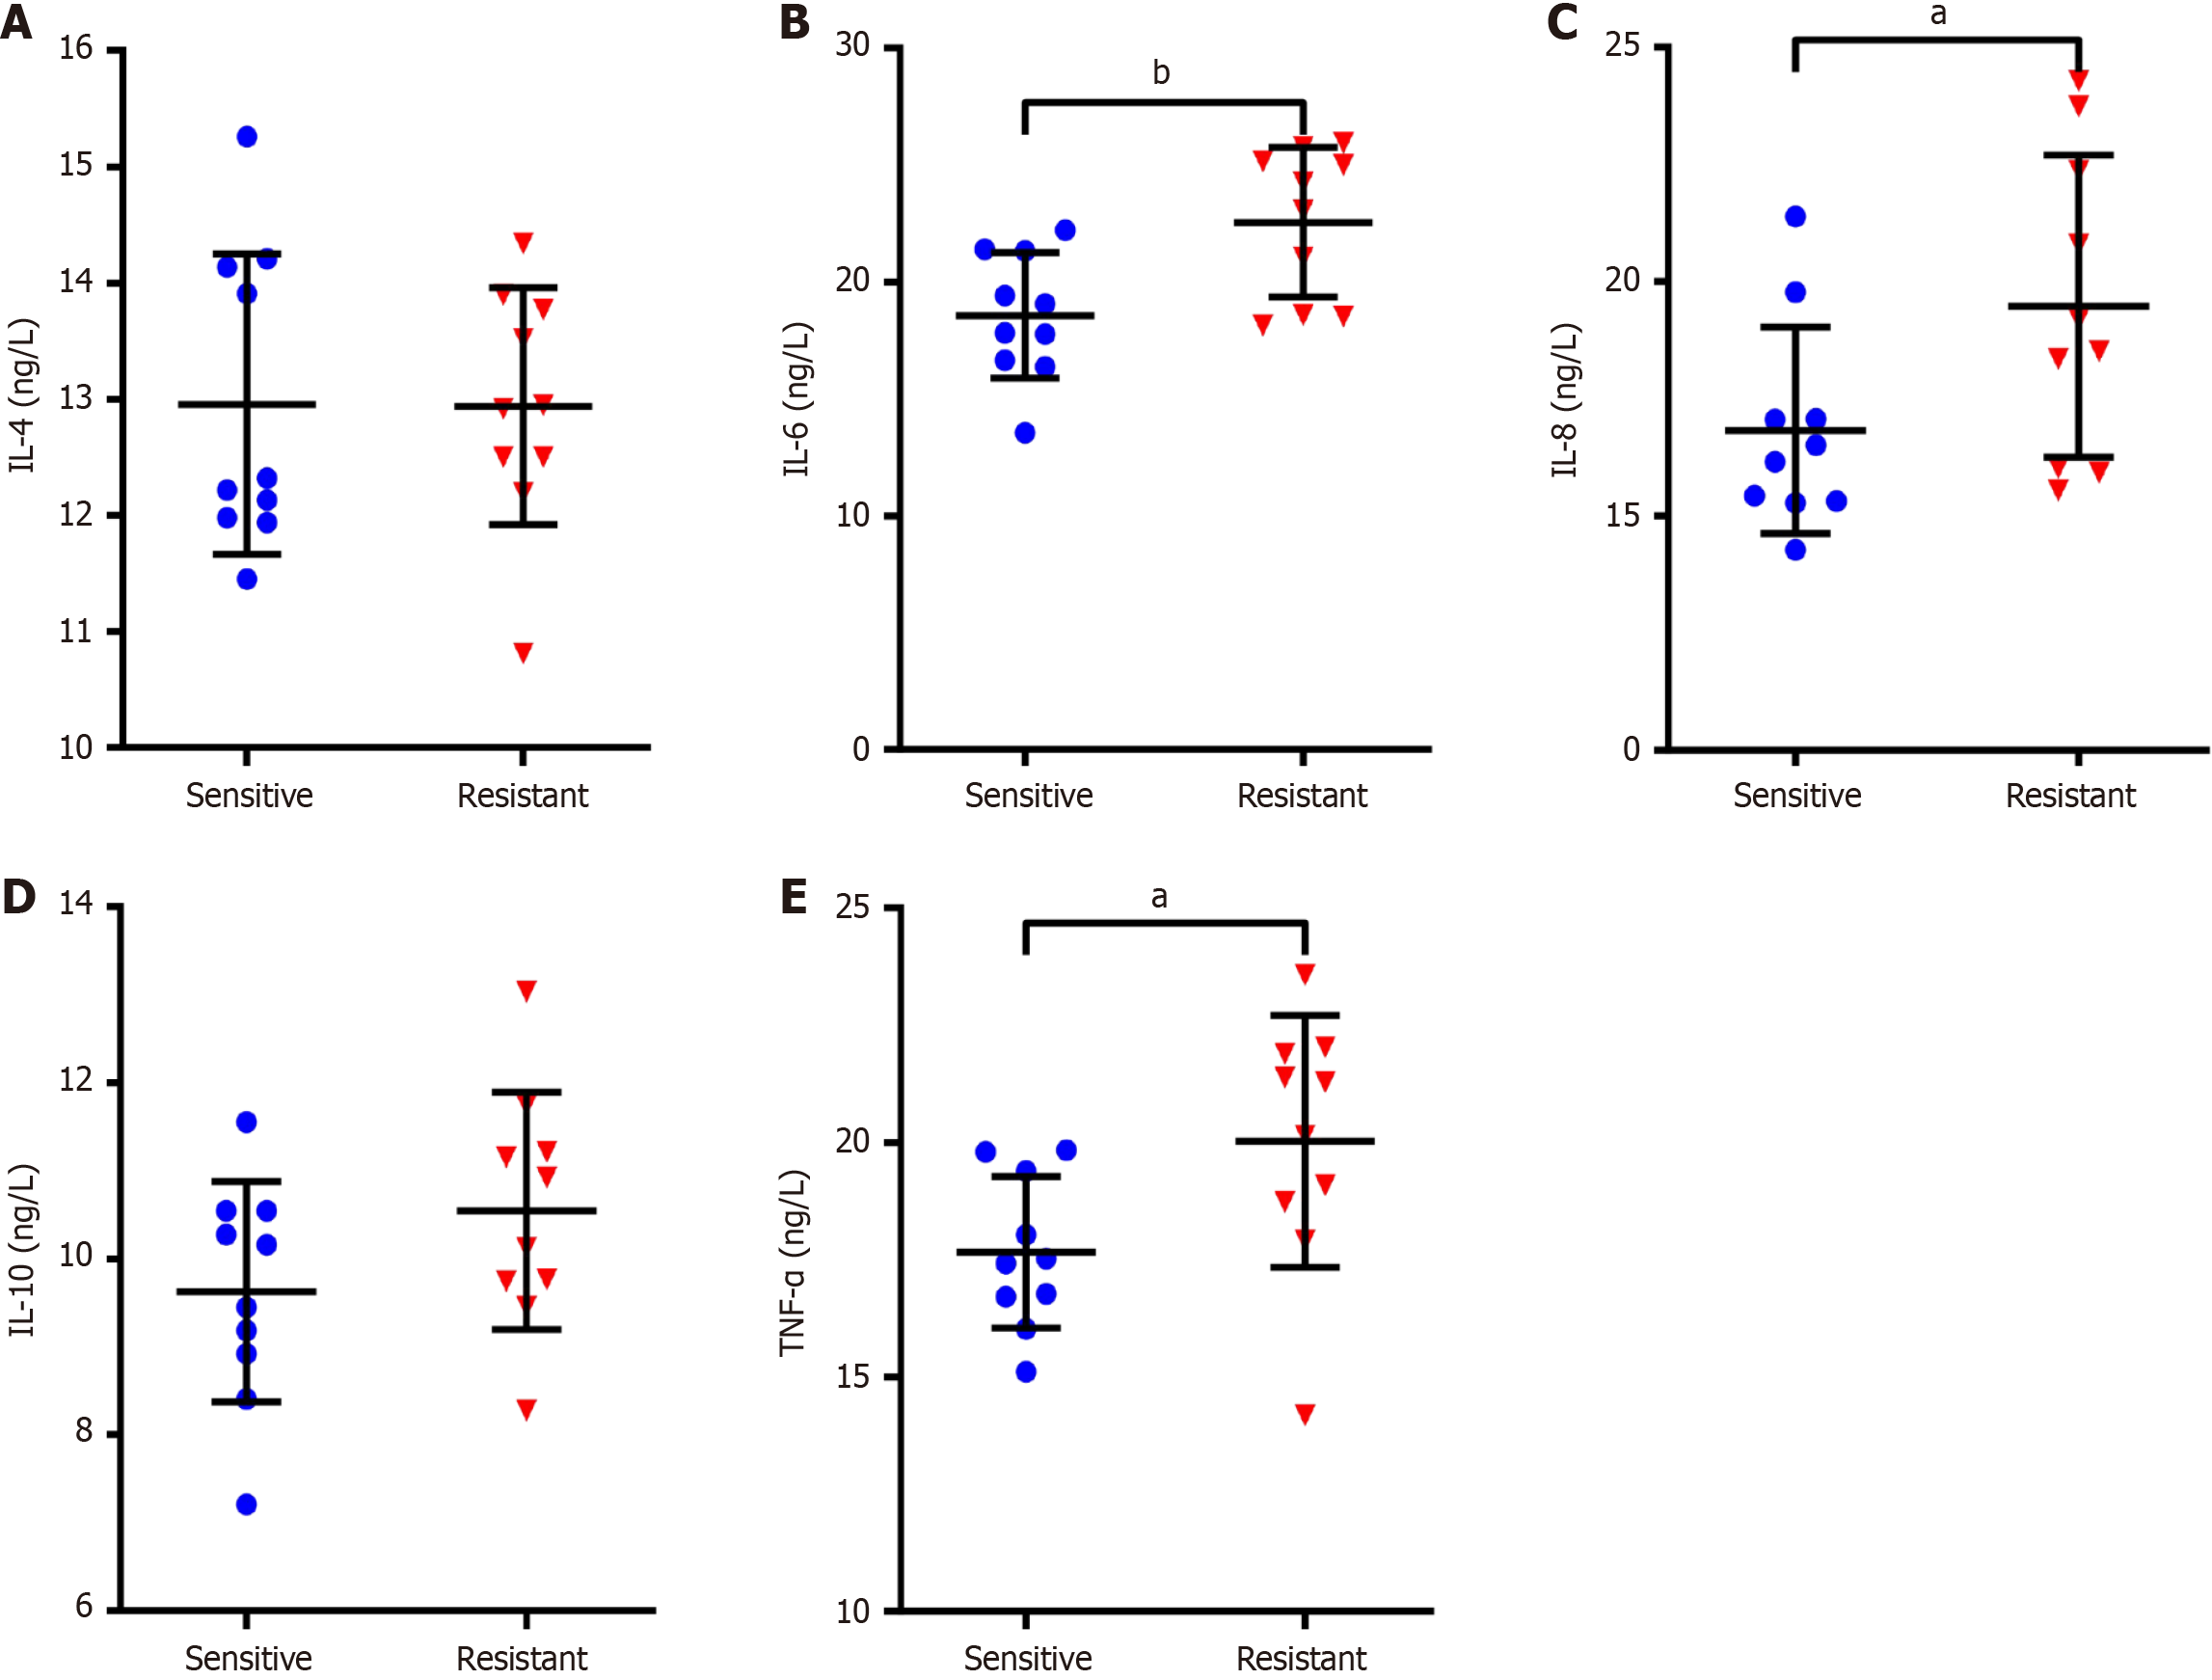
Figure 2 The association between the abnormal levels of inflammatory cytokines and cisplatin resistance.
A-E: Enzyme-linked immunosorbent assay was employed to measure the levels of interleukin (IL)-4 (A), IL-6 (B), IL-8 (C), IL-10 (D) and tumor necrosis factor-α (E) in tumor tissues of patients with non-small cell lung cancer who were sensitive and resistant to cisplatin. Data were presented as mean ± SD (n = 10). aP < 0.05, bP < 0.01. Statistical significance was determined using Student’s t-test. IL: Interleukin; TNF-α: Tumor necrosis factor-α.
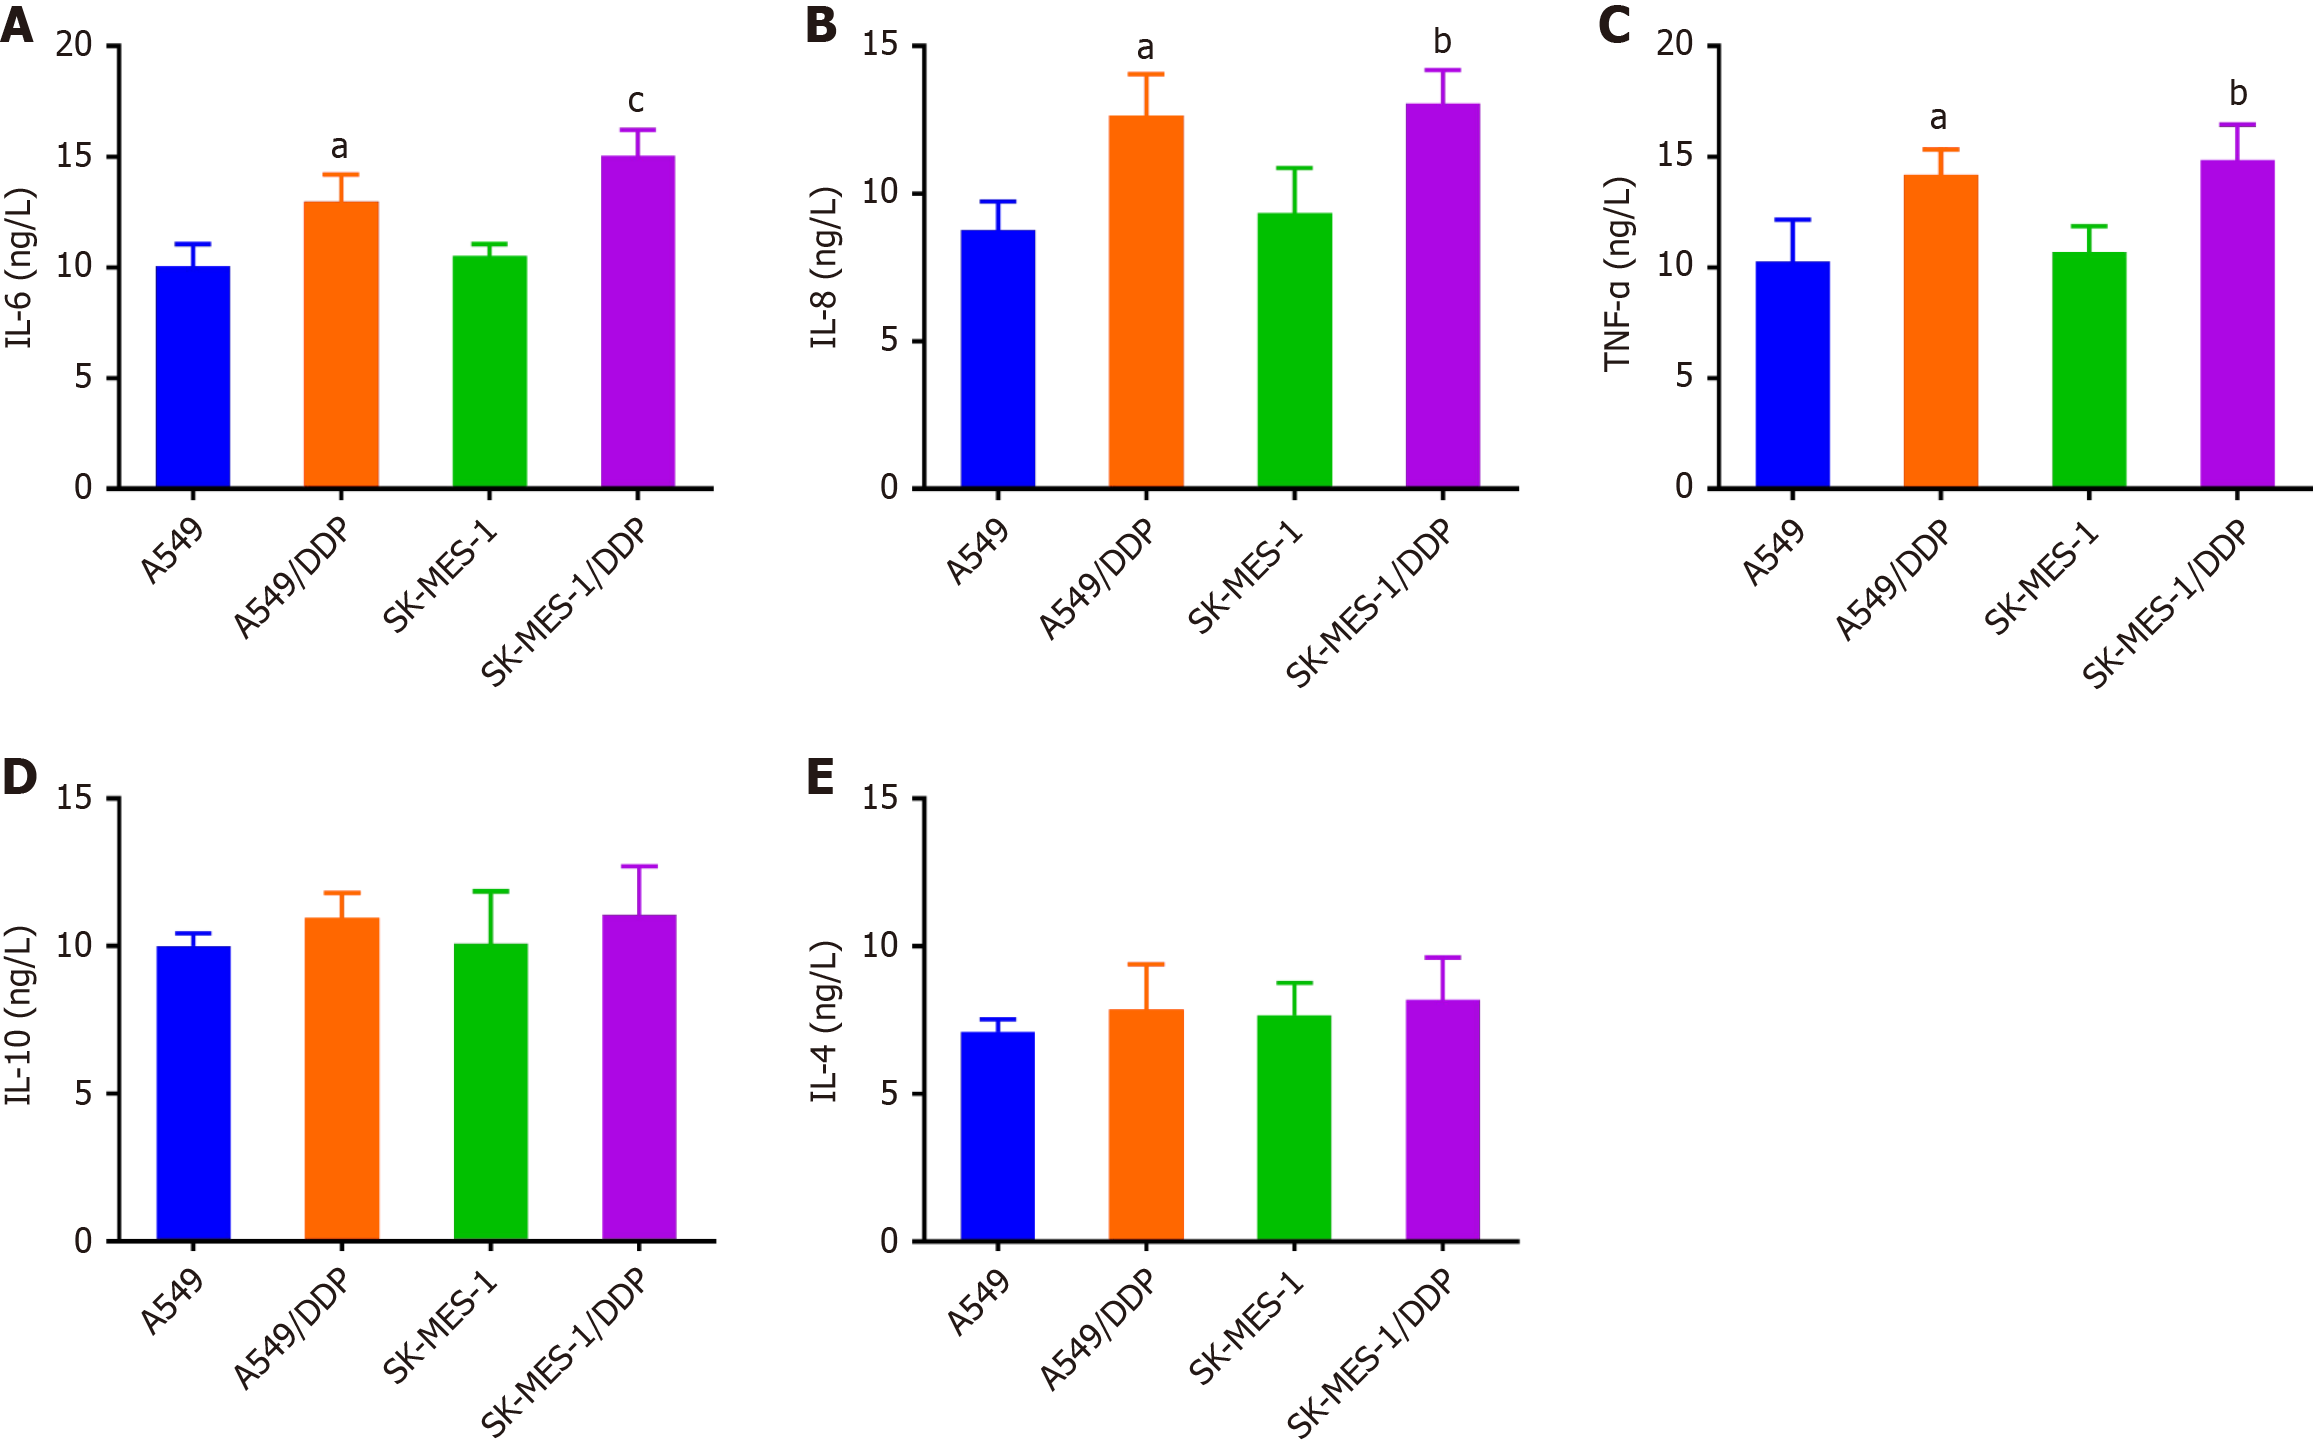
Figure 3 Elevated levels of inflammatory cytokines in cisplatin-resistant non-small cell lung cancer cells.
A-E: Enzyme-linked immunosorbent assay was utilized to detect the levels of interleukin (IL)-6 (A), IL-8 (B), tumor necrosis factor-α (C), IL-10 (D) and IL-4 (E) in the supernatant of the cell culture medium. Data were presented as mean ± SD (n = 3). aP < 0.05 vs A549; bP < 0.05, cP < 0.01 vs SK-MES-1. Statistical significance was determined using one-way ANOVA followed by Tukey’s post hoc test. IL: Interleukin; TNF-α: Tumor necrosis factor-α; DDP: Cisplatin.
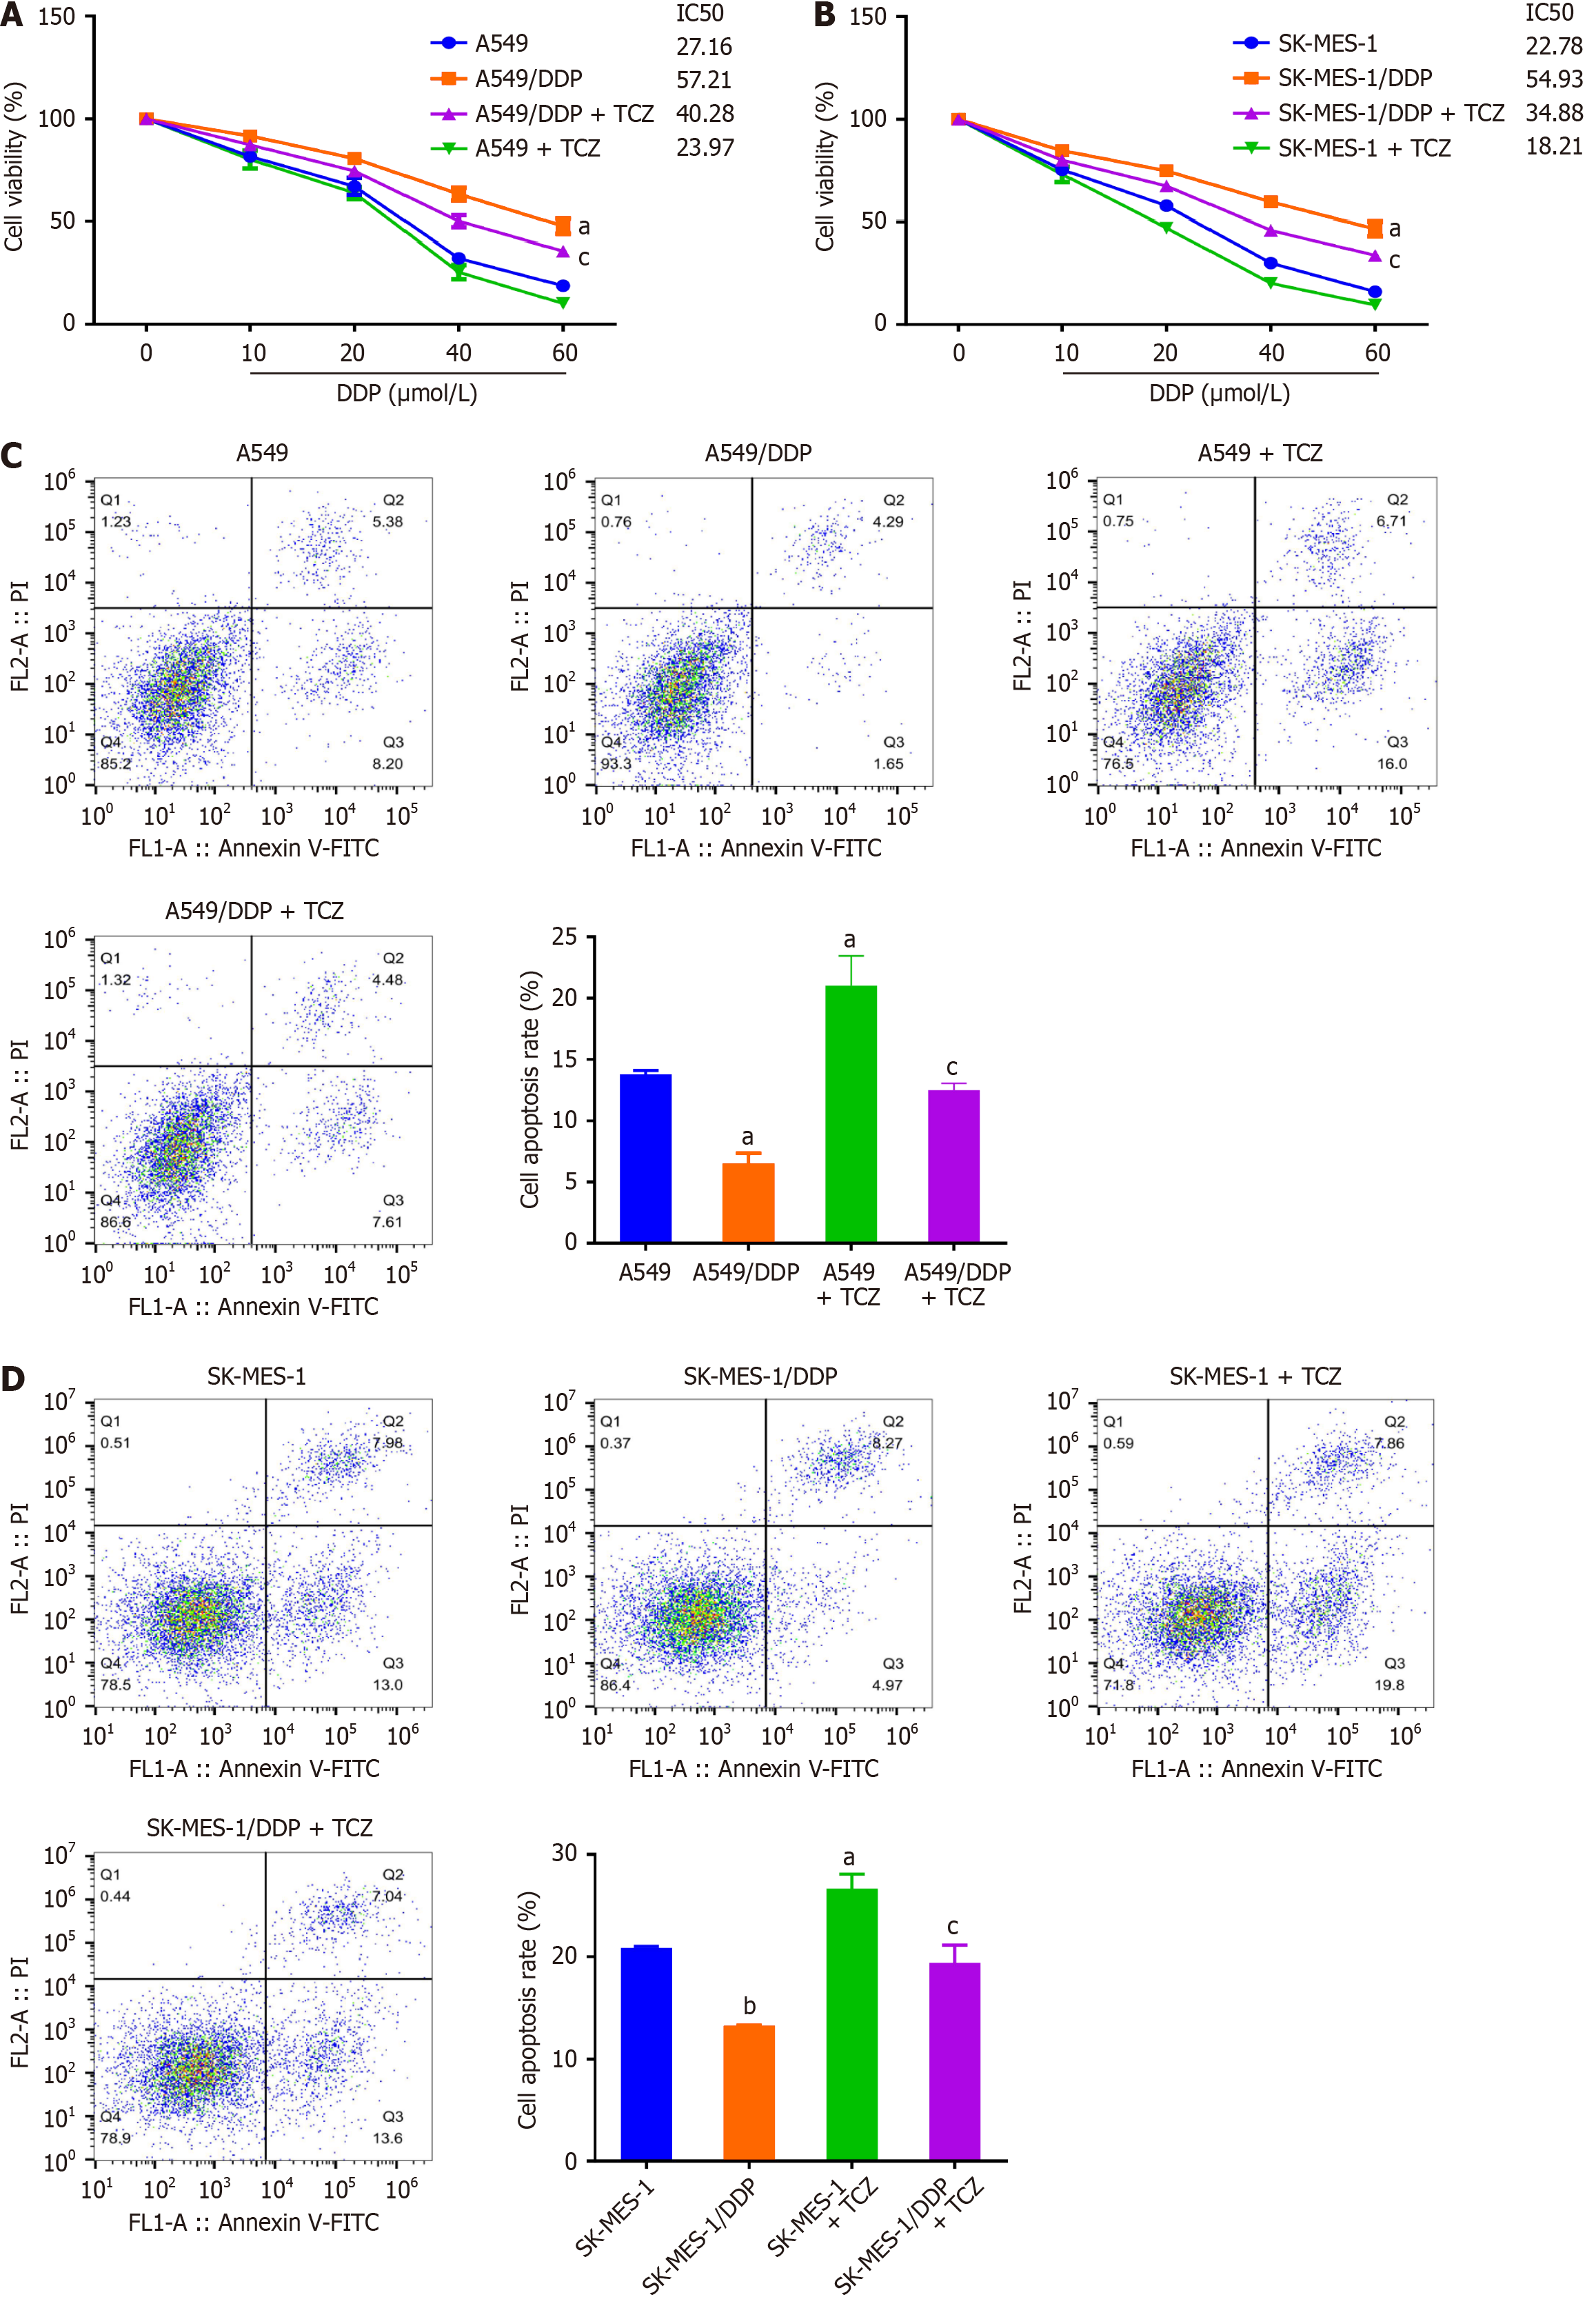
Figure 4 Inhibition of interleukin-6 reduces cell viability and induces apoptosis in drug-resistant non-small cell lung cancer cells under cisplatin treatment.
A: Cell counting kit-8 was adopted to assess the viability and half-maximal inhibitory concentration of cells in each group under cisplatin (DDP) treatments; B: Cells in each group were treated with DDP (20 μmol/L), and flow cytometry was used to determine the apoptotic rate; C: Representative flow cytometry plots and quantification of apoptotic rates in A549 and A549/DDP cells treated with DDP (20 μmol/L) ± tocilizumab (TCZ); D: Representative flow cytometry plots and quantification of apoptotic rates in SK-MES-1 and SK-MES-1/DDP cells treated with DDP (20 μmol/L) ± TCZ. Data were presented as mean ± SD (n = 3). aP < 0.05, bP < 0.01 vs A549 or SK-MES-1; cP < 0.05 vs A549/DDP or SK-MES-1/DDP. Statistical significance was determined using one-way ANOVA followed by Tukey’s post hoc test. DDP: Cisplatin; TCZ: Tocilizumab.
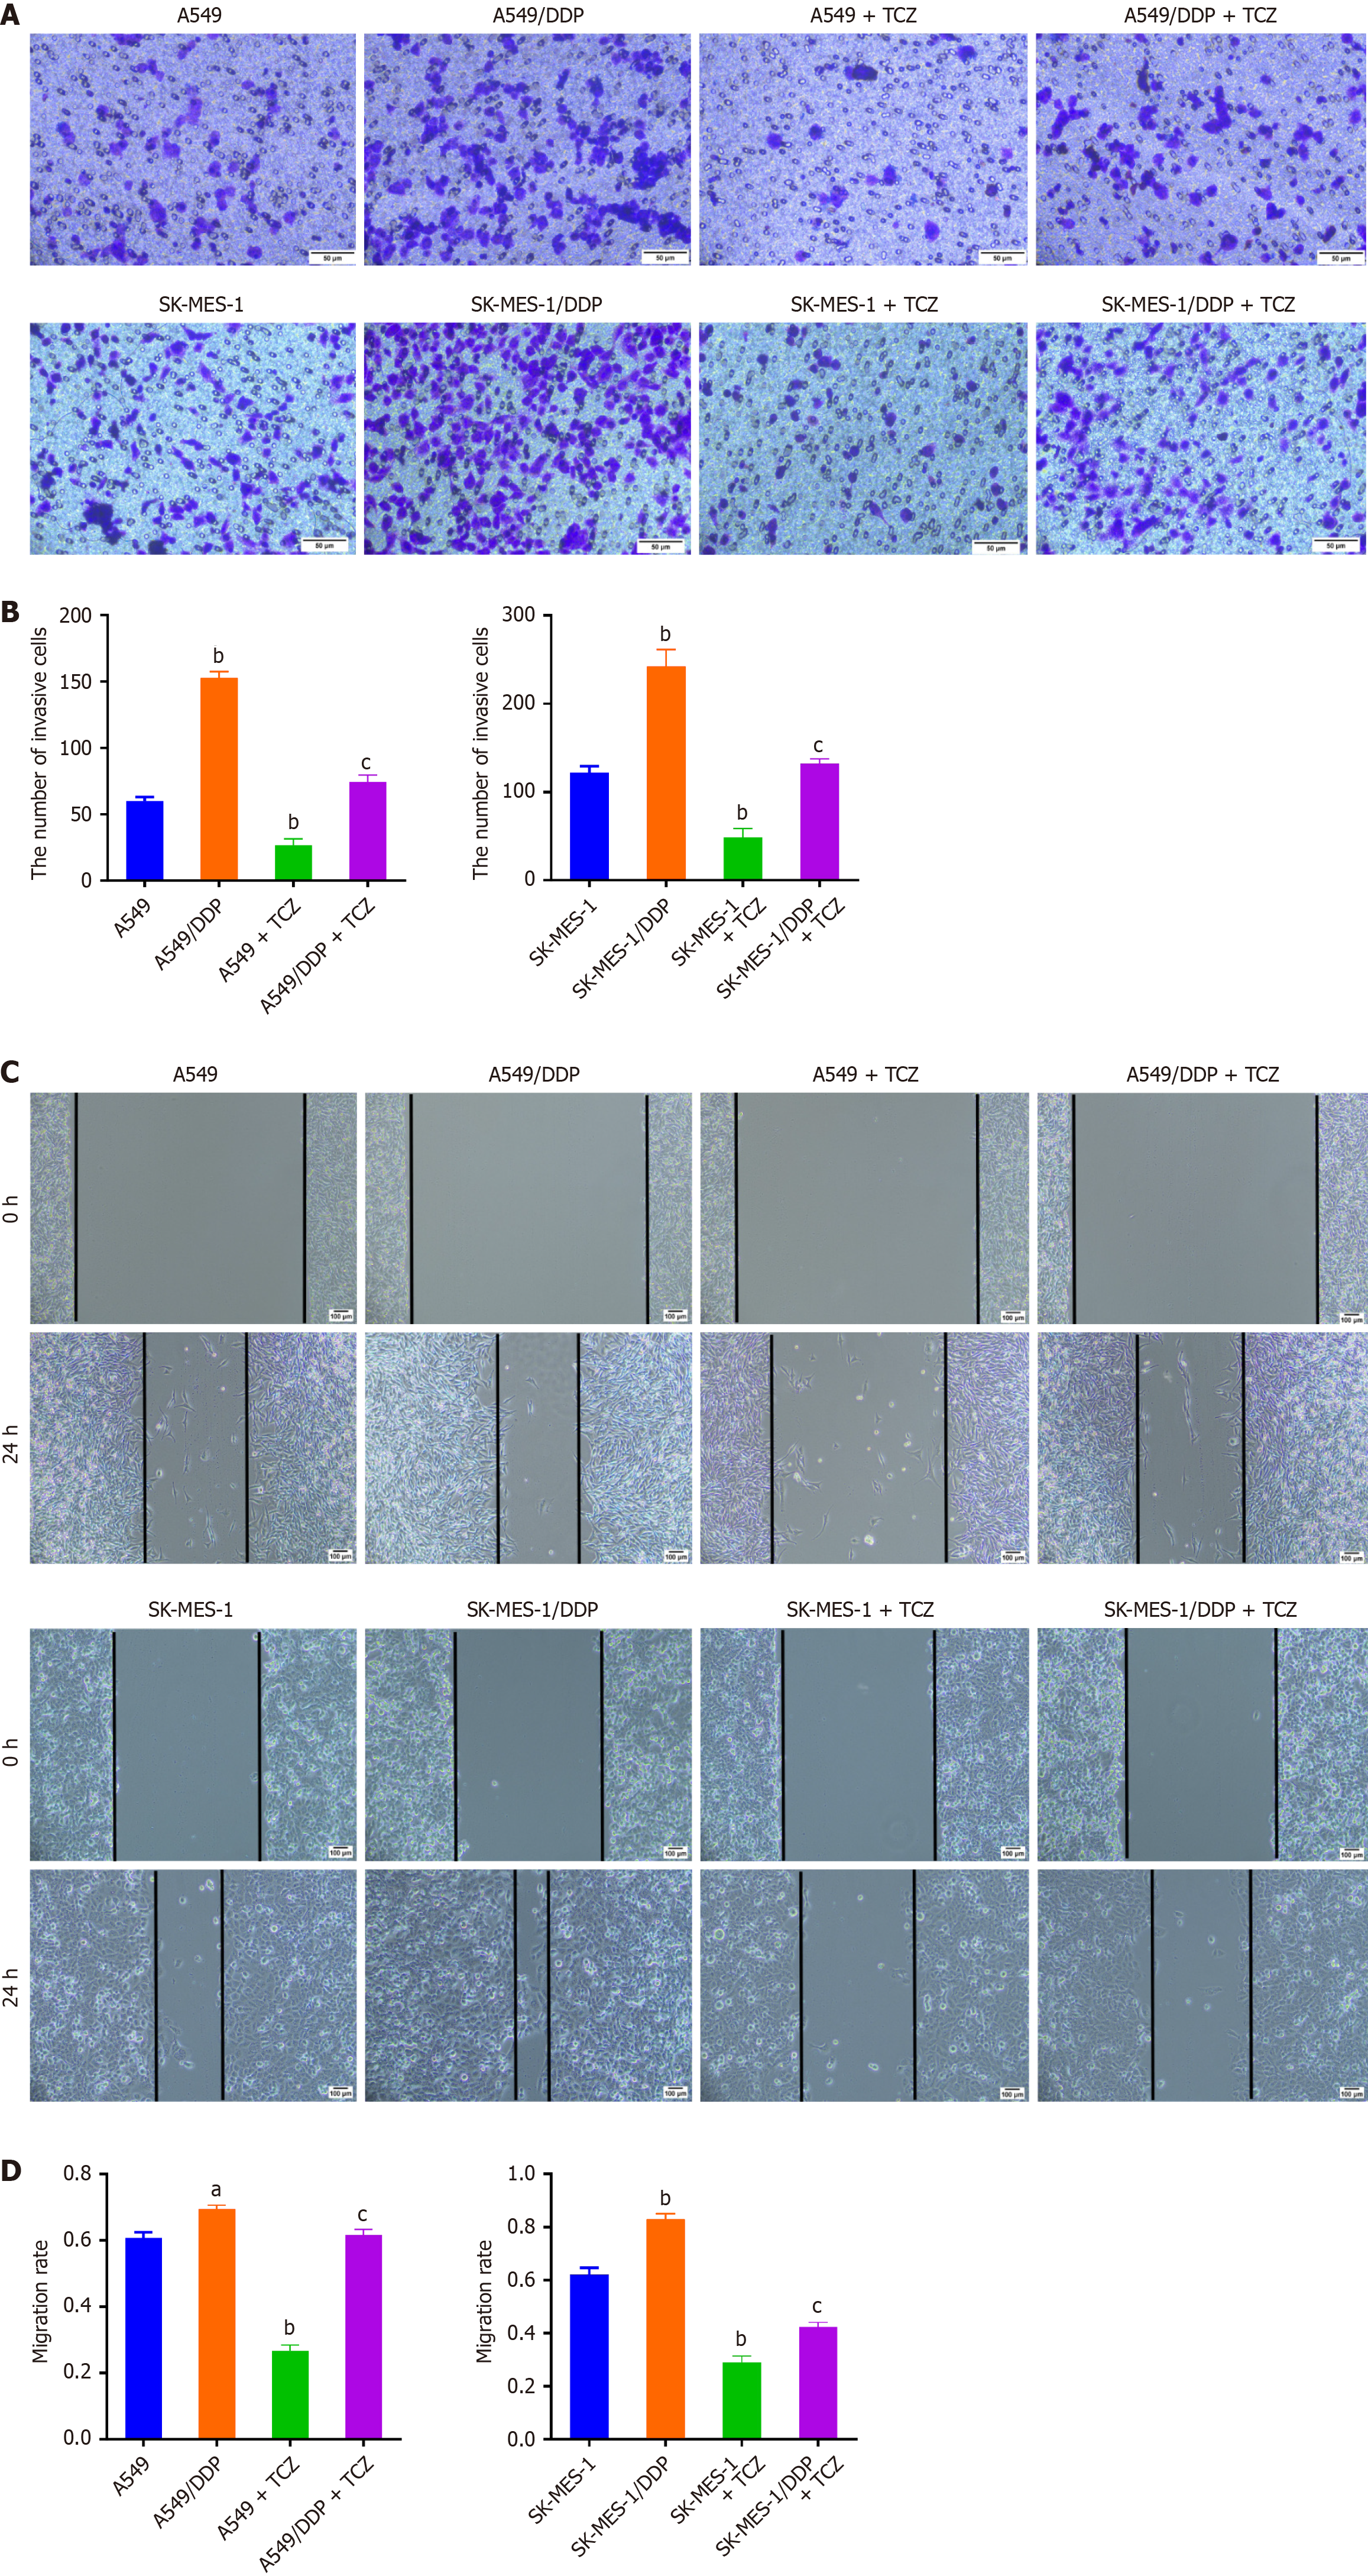
Figure 5 Inhibition of interleukin-6 reduces the migration and invasion of drug-resistant non-small cell lung cancer cells under cisplatin treatment.
A: Cells in each group were treated with cisplatin (DDP; 20 μmol/L), and a transwell assay was applied to detect the cell invasion; B: The cells were treated with the DDP (20 μmol/L), and a scratch assay was adopted to assess the migration rate of cells; C: Representative images of scratch assays performed at 0 hour and 24 hours to evaluate the migration of A549, A549/DDP, SK-MES-1, and SK-MES-1/DDP cells under DDP ± tocilizumab treatment; D: Quantification of cell migration rates from panel C. Data were presented as mean ± SD (n = 3). aP < 0.05, bP < 0.01 vs A549 or SK-MES-1; cP < 0.01 vs A549/DDP or SK-MES-1/DDP. Statistical significance was determined using one-way ANOVA followed by Tukey’s post hoc test. DDP: Cisplatin; TCZ: Tocilizumab.
- Citation: Dai Y, Liu YY, Cao N, Tian XW, Feng J, Hu ZZ, Xu JQ. Overcoming chemoresistance in non-small cell lung cancer: Insights into the influence of inflammatory factors on treatment response. World J Clin Oncol 2025; 16(10): 112097
- URL: https://www.wjgnet.com/2218-4333/full/v16/i10/112097.htm
- DOI: https://dx.doi.org/10.5306/wjco.v16.i10.112097


