Copyright
©The Author(s) 2025.
World J Clin Oncol. Oct 24, 2025; 16(10): 110047
Published online Oct 24, 2025. doi: 10.5306/wjco.v16.i10.110047
Published online Oct 24, 2025. doi: 10.5306/wjco.v16.i10.110047
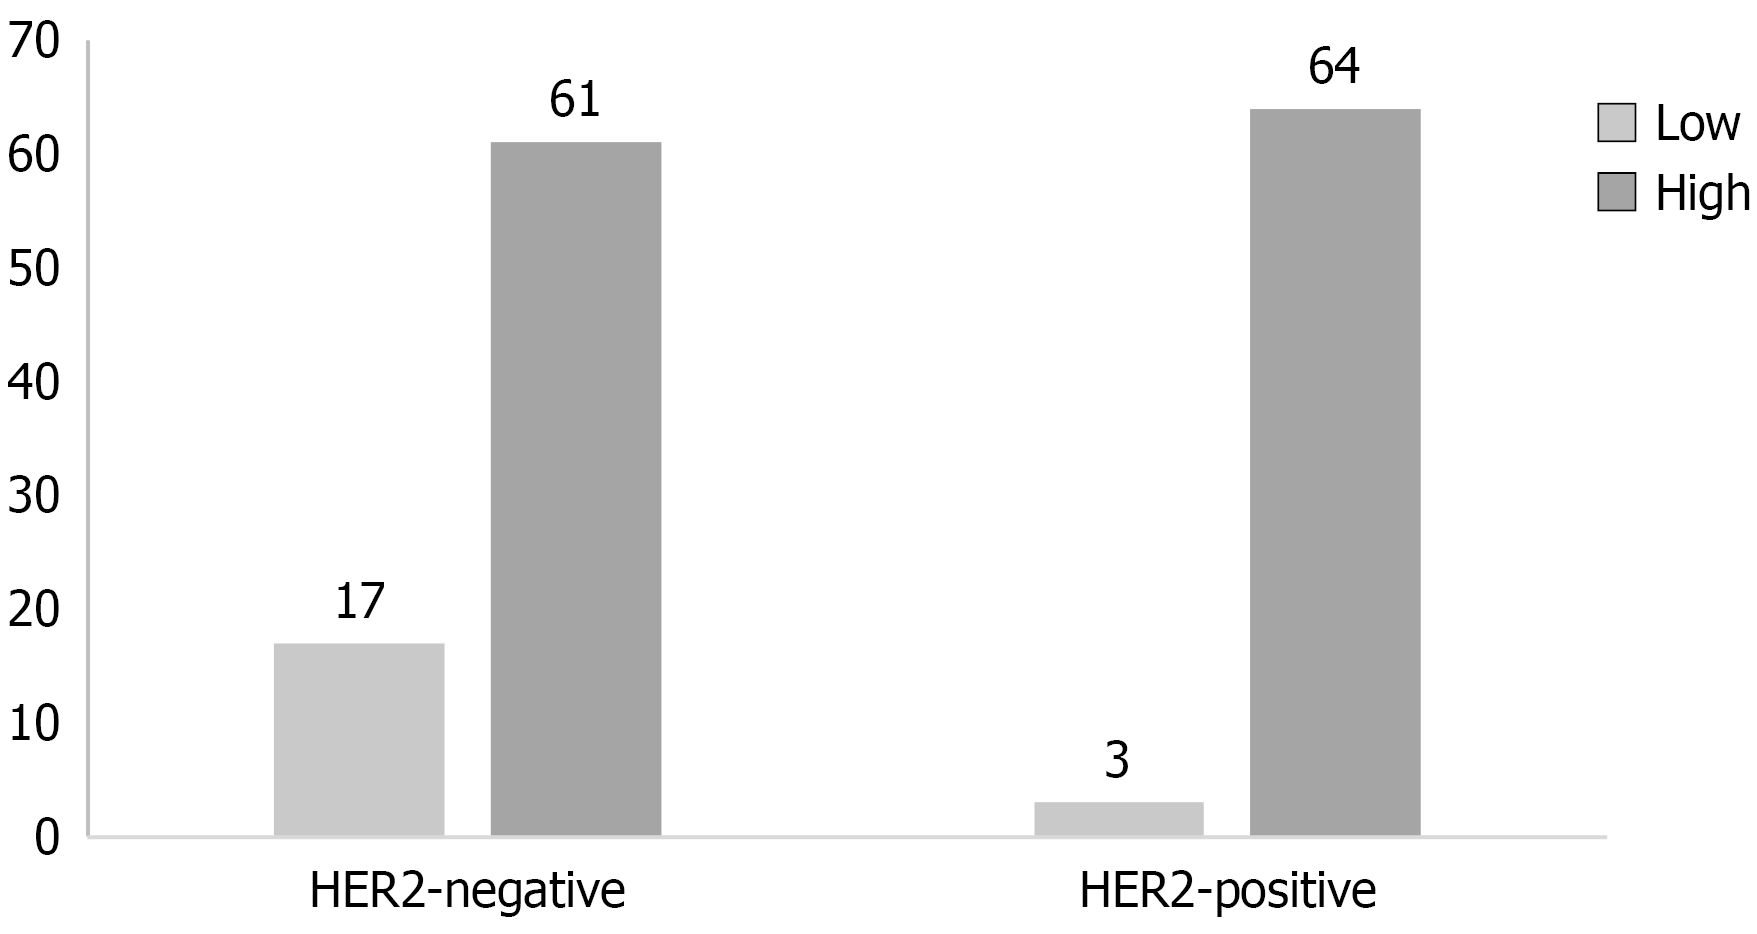
Figure 1 A bar graph of the correlation between human epidermal growth factor receptor 2 expression and tumor grade in upper tract urothelial carcinoma patients.
HER2: Human epidermal growth factor receptor 2.
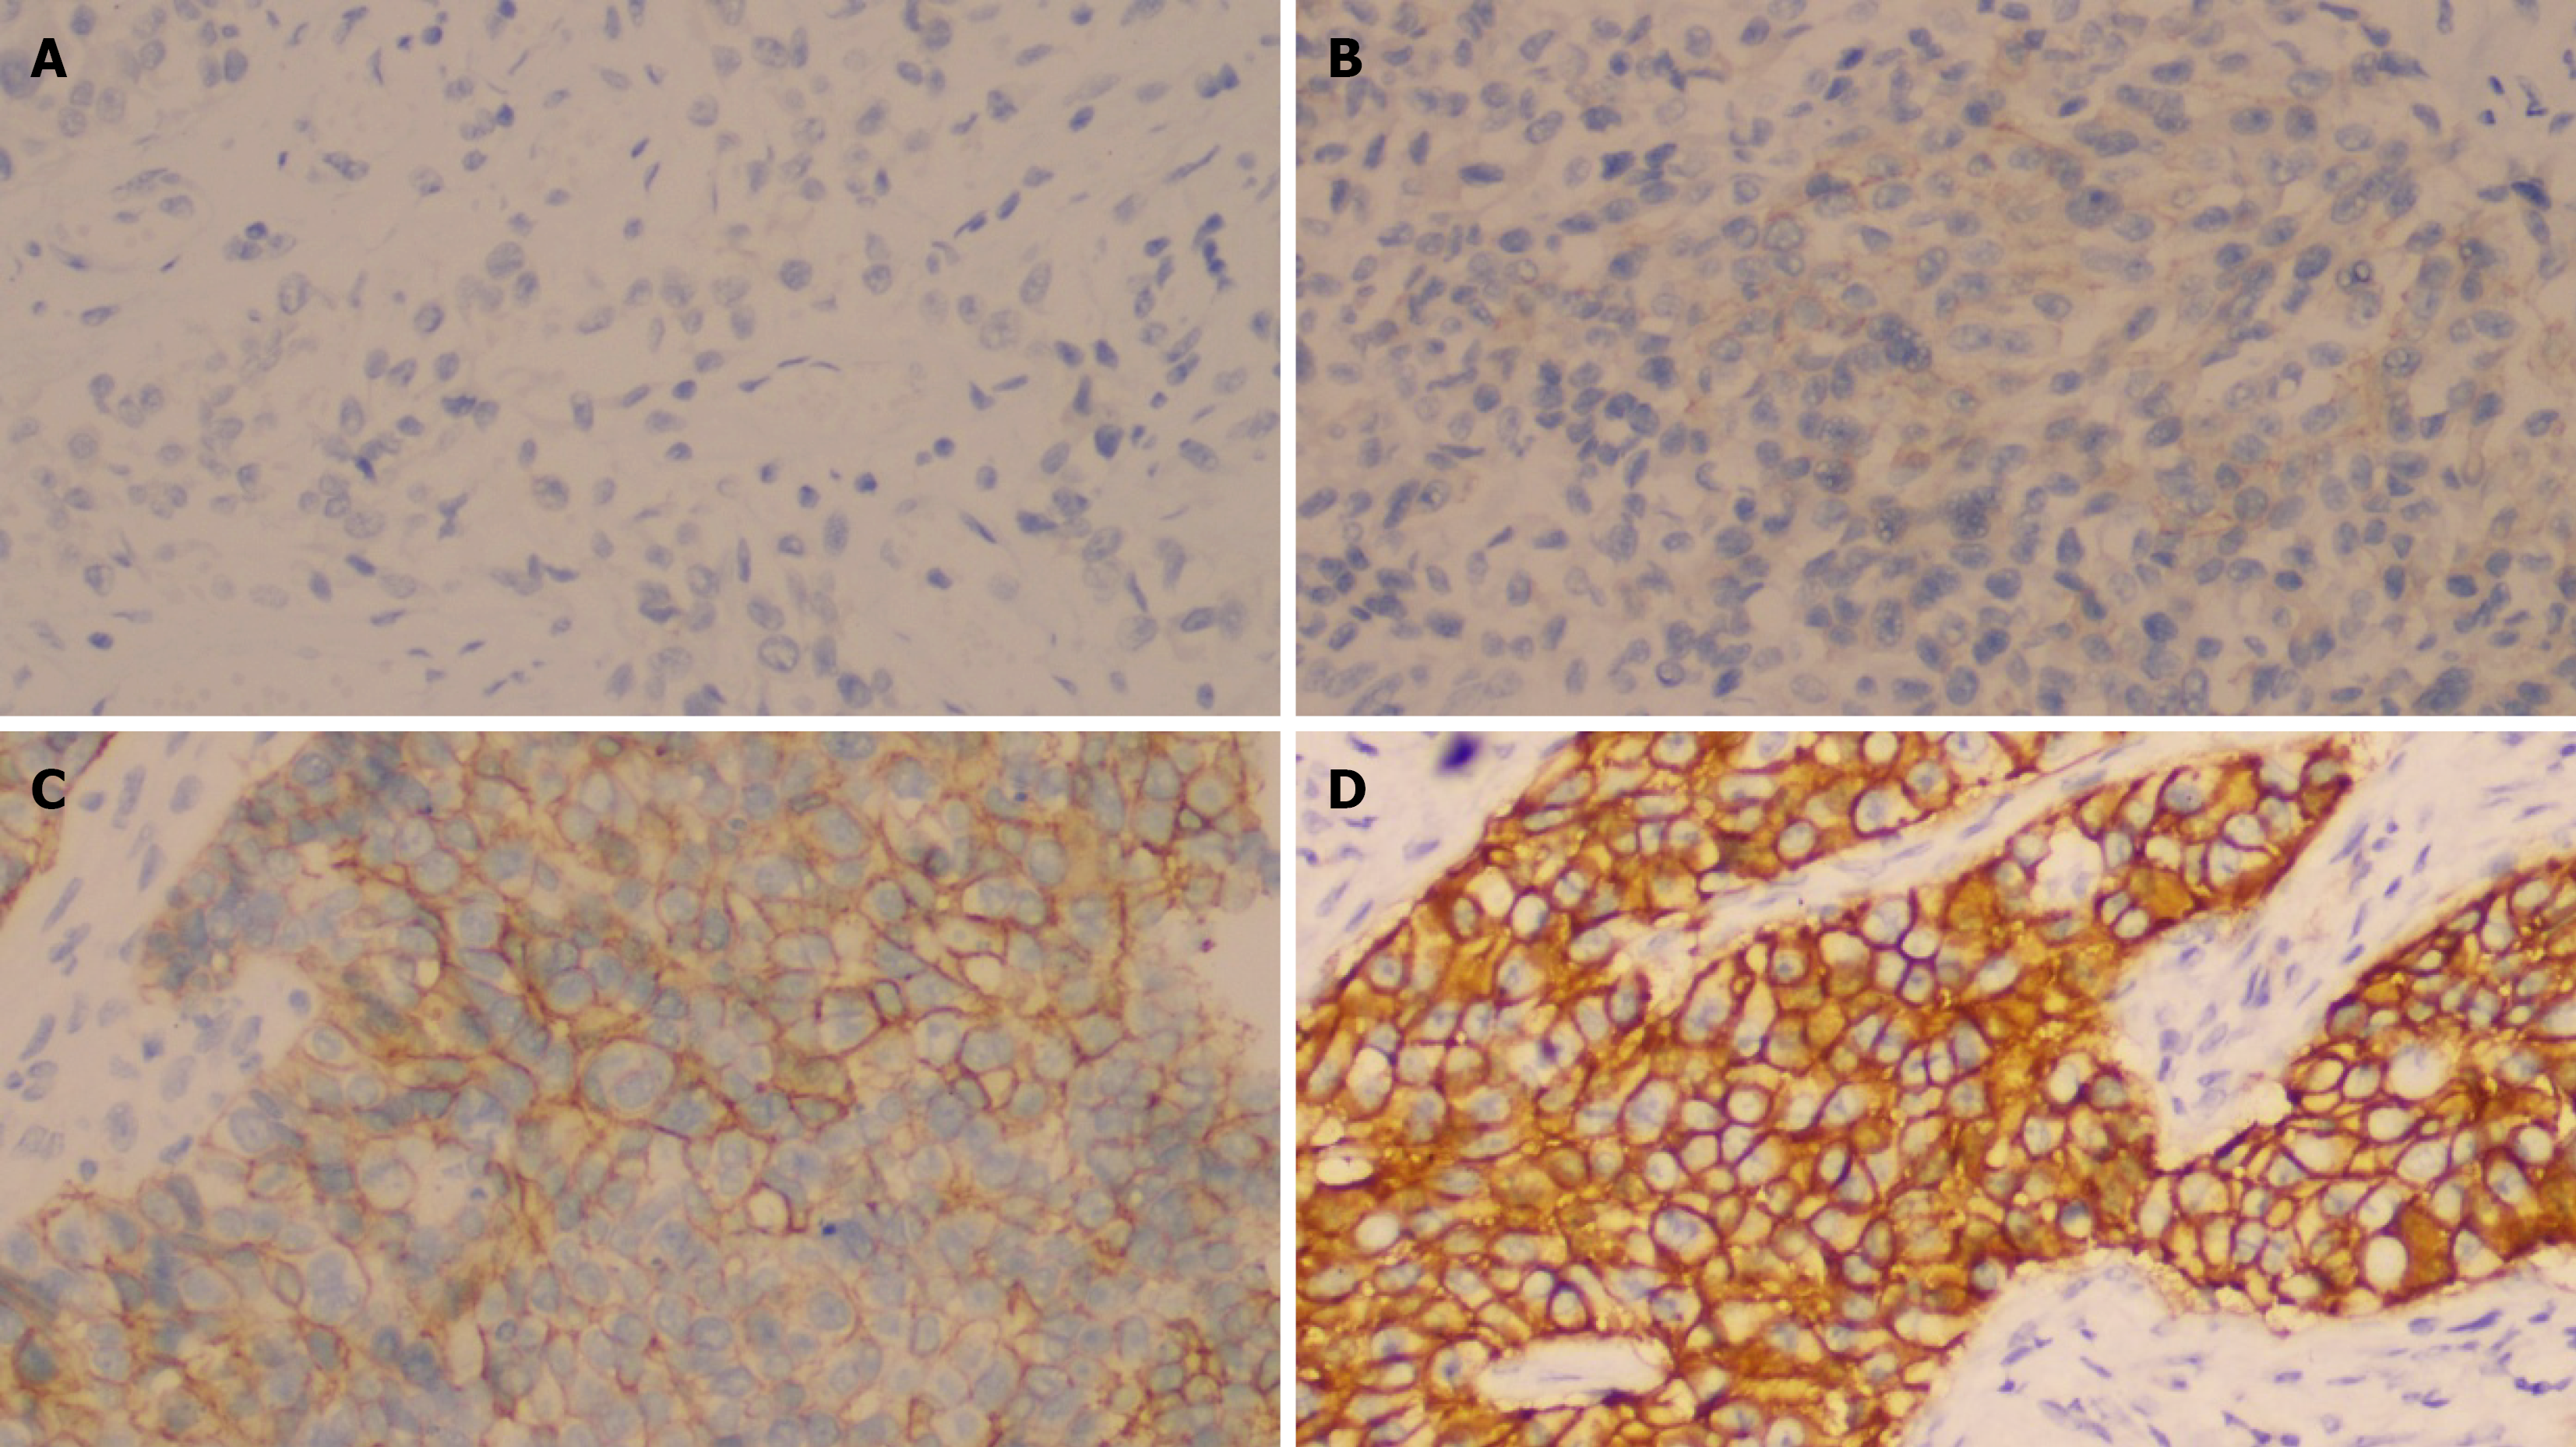
Figure 2 The representative immunohistochemical staining patterns of four different intensity grades of human epidermal growth factor receptor 2.
A: No staining observed or < 10% of invasive tumor cells showed incomplete and faint membrane staining were scored 0; B: ≥ 10% of invasive tumor cells demonstrated incomplete and faint membrane staining were scored 1+; C: Either ≥ 10% of invasive tumor cells showed weak-to-moderate intensity complete circumferential membrane staining or < 10% of invasive tumor cells exhibited complete circumferential membrane staining were scored 2+; D: ≥ 10% of invasive tumor cells showed strong intensity complete circumferential membrane staining were scored 3+; Original magnification, × 200.
Figure 3 The representative immunohistochemical staining patterns of CK20 and CK5/6.
A: CK20; B: CK5/6; Original magnification, × 200.
- Citation: Huang L, He J. Human epidermal growth factor receptor 2 overexpression is associated with high-grade tumors in upper tract urothelial carcinoma. World J Clin Oncol 2025; 16(10): 110047
- URL: https://www.wjgnet.com/2218-4333/full/v16/i10/110047.htm
- DOI: https://dx.doi.org/10.5306/wjco.v16.i10.110047


