Copyright
©The Author(s) 2025.
World J Clin Oncol. Oct 24, 2025; 16(10): 108419
Published online Oct 24, 2025. doi: 10.5306/wjco.v16.i10.108419
Published online Oct 24, 2025. doi: 10.5306/wjco.v16.i10.108419
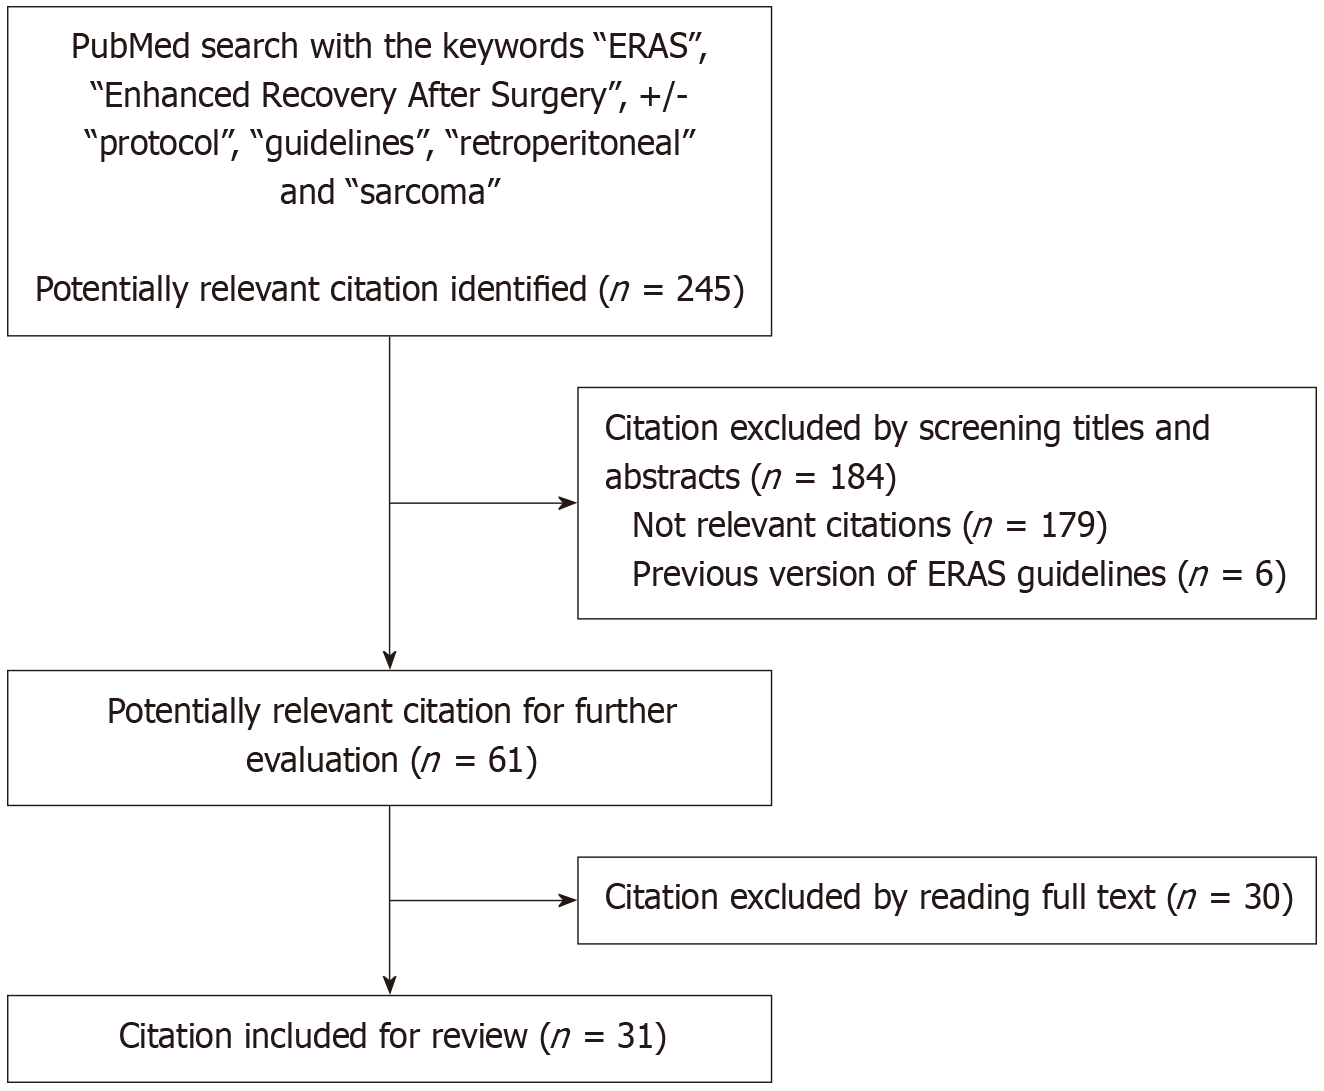
Figure 1 PRISMA flow diagram of literature search and review.
ERAS: Enhanced recovery after surgery.
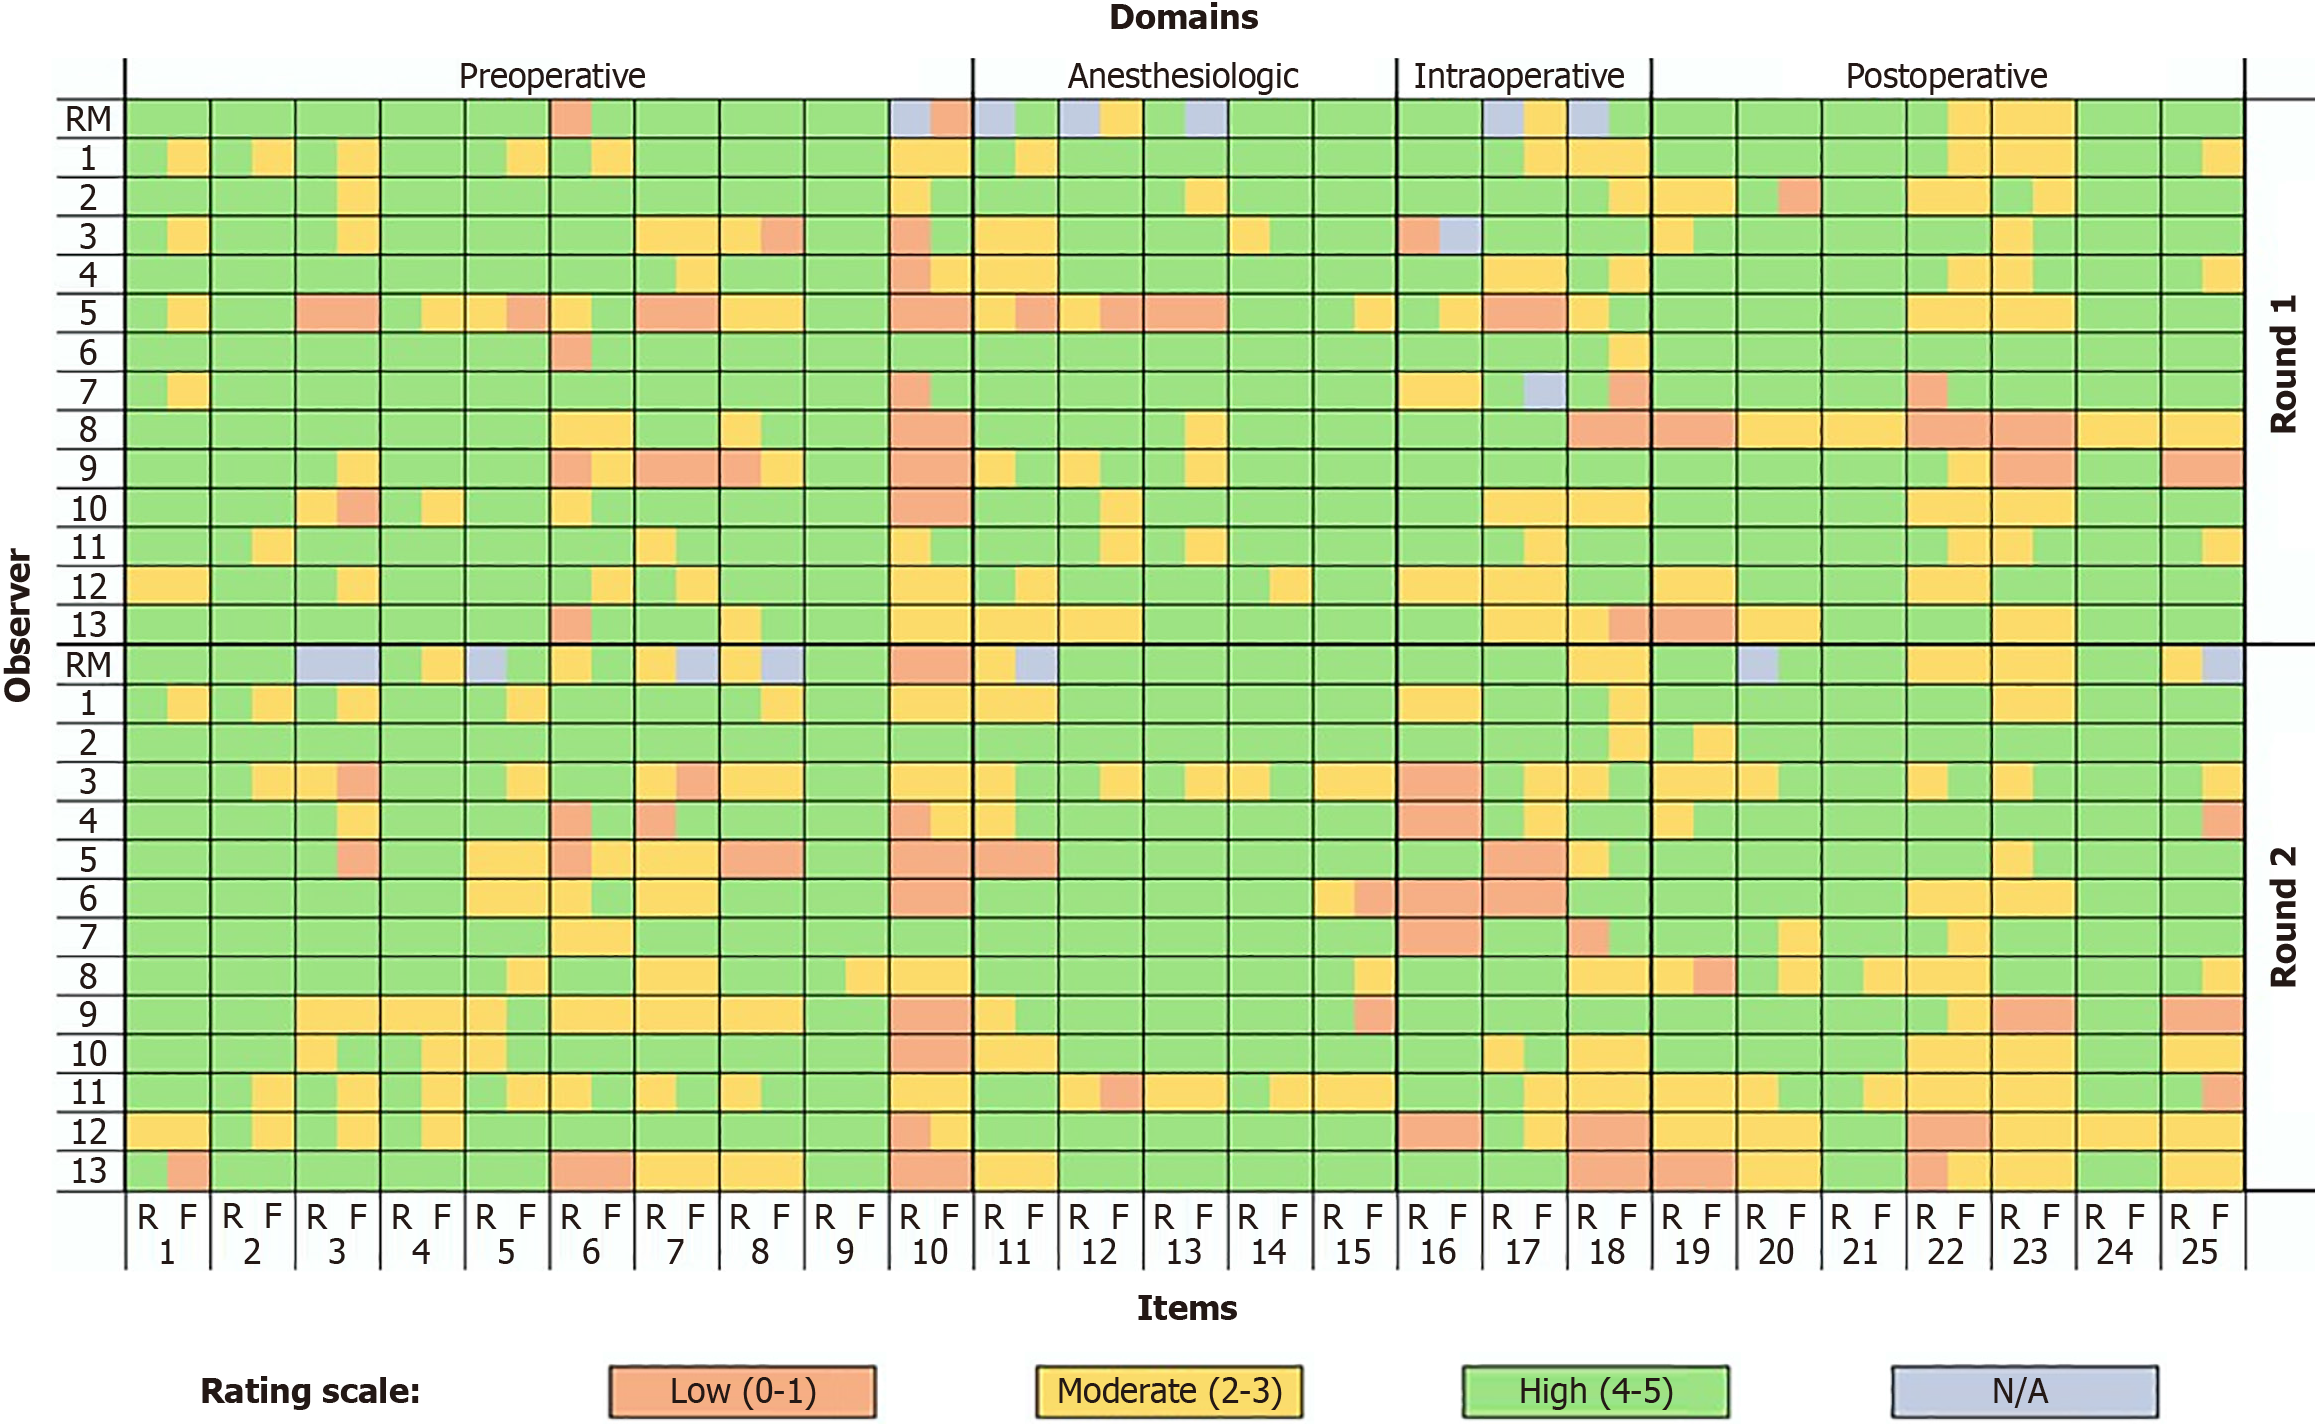
Figure 2 Heatmap representing an overview on response to the survey.
On the vertical axis, the different observer over the two rounds of the survey; on the horizontal axis, the items proposed (R, relevance; F, feasibility). Color scale: Red, rating Low (score 0-1); yellow, rating Moderate (score 2-3); green, rating High (score 4-5); grey, Not Available (bimodal distribution in reference modal value; no rating given in observer axis).
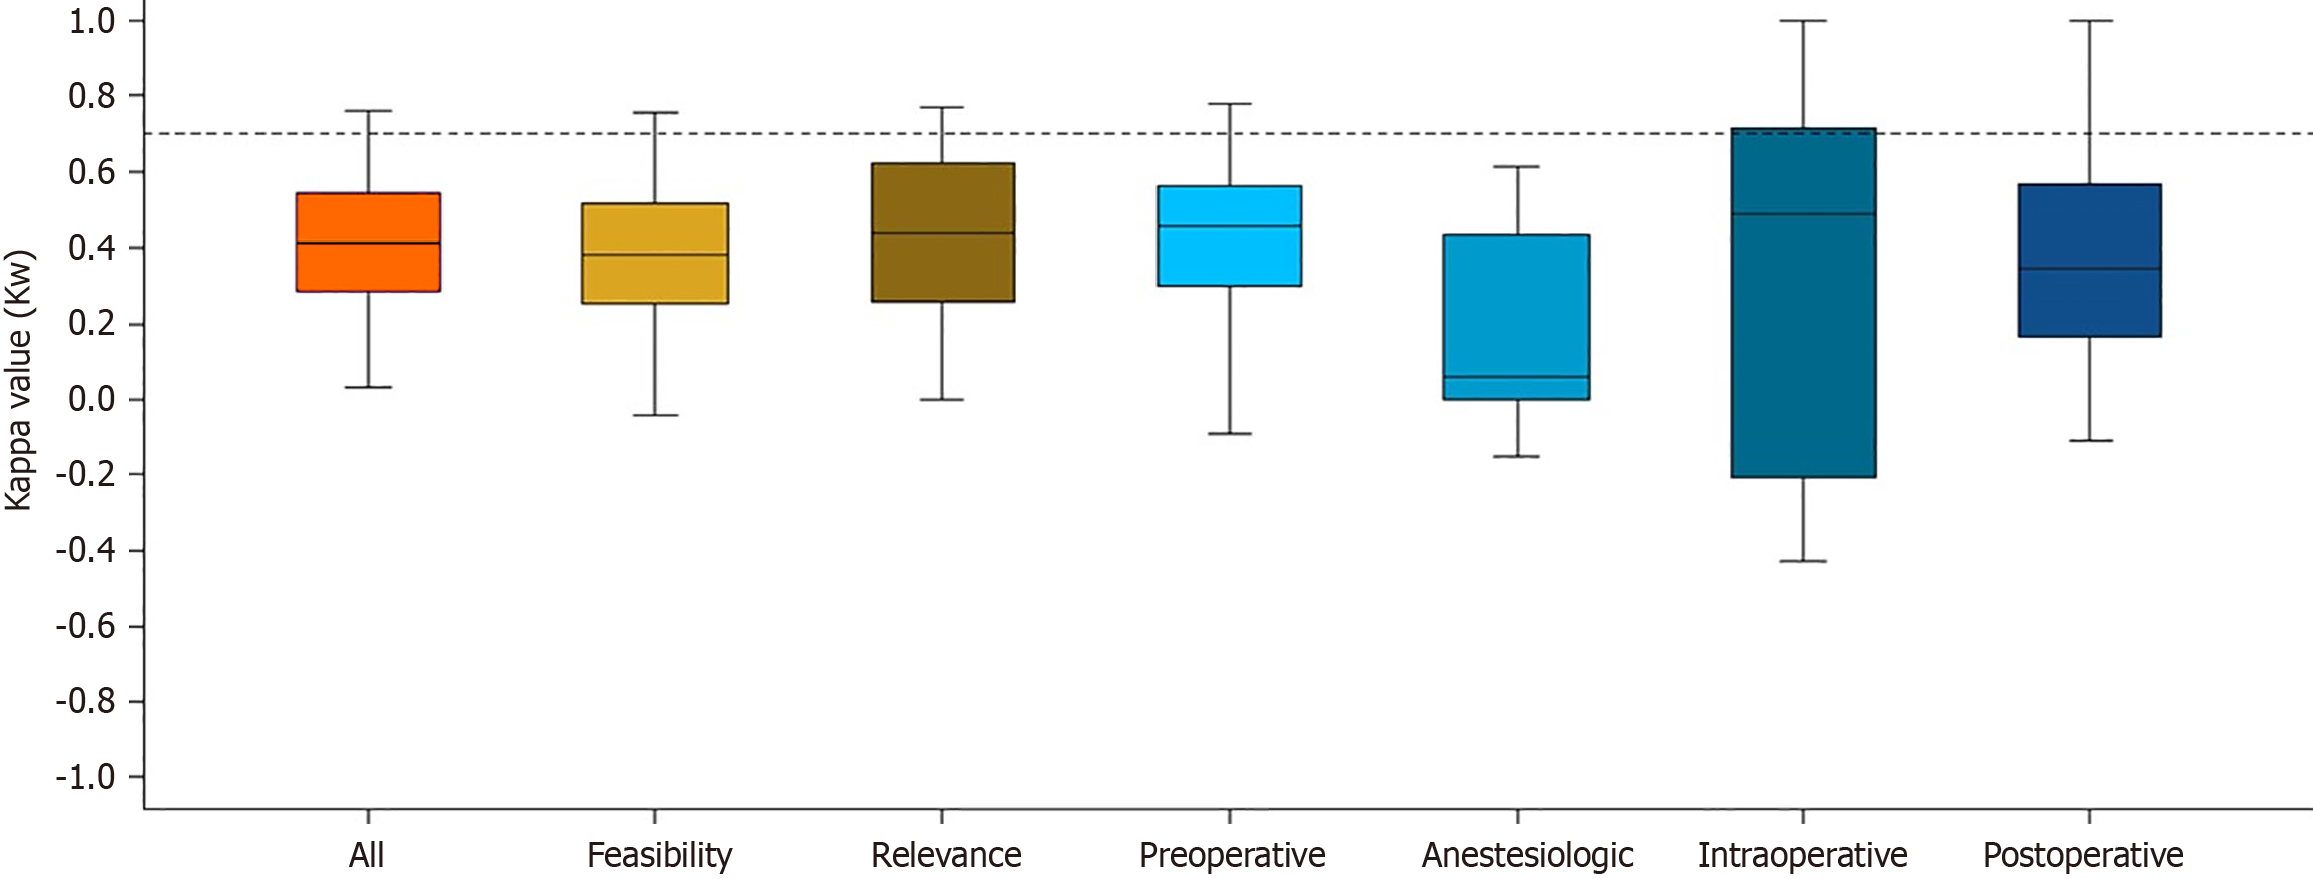
Figure 3 Distribution of the intra-observer reproducibility over the whole survey, considering feasibility and relevance, respectively, and according to the four different domains (preoperative, anesthesiology, intraoperative, and postoperative).
Each box indicates the 25th and 75th percentiles. The horizontal line in the box indicates the median, and the whiskers indicate the extremes. The dotted line indicates the weighted kappa value of 0.70- i.e., a “quite satisfactory” level of reproducibility.
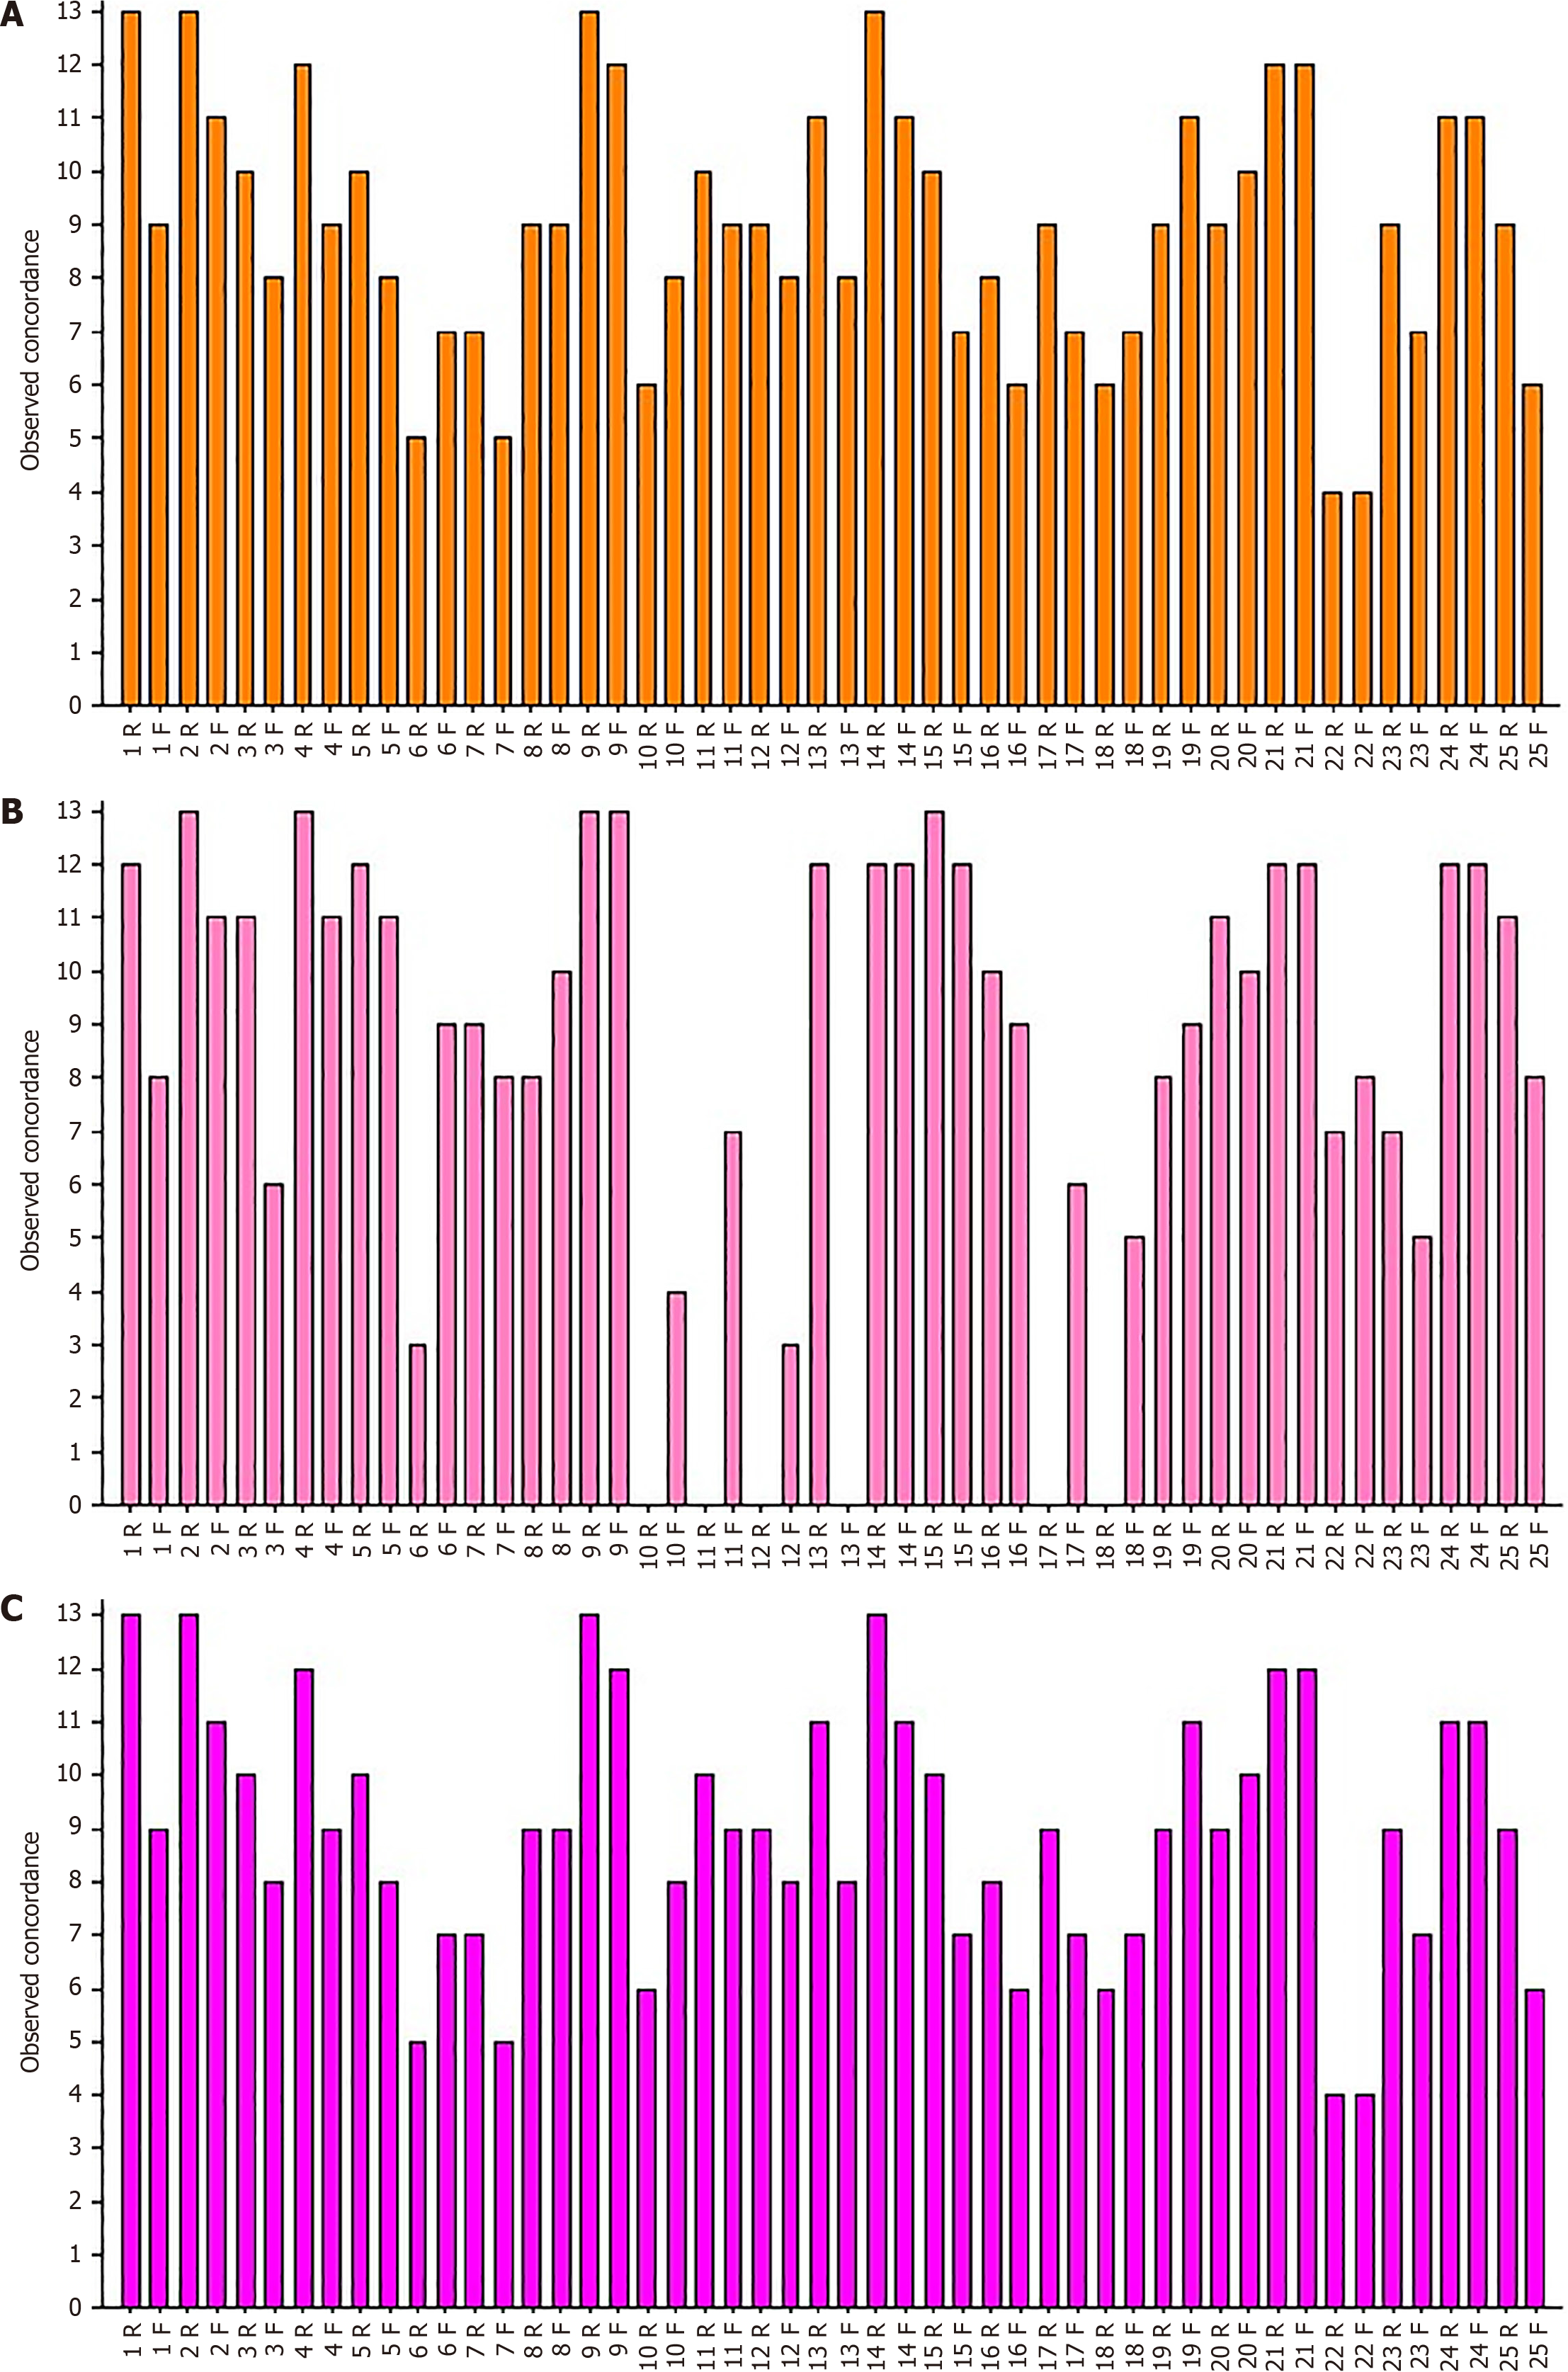
Figure 4 Item-level bar plot.
Each bar reports the observed concordance in terms of absolute frequency. The higher is the bar, the stronger is the observed agreement. A: Intra-observer concordance evaluation between the first and second round; B: Concordance evaluation vs reference in the first round; C: Concordance evaluation vs reference in the second round.
- Citation: Improta L, Ciniselli CM, Verderio P, Pasquali S, Fiore M, Valeri S. Surgeons’ opinions about enhanced recovery after surgery for retroperitoneal sarcoma: A survey. World J Clin Oncol 2025; 16(10): 108419
- URL: https://www.wjgnet.com/2218-4333/full/v16/i10/108419.htm
- DOI: https://dx.doi.org/10.5306/wjco.v16.i10.108419


