Copyright
©The Author(s) 2024.
World J Clin Oncol. Feb 24, 2024; 15(2): 243-270
Published online Feb 24, 2024. doi: 10.5306/wjco.v15.i2.243
Published online Feb 24, 2024. doi: 10.5306/wjco.v15.i2.243
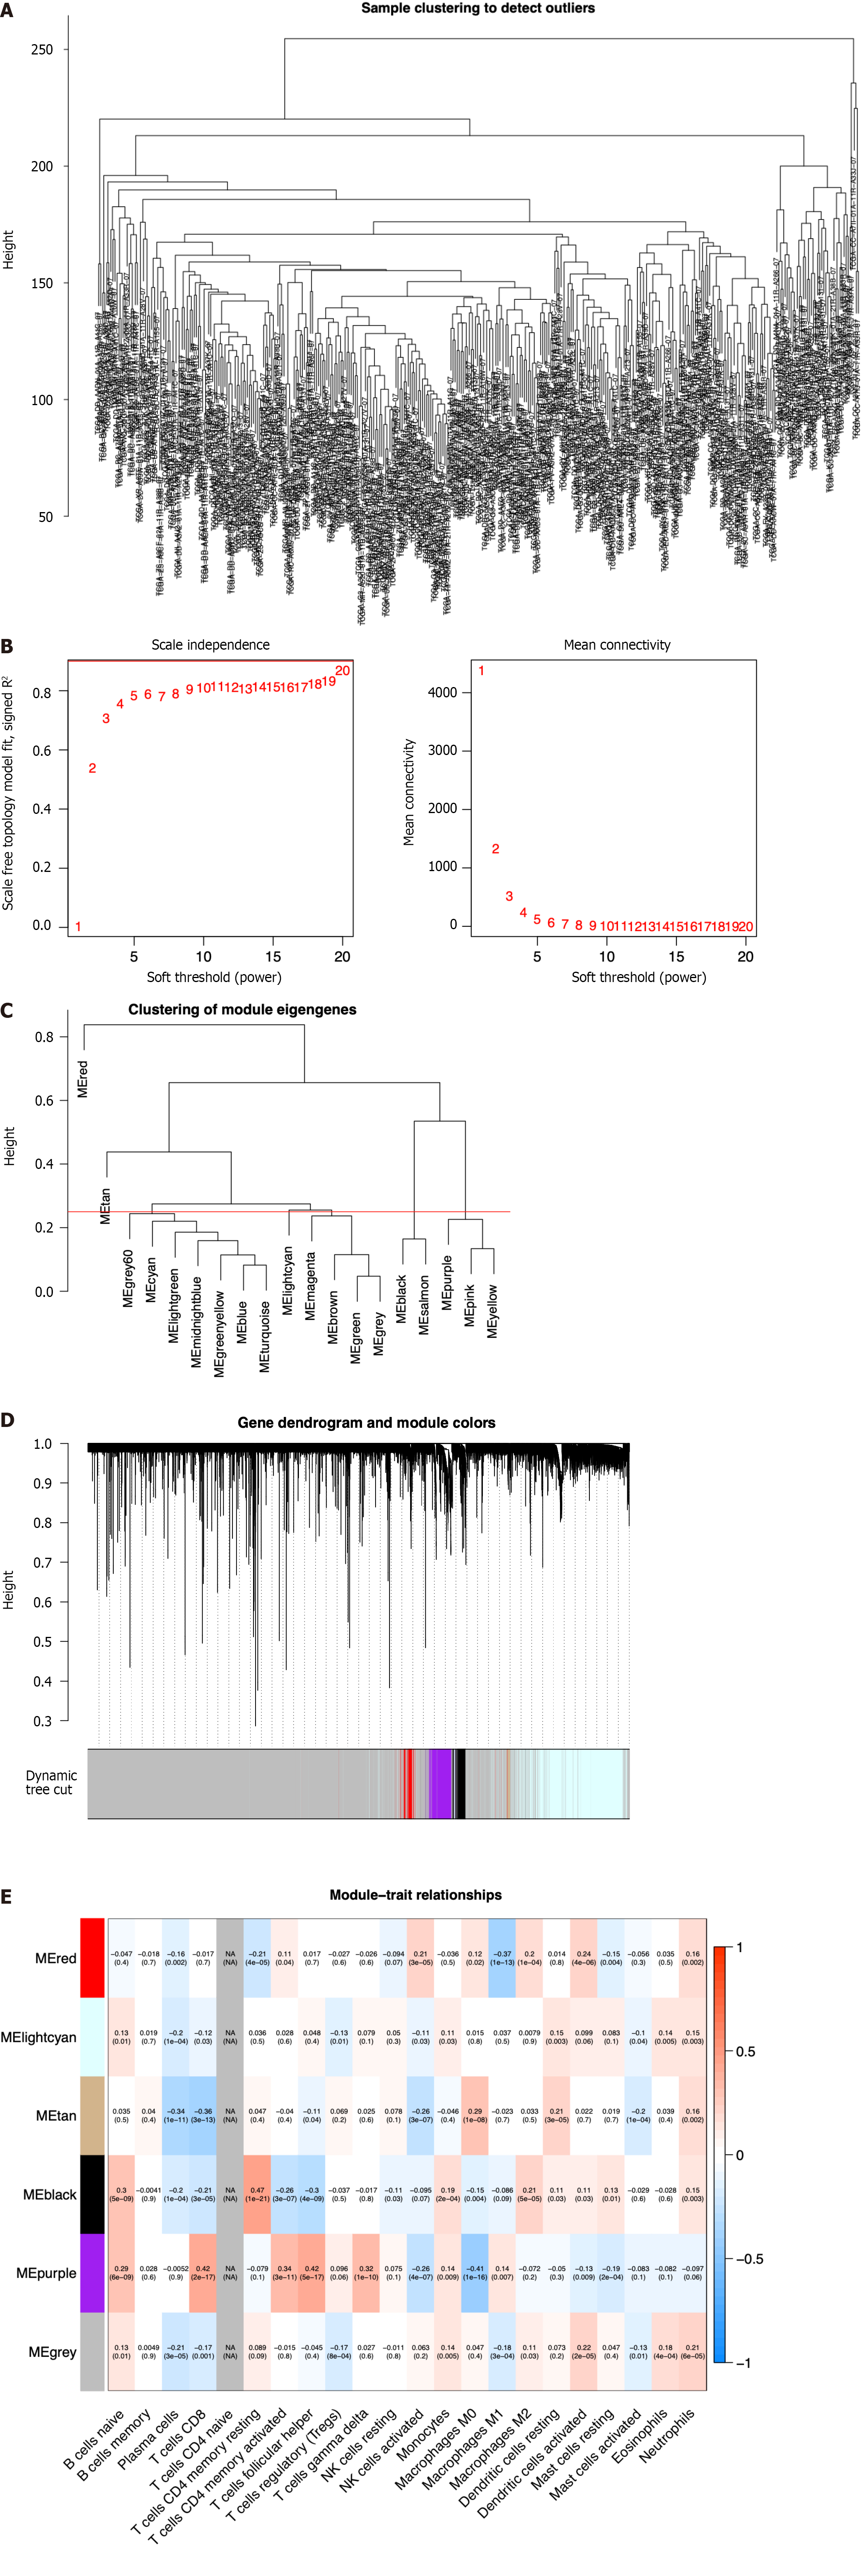
Figure 1 Identification of immune-related differential genes by weighted gene coexpression network analysis in the The Cancer Genome Atlas database.
A: Sample clustering analysis to detect outliers; B: Analysis of the scale-free fit index of the soft threshold power (β); C: The module merge threshold indicated by a horizontal line; D: Hierarchical cluster tree showing the results of modules in weighted gene coexpression network analysis; E: Heatmap analysis showing the associations between the module characteristic genes and immune cell infiltration.
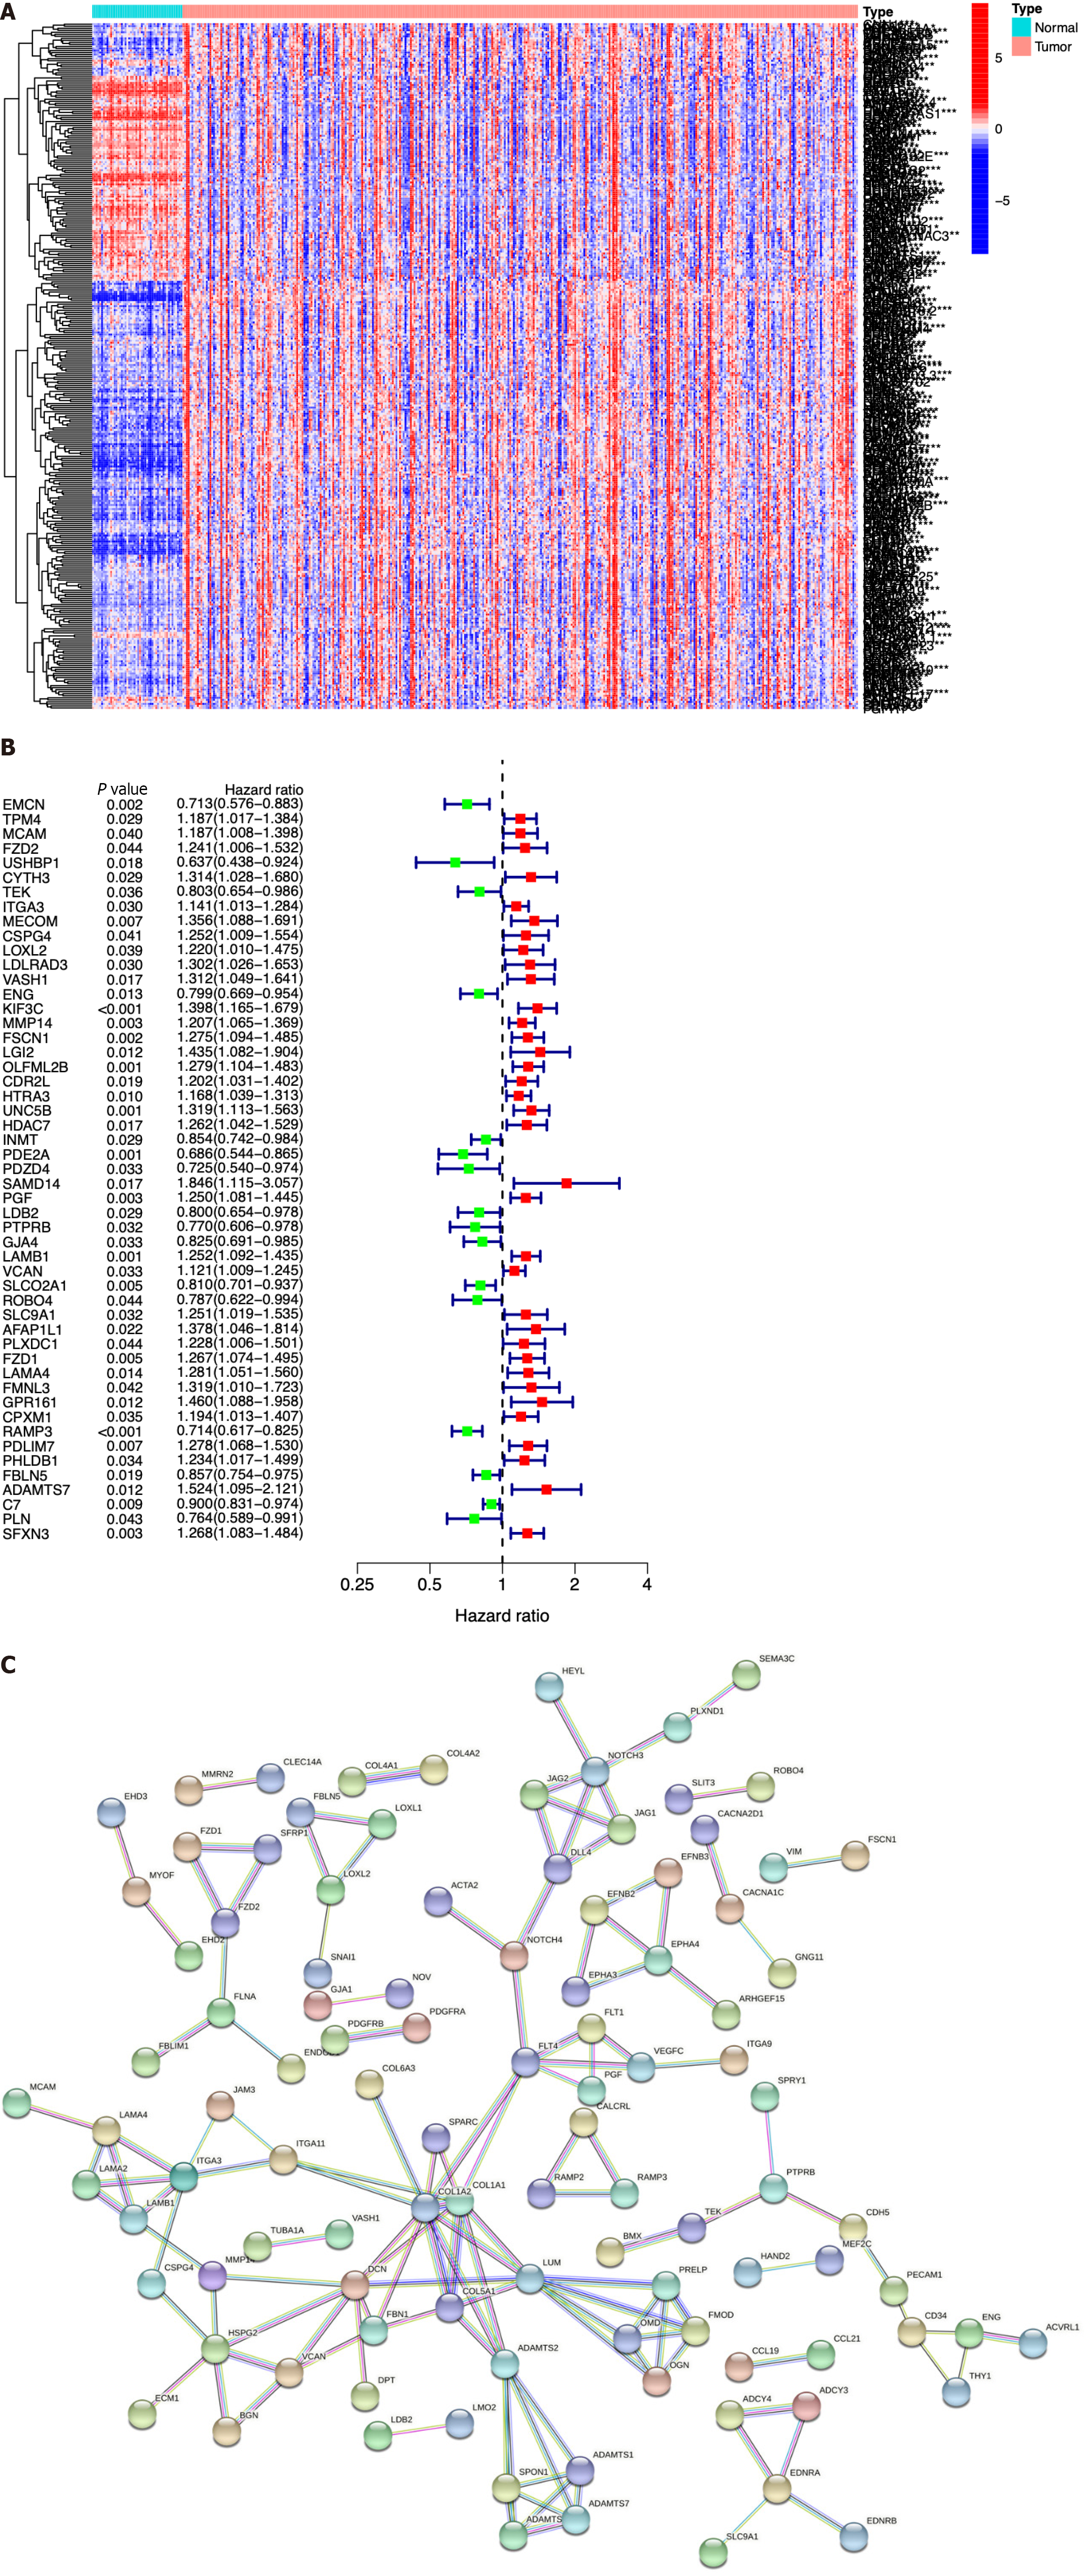
Figure 2 Identification of immune cell-related genes by array screening.
A: Heatmap of the identified immune cell-related genes (ICRGs) between the tumor group and the normal group. Blue: Low expression level; red: High expression level; B: Protein-protein interaction network of the genes (cutoff = 0.9); C: Univariate Cox regression analysis of ICRGs.
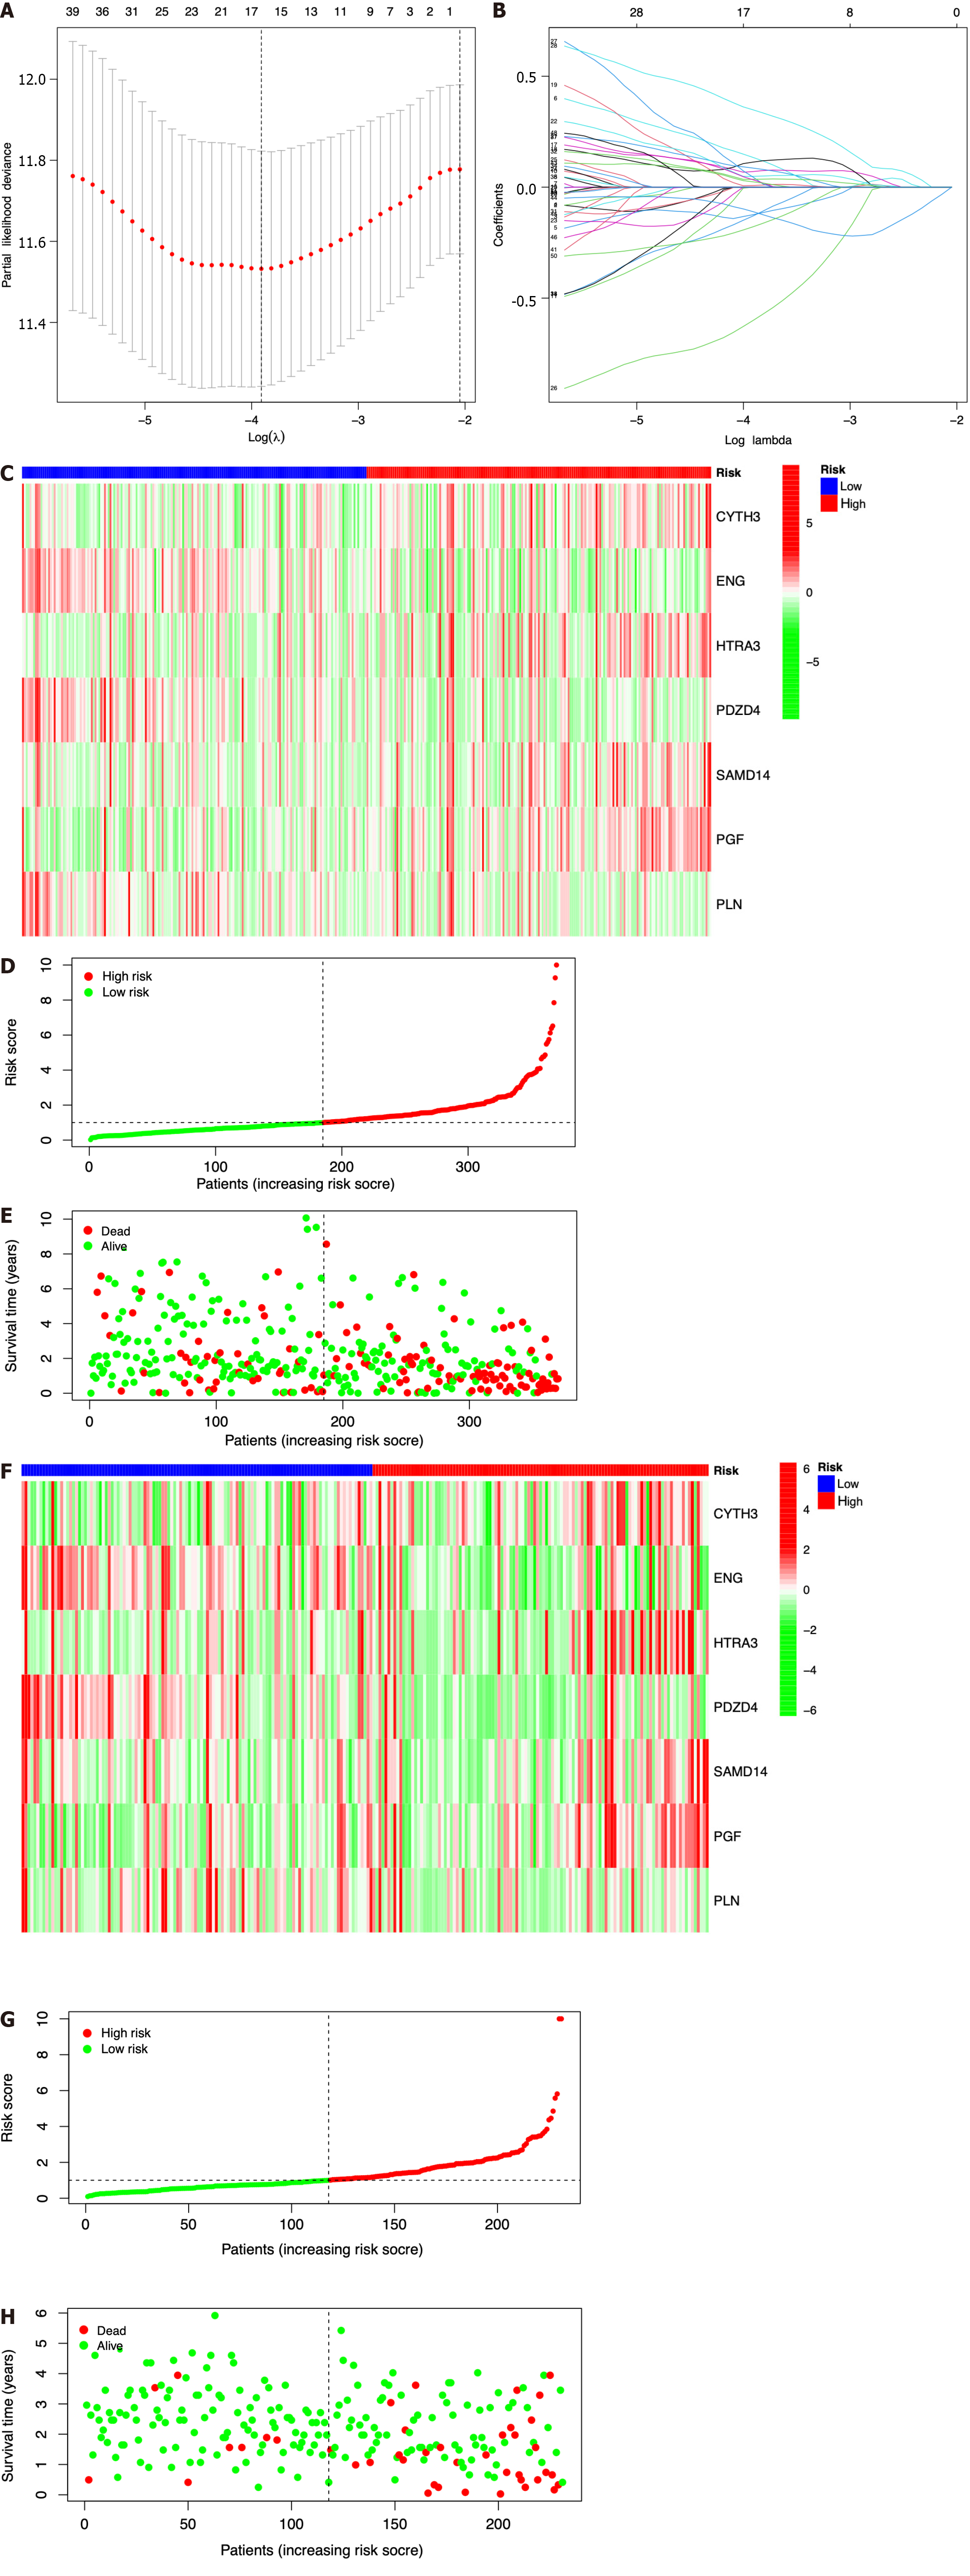
Figure 3 Construction of a prognostic model based on seven identified immune cell-related genes using The Cancer Genome Atlas and International Cancer Genome Consortium datasets.
A: Lasso Cox regression analysis of 51 hub immune cell-related genes (ICRGs) after univariate Cox regression; B: Partial likelihood deviance for different numbers of variables. In The Cancer Genome Atlas (TCGA) dataset, the seven-gene prognostic signature was evaluated; C: Heatmap of related genes; D: Distribution of overall survival (OS) status; E: The median value and distribution of the risk scores. In the International Cancer Genome Consortium dataset, the seven-gene prognostic signature was evaluated; F: Heatmap of related genes; G: Distribution of OS status; H: The median value and distribution of the risk scores.
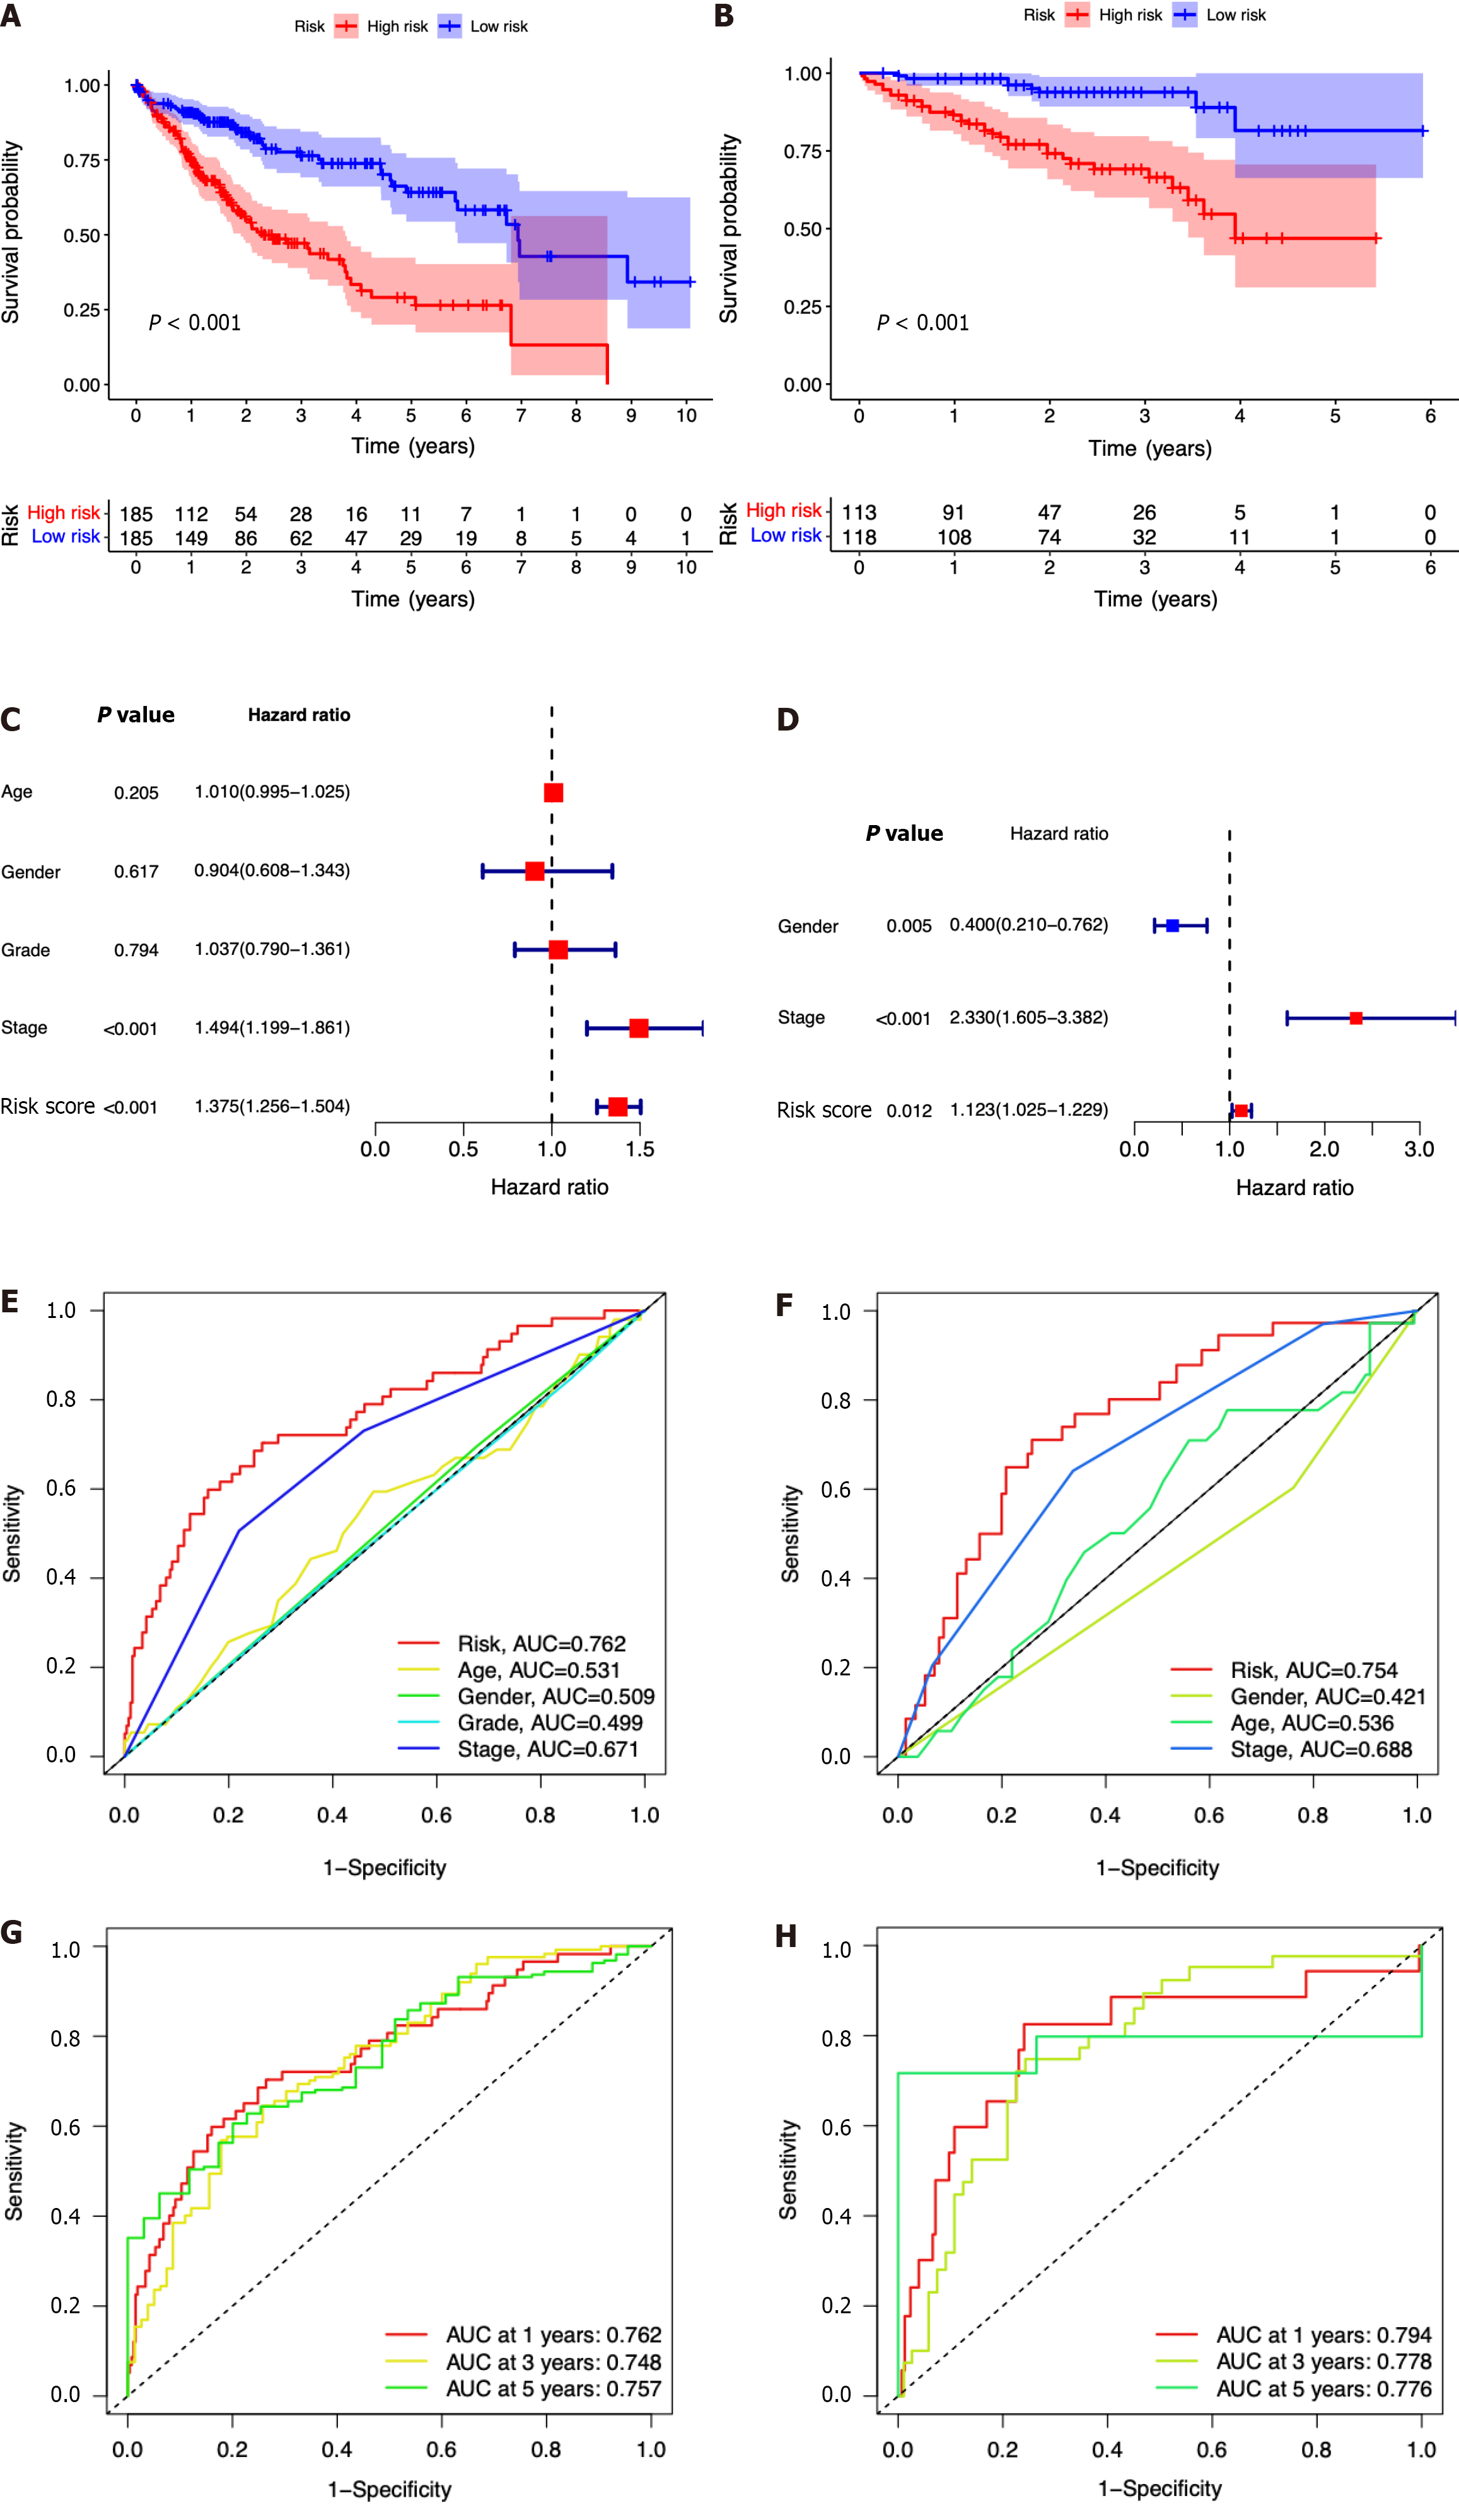
Figure 4 The seven-gene prognostic signature demonstrates high predictive power for overall survival in patients with hepatocellular carcinoma.
A: Kaplan-Meier curves for overall survival (OS) of patients in the high- and low-risk groups in The Cancer Genome Atlas (TCGA) cohort; B: Kaplan-Meier curves for OS of patients in the high- and low-risk groups in the immune cell-related gene (ICRG) cohort; C: Prognosis-related variables screened by multivariate Cox regression were analyzed in the TCGA cohort; D Prognosis-related variables screened by multivariate Cox regression were analyzed in the ICGC cohort; E: Area under the time-dependent ROC curves (AUC) for different clinical features in the TCGA cohort; F: AUC for different clinical features in the ICGC cohort; G: AUC of the prognostic model for survival at different time points in the TCGA cohort ; H: AUC of the prognostic model for survival at different time points in the ICGC cohort.
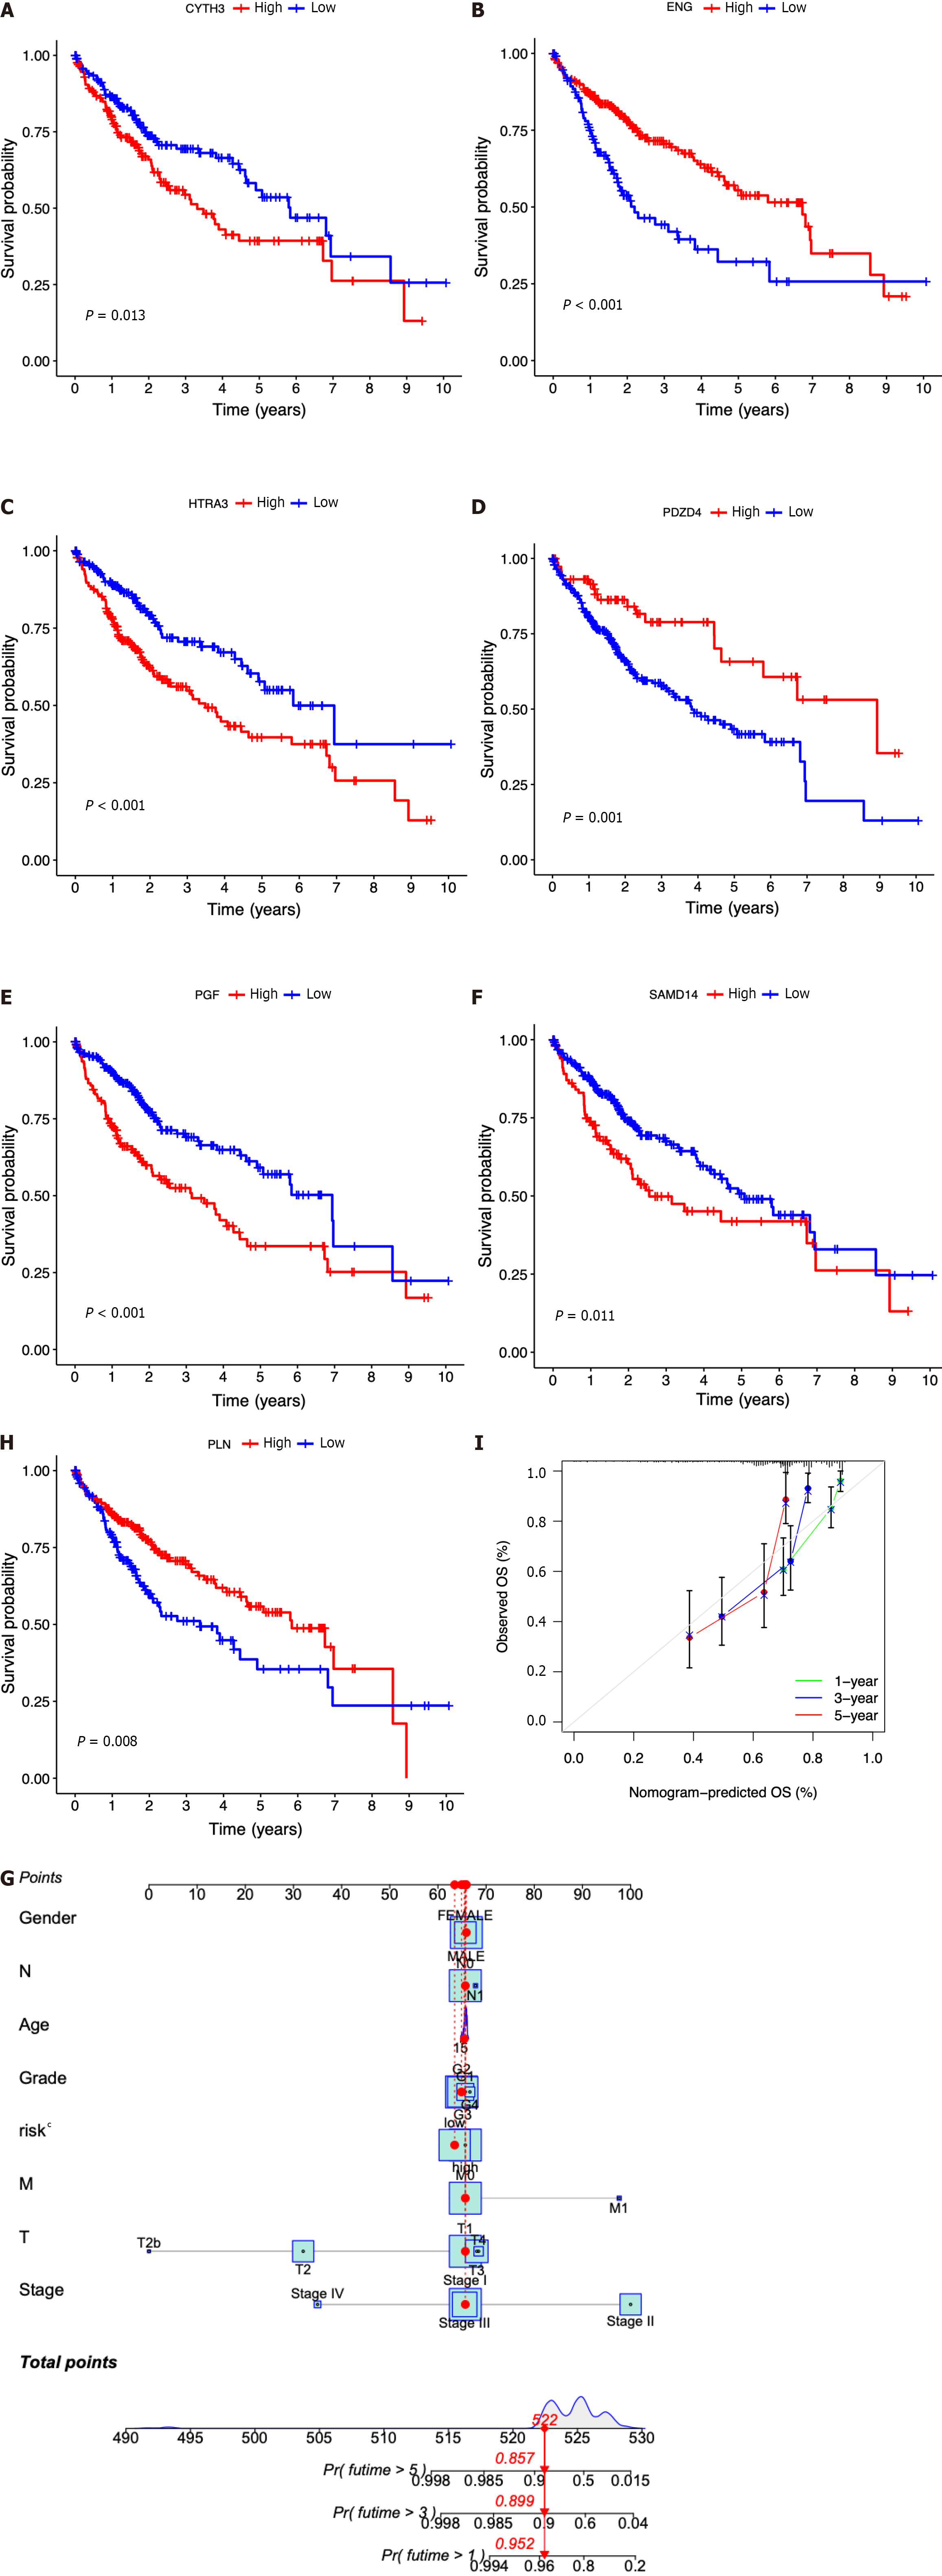
Figure 5 Clinical implications of the seven-ICRG prognostic model.
A-G: Kaplan-Meier analyses for survival by CYTH3 (A), ENG (B), HTRA3 (C), PDZD4 (D), PGF (E), PLN (F), and SAMD14 (G); H: Nomogram for predicting hepatocellular carcinoma patient survival; I: Calibration plots applied for predicting the 1-, 3-, and 5-year overall survival in the The Cancer Genome Atlas cohort.
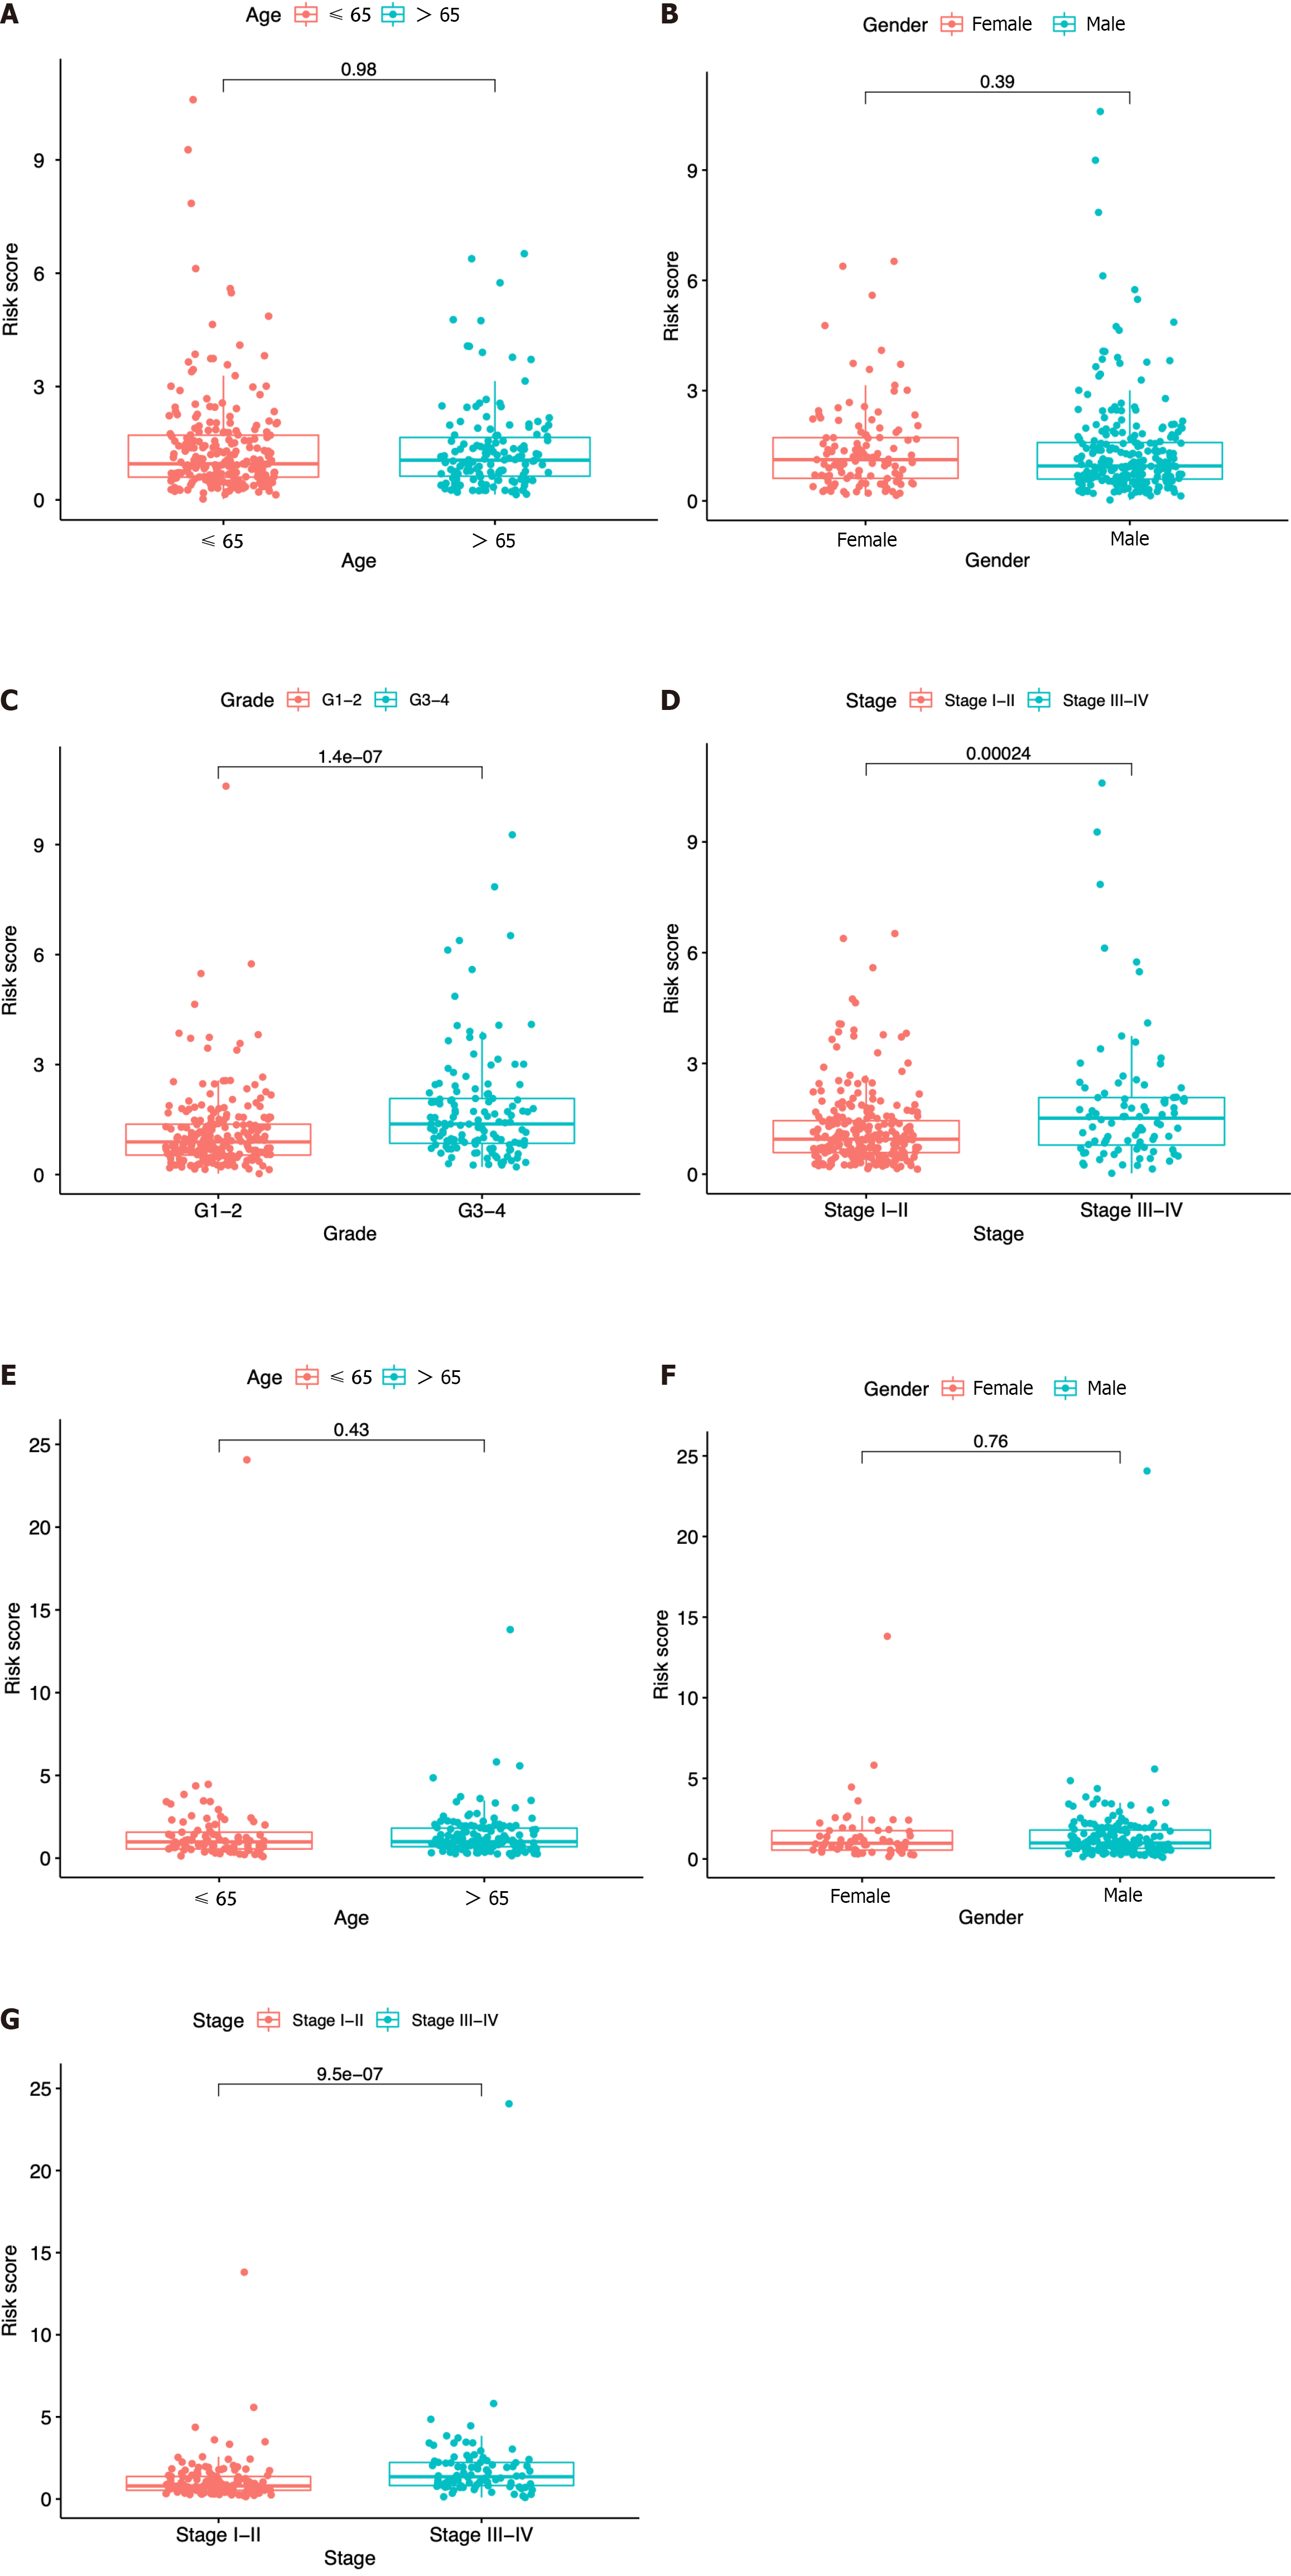
Figure 6 Risk score according to various clinical characteristics.
A-D: Risk score according to age (A), gender (B), tumor grade (C), and tumor stage (D) based on The Cancer Genome Atlas dataset; E-G: Risk score according to age (E), gender (F), and tumor stage (G) based on the immune cell-related gene dataset.
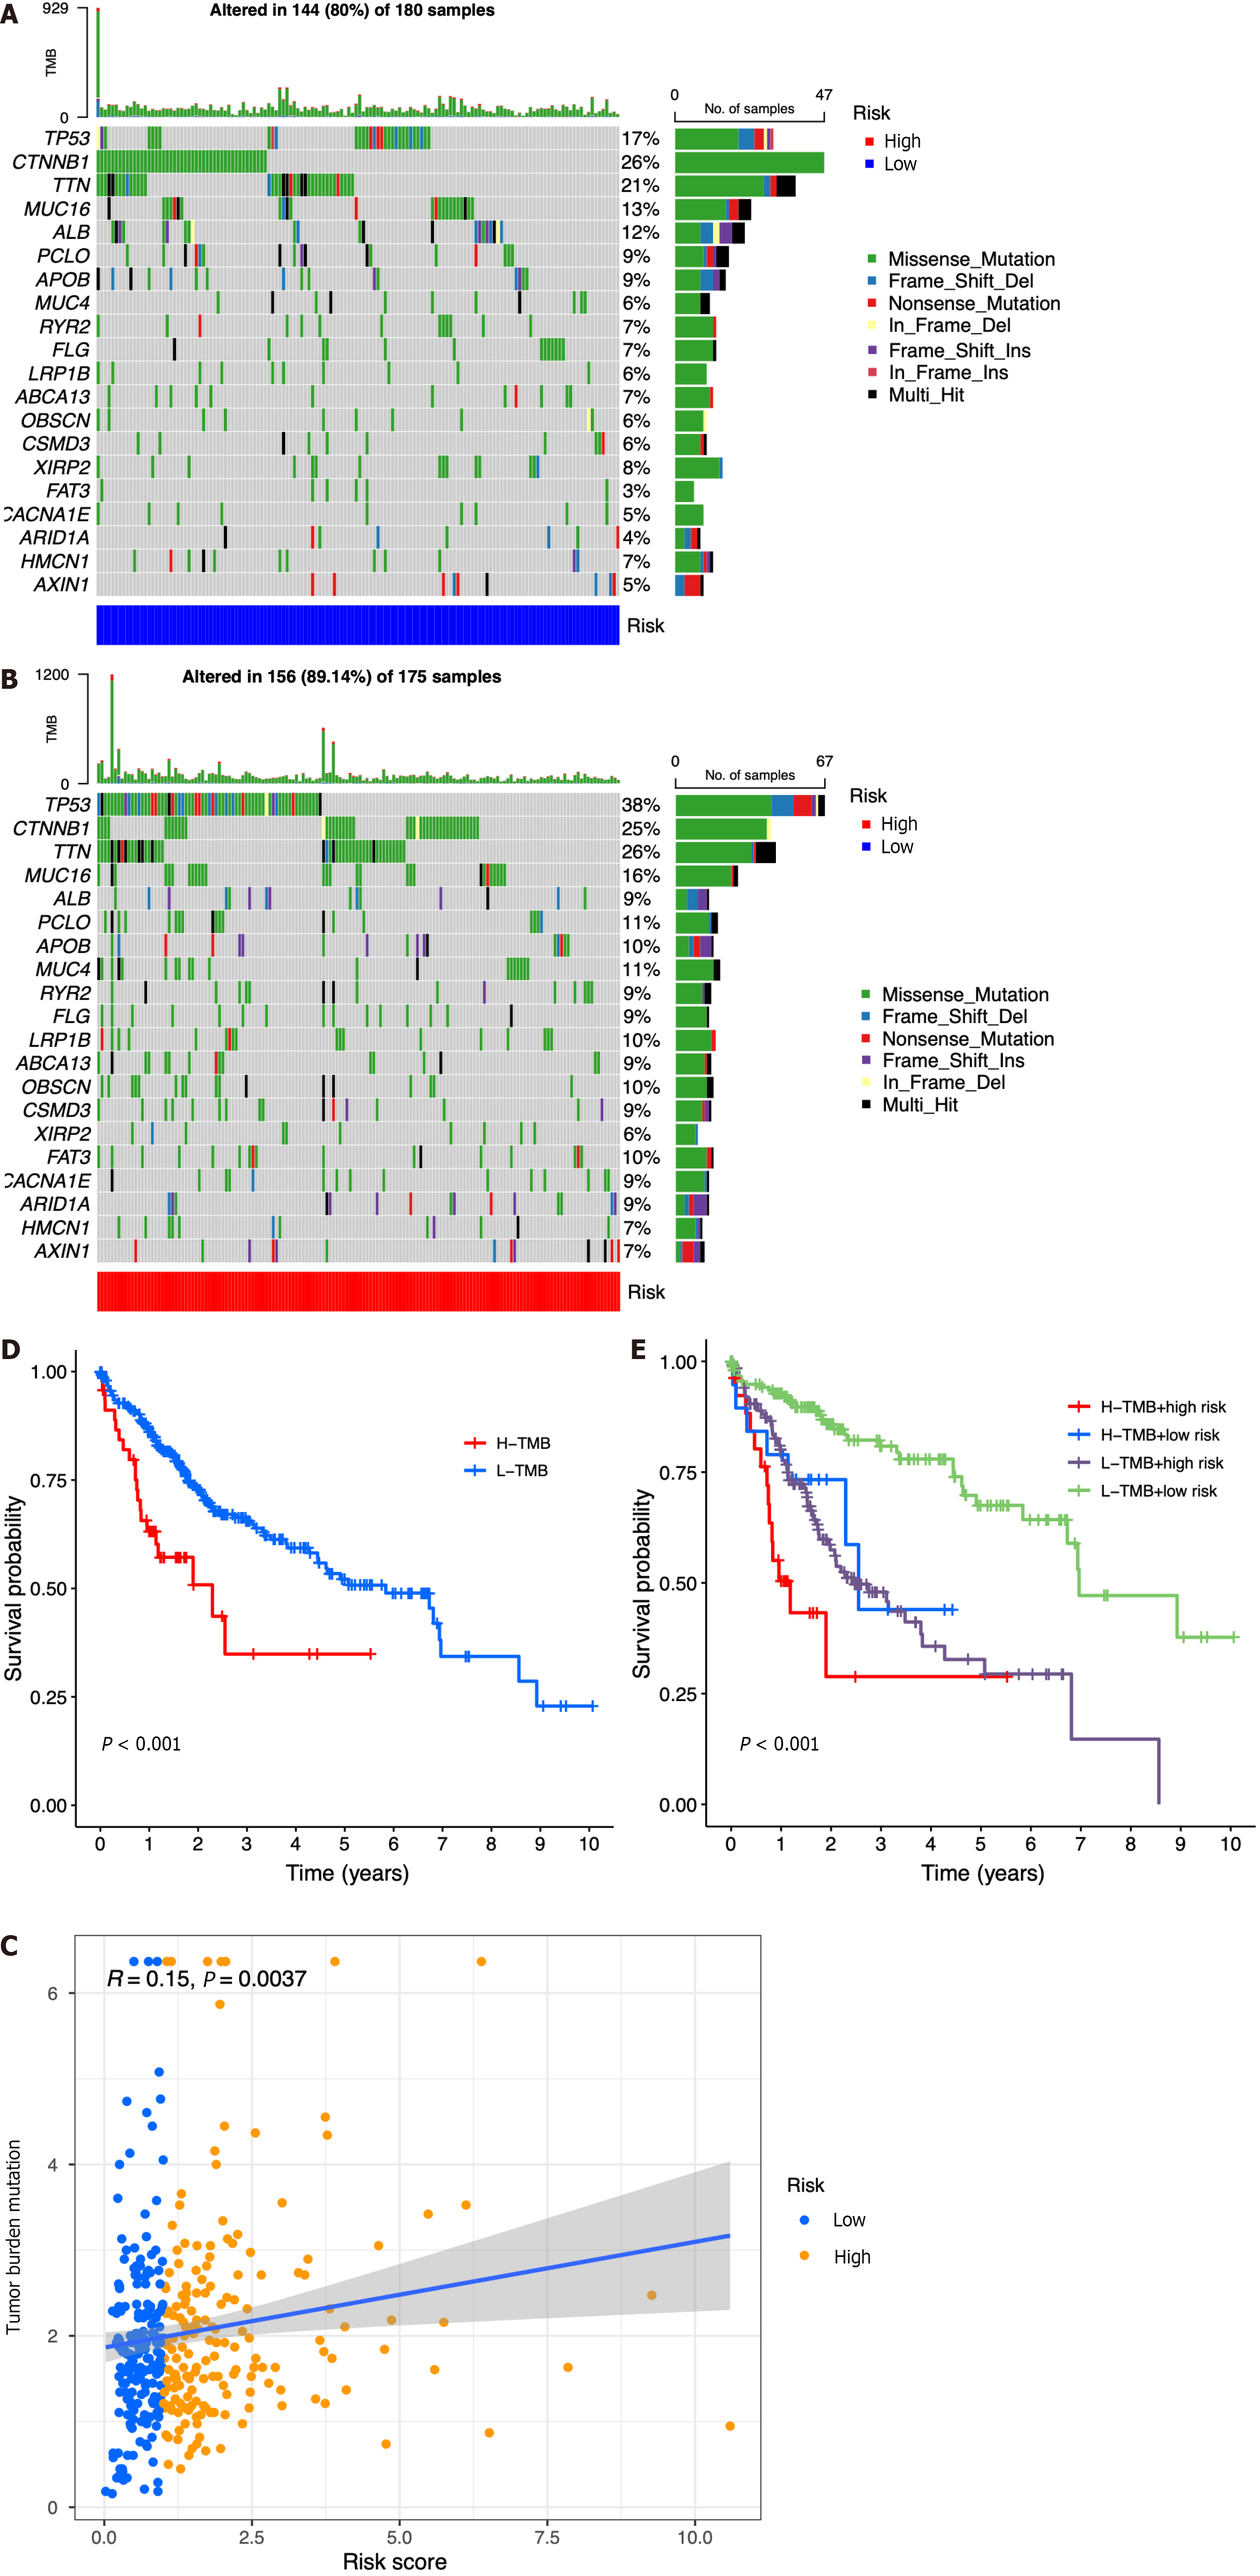
Figure 7 Relationship among the seven-gene prognostic model, genomic features, and tumor mutation burden.
A: List of the most frequently altered genes in the low-risk group; B List of the most frequently altered genes in the high-risk group; C: Scatter plot of the relationship between the risk score and tumor mutation burden (TMB); D: Kaplan-Meier analysis of survival probability for the high- and low-risk groups; E: Kaplan-Meier analysis of survival probability for the high-TMB + high-risk, high-TMB + low-risk, low-TMB + high-risk, and low-TMB + low-risk groups. H-TMB: High-TMB; L-TMB: Low-TMB.
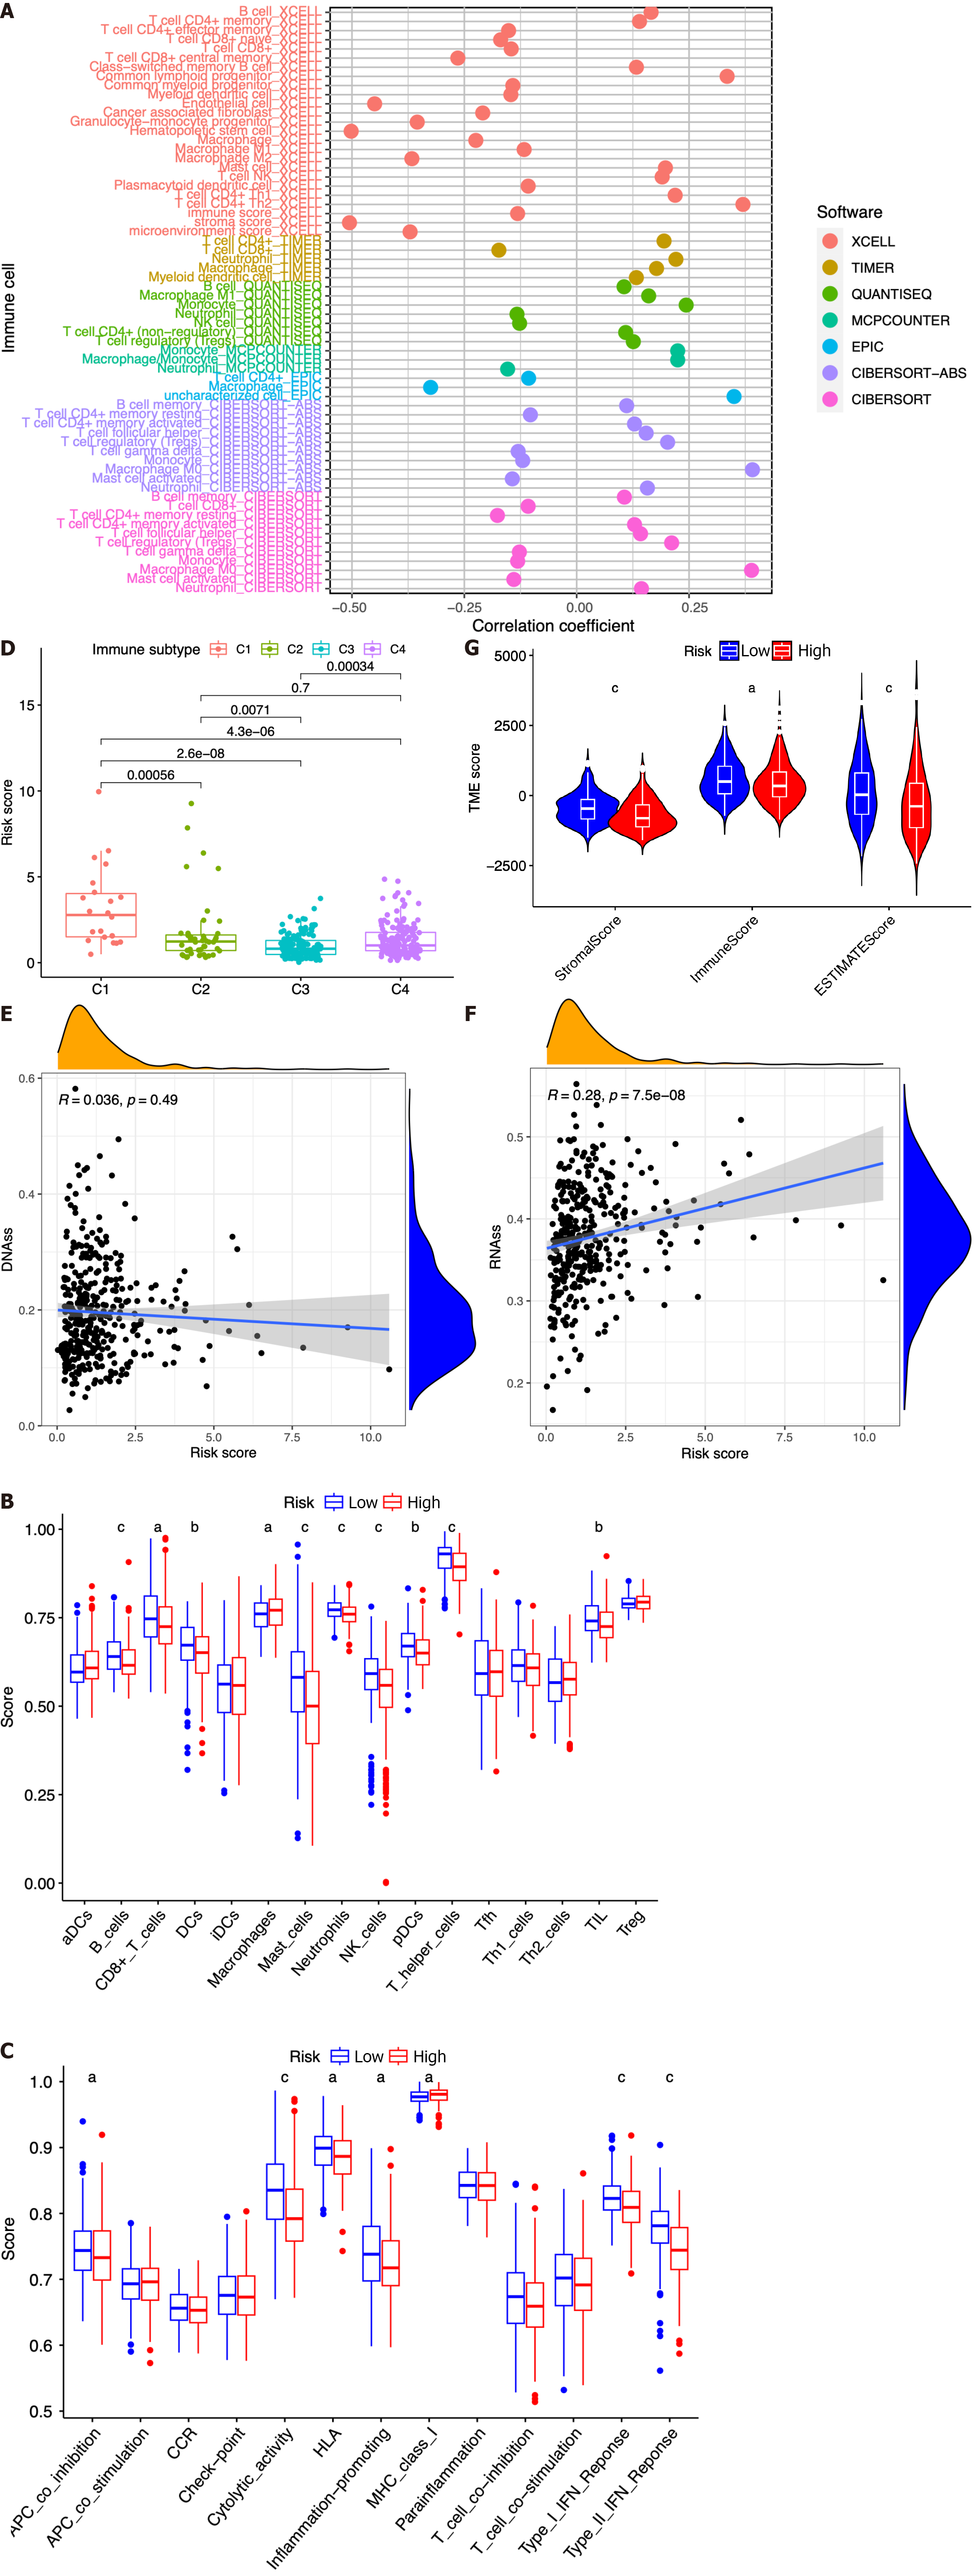
Figure 8 Analysis of tumor microenvironment using the risk model between the high- and low-risk groups based on The Cancer Genome Atlas dataset.
A: Correlation coefficient of immune cells in seven software programs; B: Boxplot showing significant differences among the seven types of immune cells; C: Boxplot showing the scores of 13 immune-related functions; D: Comparison of different immune infiltration subtypes based on different risk scores; E and F: Correlation between the risk score and DNAss (E) and RNAss (F); G: Association of stromal, immune, and estimate scores with the tumor microenvironment score. cP < 0.001, bP < 0.01, aP < 0.05.
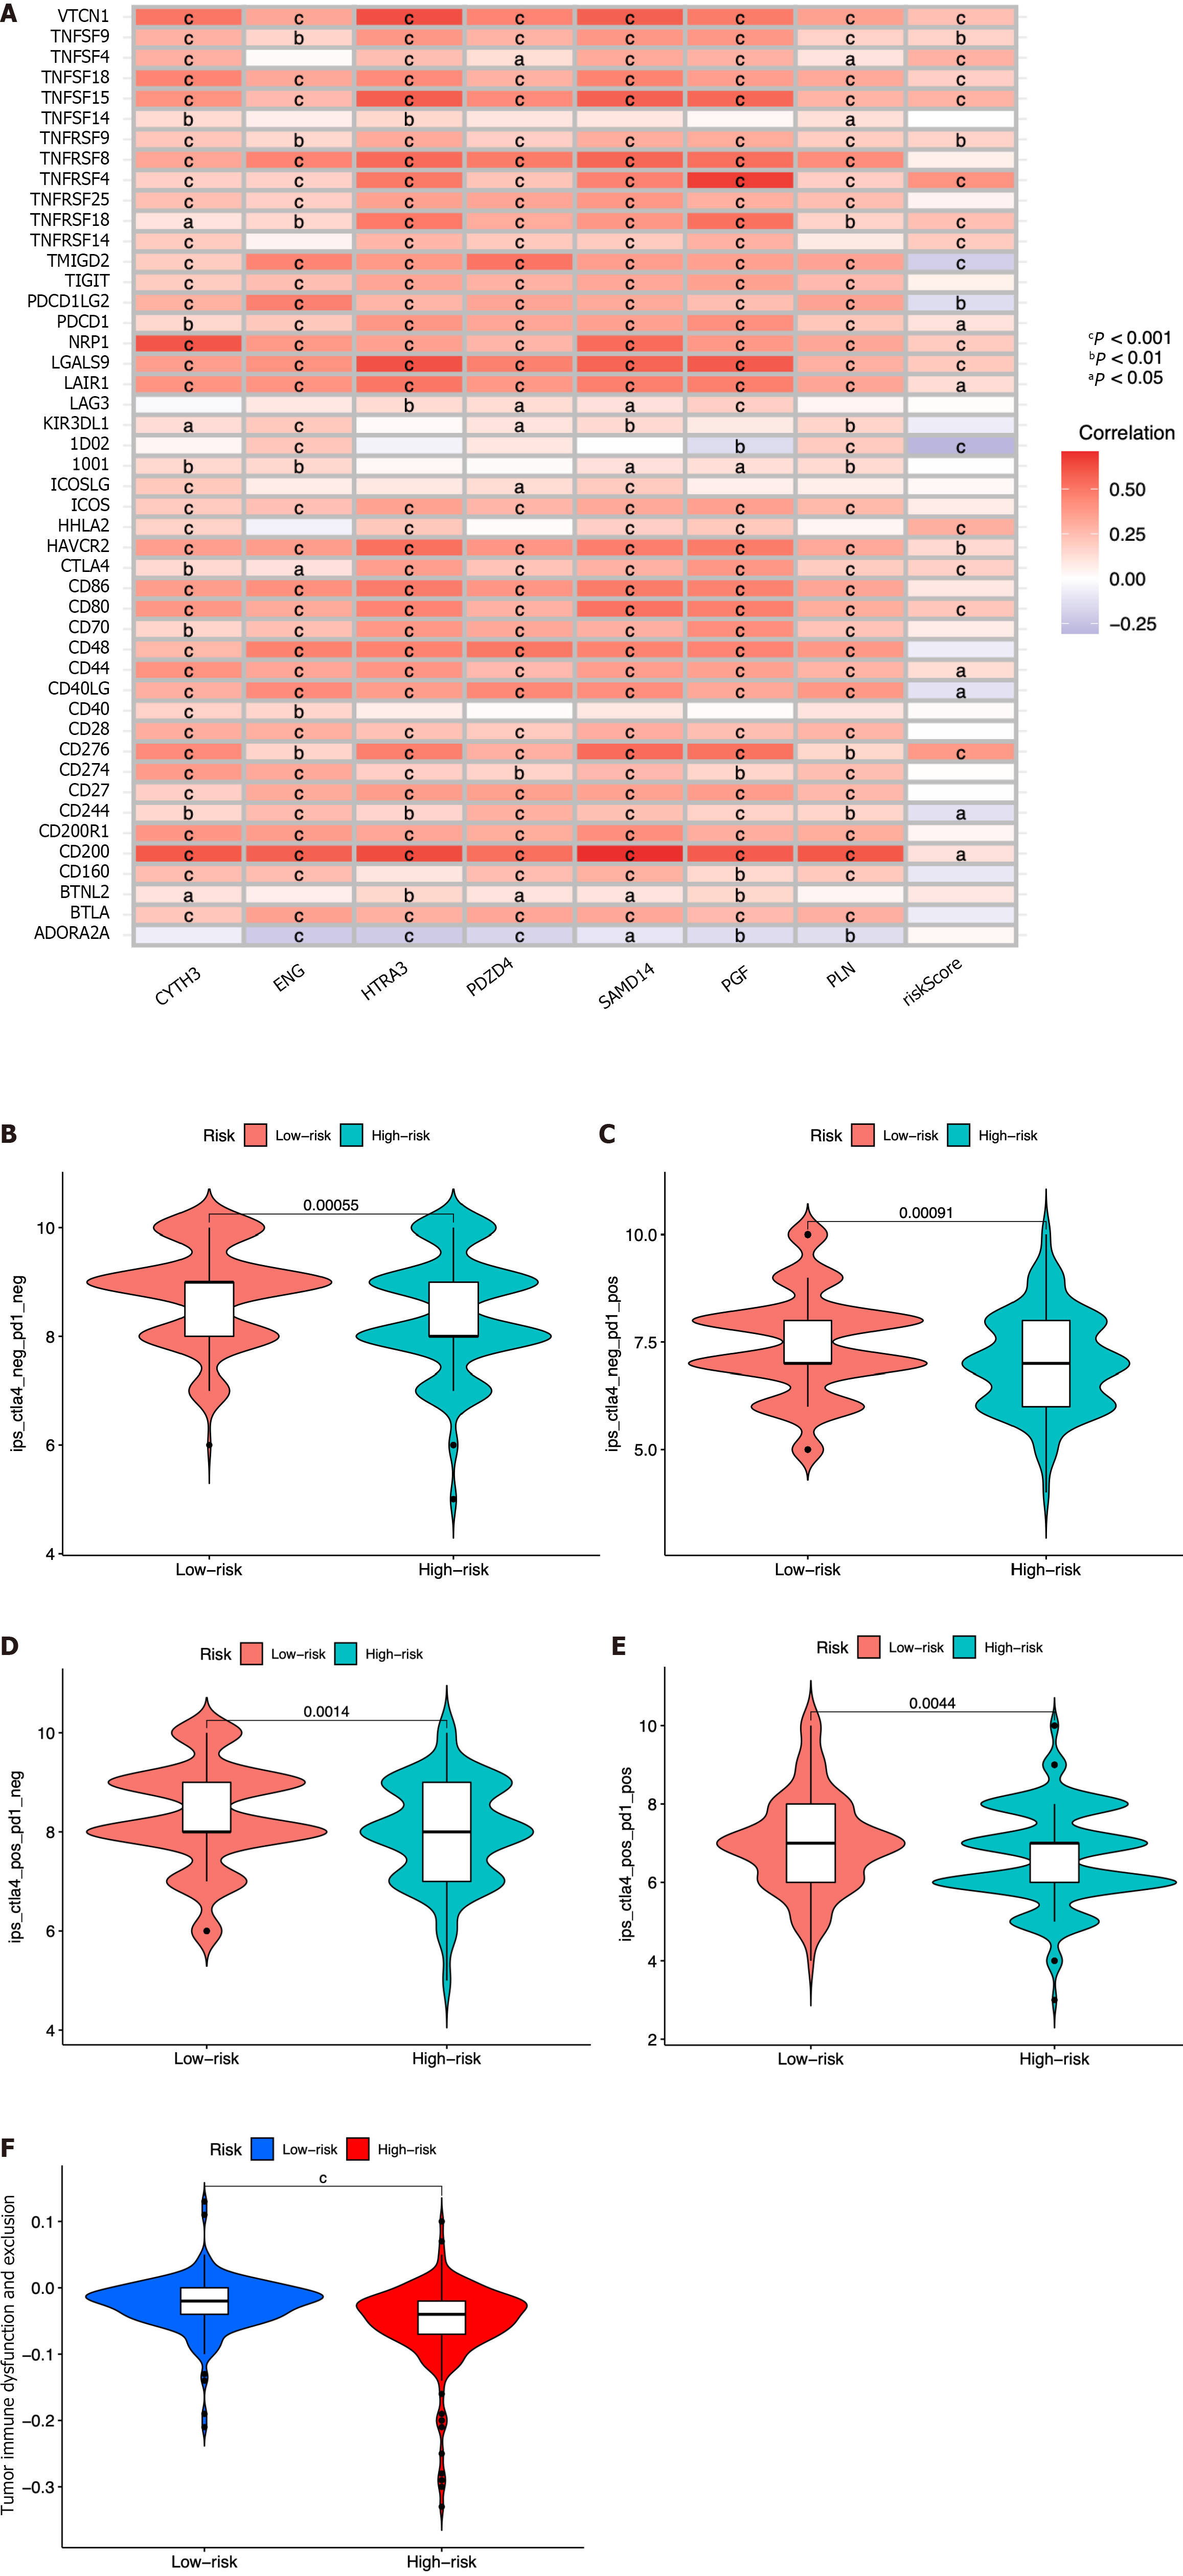
Figure 9 Immune-check point analysis of the seven identified immune cell-related genes and immune checkpoint blockade.
A: Heatmap of association among 47 immune checkpoints, risk score, and the seven identified immune cell-related genes; B-E: Association between the tumor microenvironment and risk score; F: Violin plot showing the relationship of tumor immune dysfunction and risk score between the low- and high-risk groups. cP < 0.001, bP < 0.01, aP < 0.05.
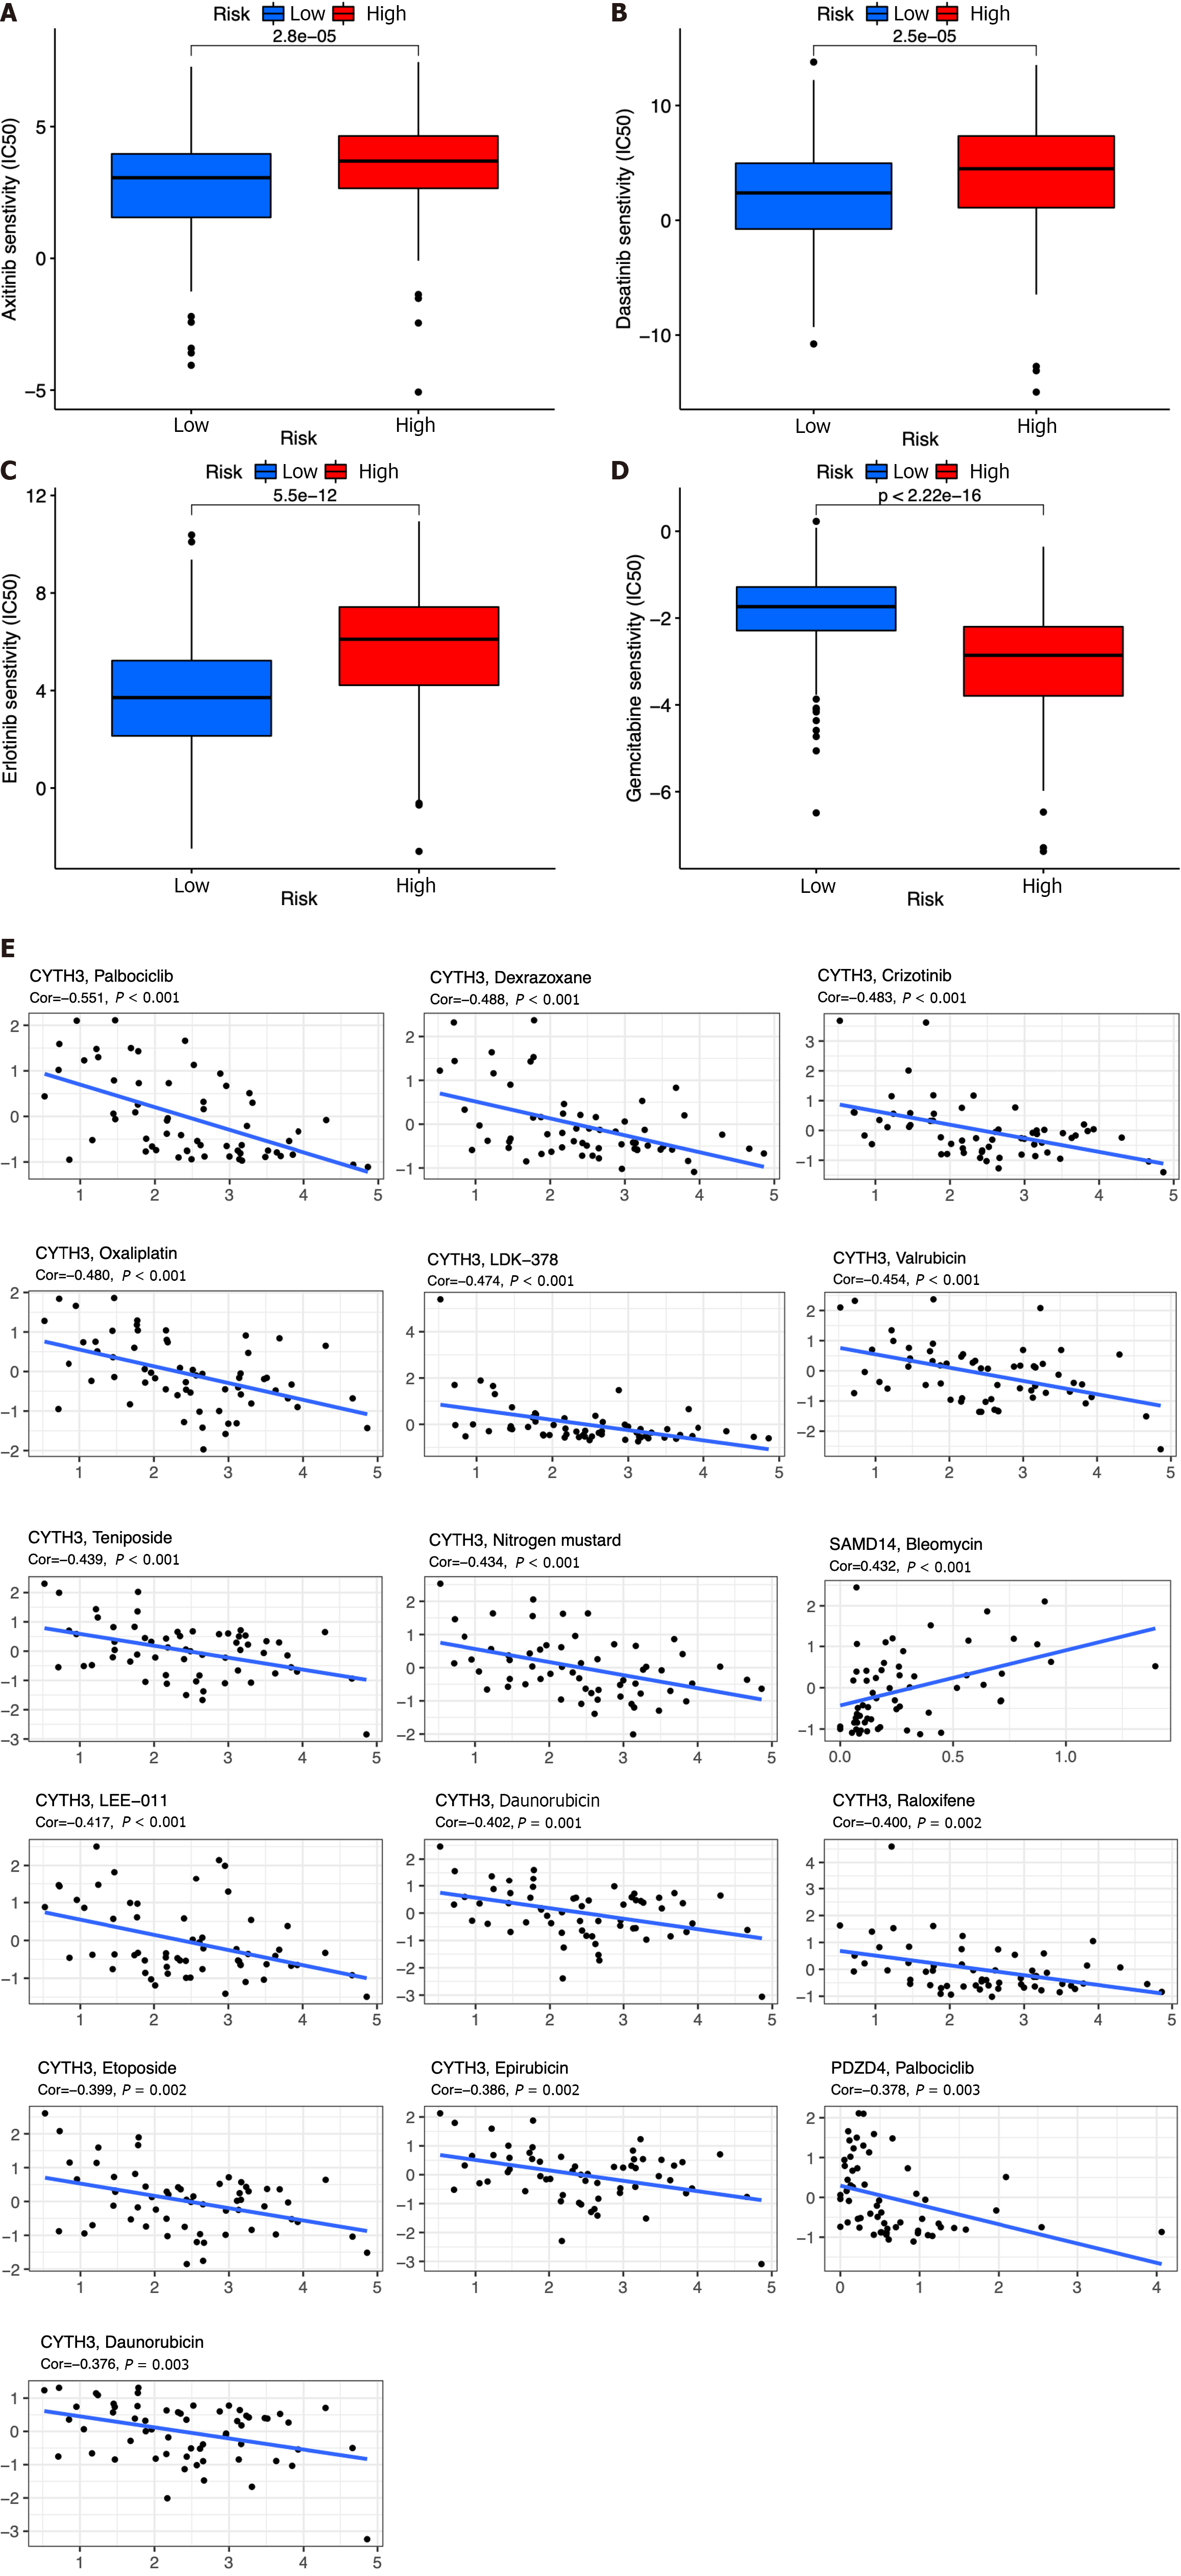
Figure 10 Chemotherapy drug analysis between the high- and low-risk groups in the The Cancer Genome Atlas cohort.
A-D: Different sensitivities to axitinib (A), dasatinib (B), erlotinib (C), and gemcitabine (D) between the high- and low-risk groups; E: Scatter plots of the top 16 correlation analyses between immune cell-related genes and drug sensitivity.
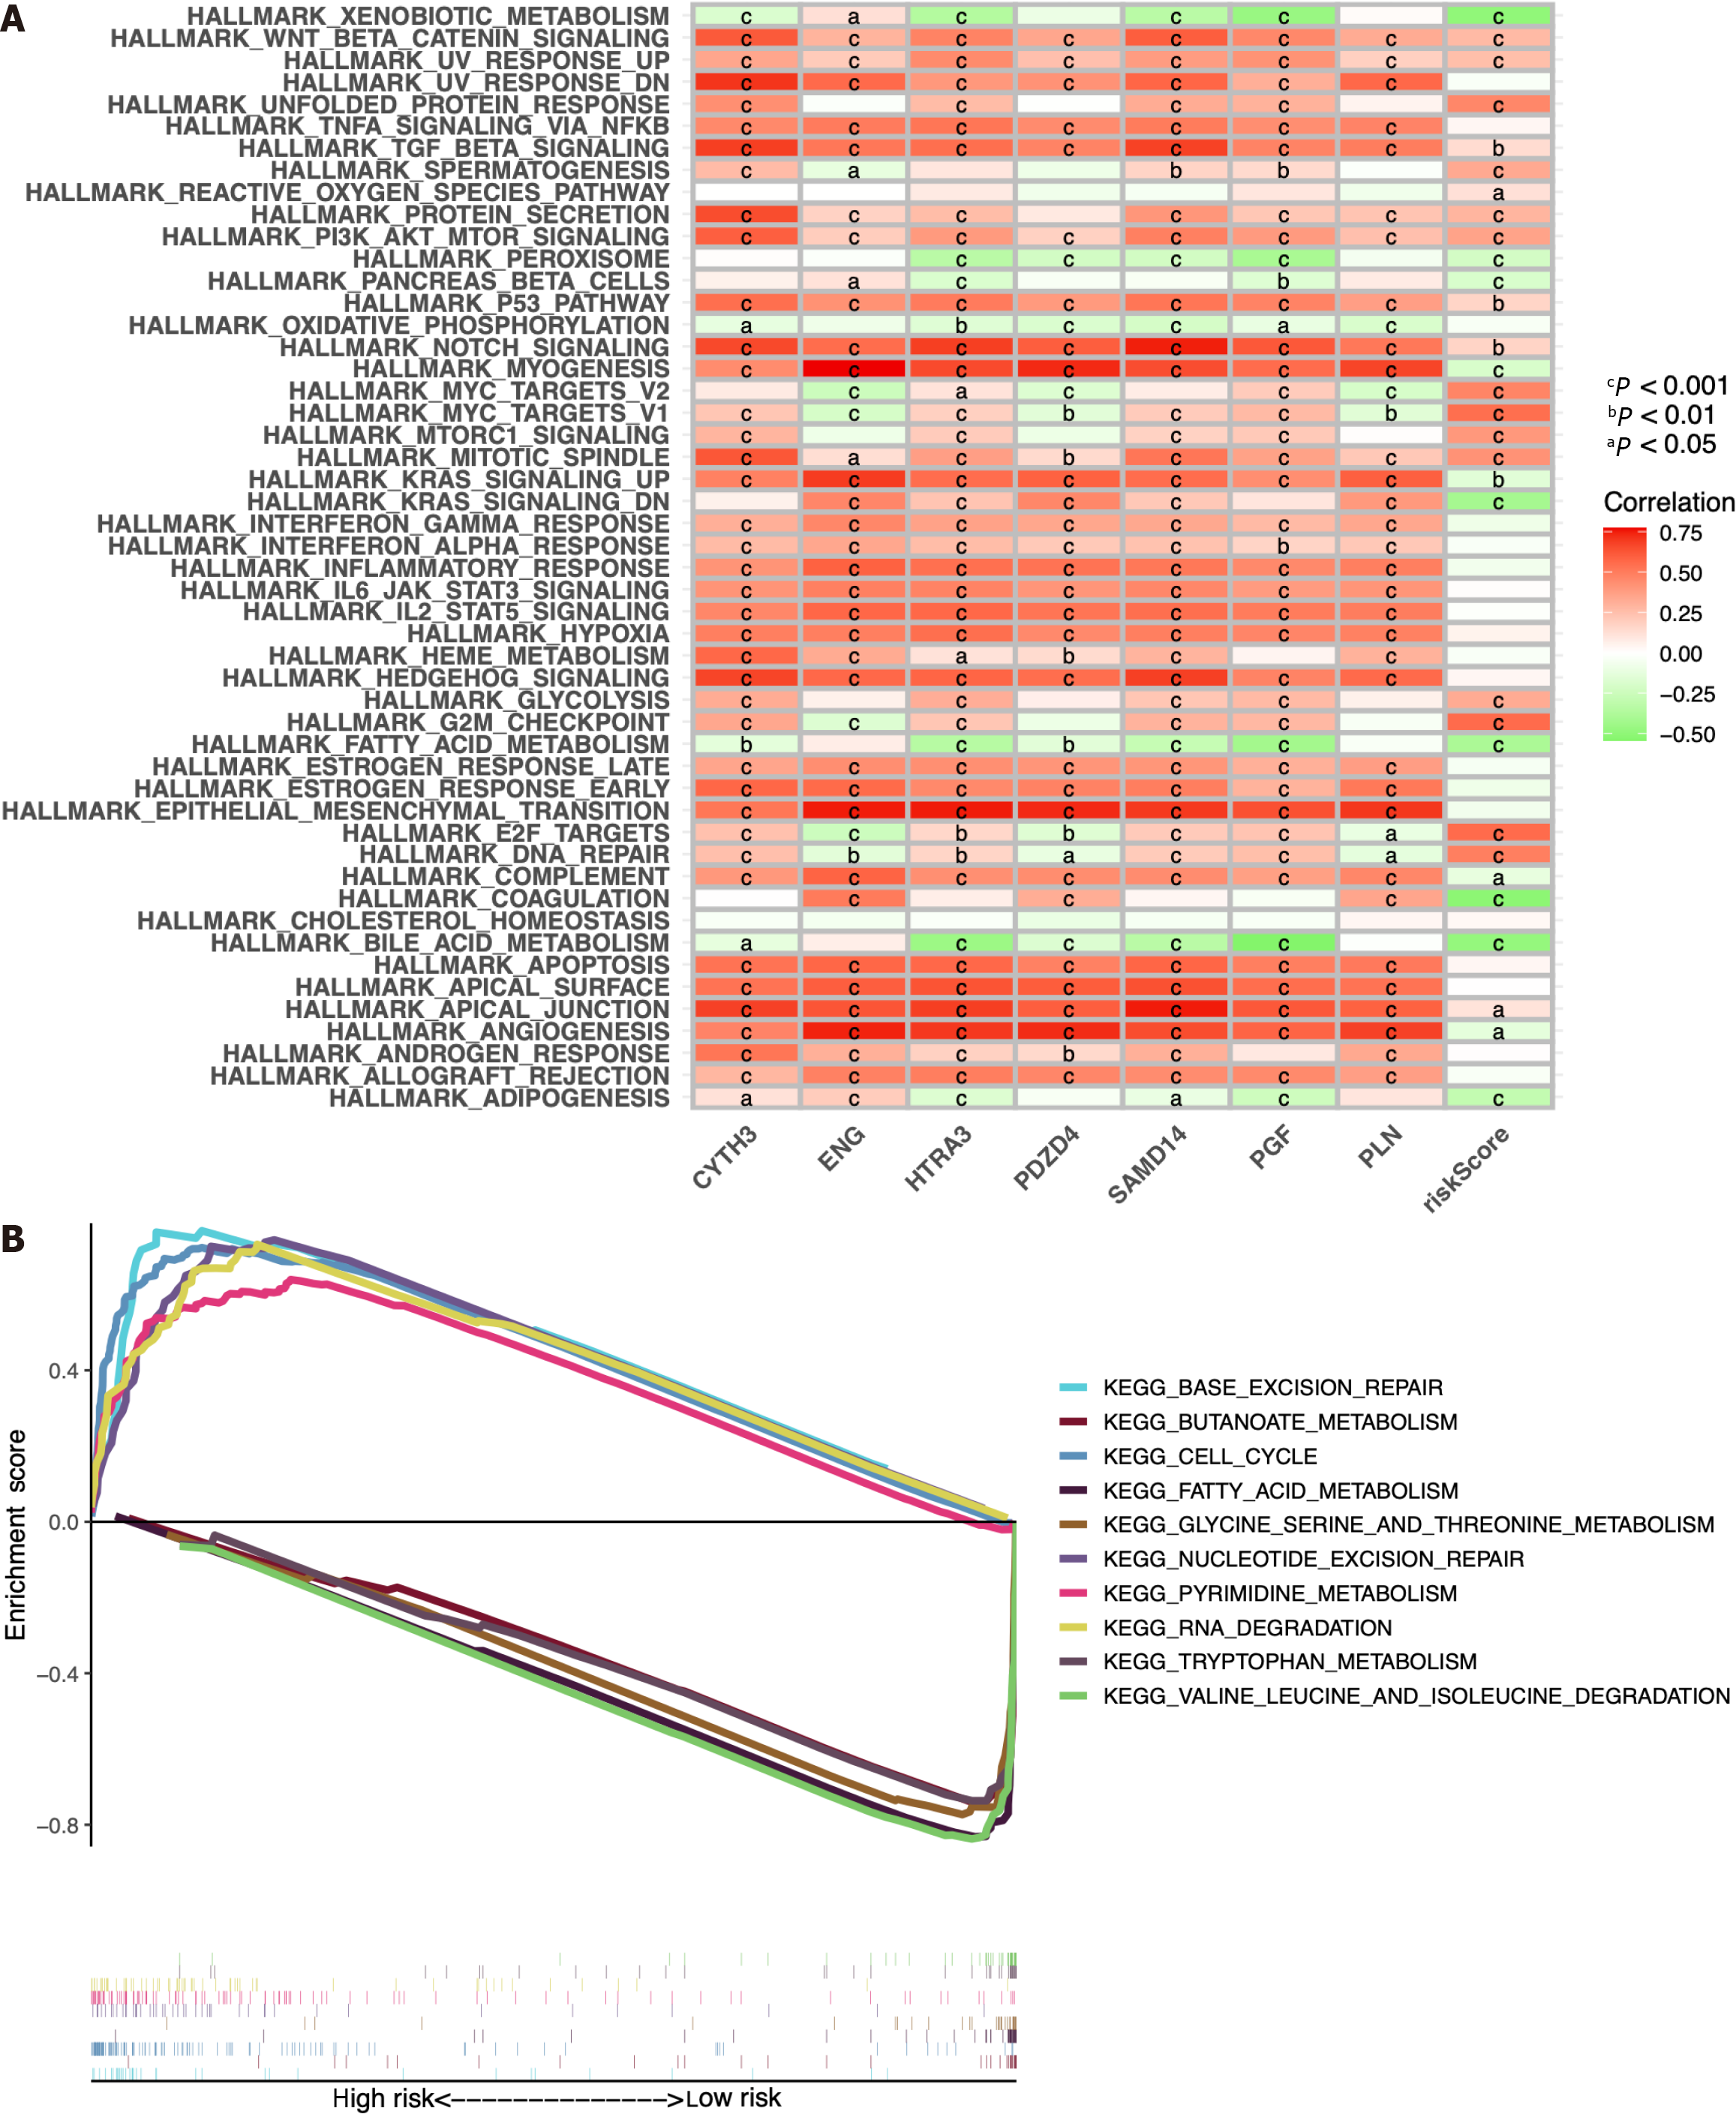
Figure 11 Bioinformatic analysis of the risk model.
A: Gene set variation analysis of the seven identified immune cell-related prognostic genes and the risk score; B: Gene set enrichment analysis of biological functions and pathways between the high- and low-risk groups. cP < 0.001, bP < 0.01, aP < 0.05.
- Citation: Li MT, Zheng KF, Qiu YE. Identification of immune cell-related prognostic genes characterized by a distinct microenvironment in hepatocellular carcinoma. World J Clin Oncol 2024; 15(2): 243-270
- URL: https://www.wjgnet.com/2218-4333/full/v15/i2/243.htm
- DOI: https://dx.doi.org/10.5306/wjco.v15.i2.243


