Copyright
©The Author(s) 2025.
World J Gastrointest Surg. Oct 27, 2025; 17(10): 110801
Published online Oct 27, 2025. doi: 10.4240/wjgs.v17.i10.110801
Published online Oct 27, 2025. doi: 10.4240/wjgs.v17.i10.110801
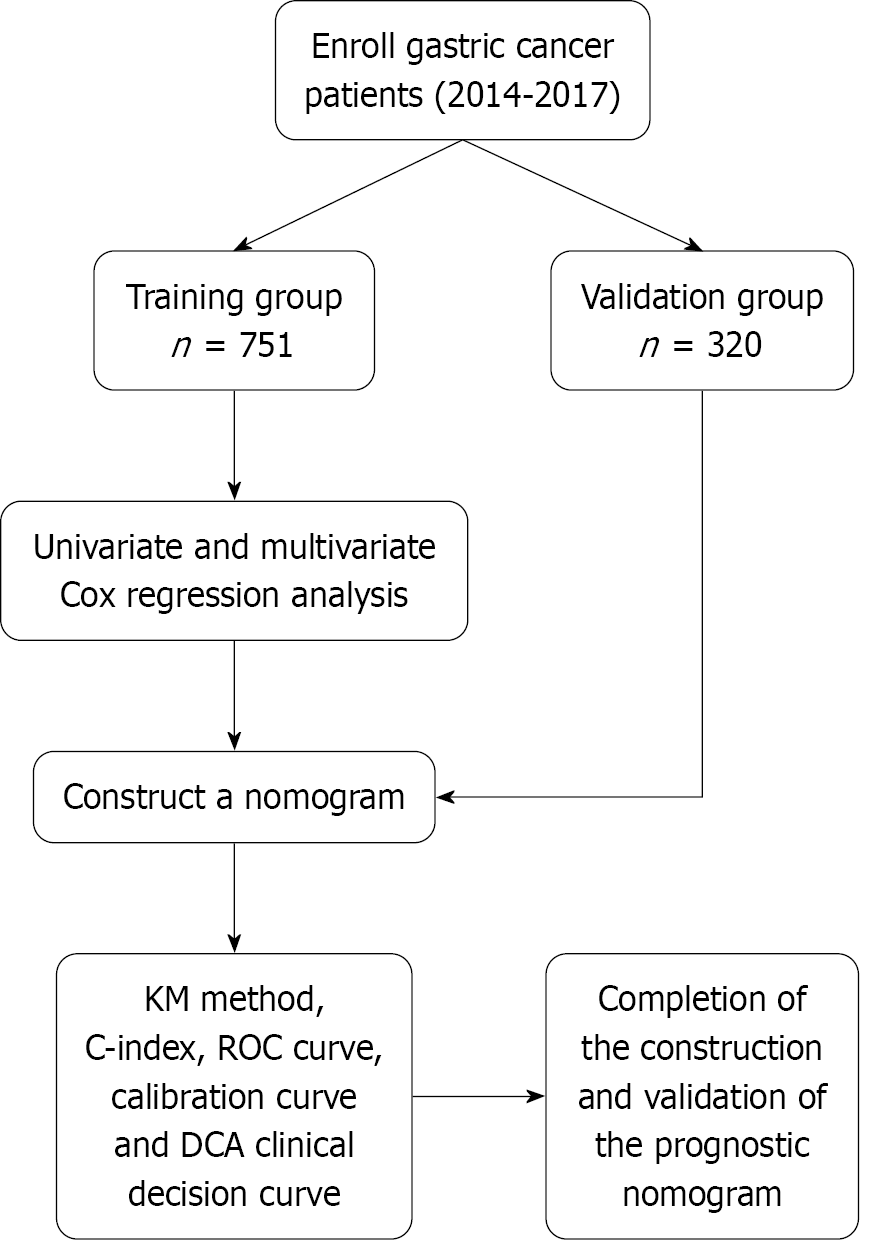
Figure 1 Flow diagram of the study design.
DCA: Decision curve analysis; ROC: Receiver operating characteristic.
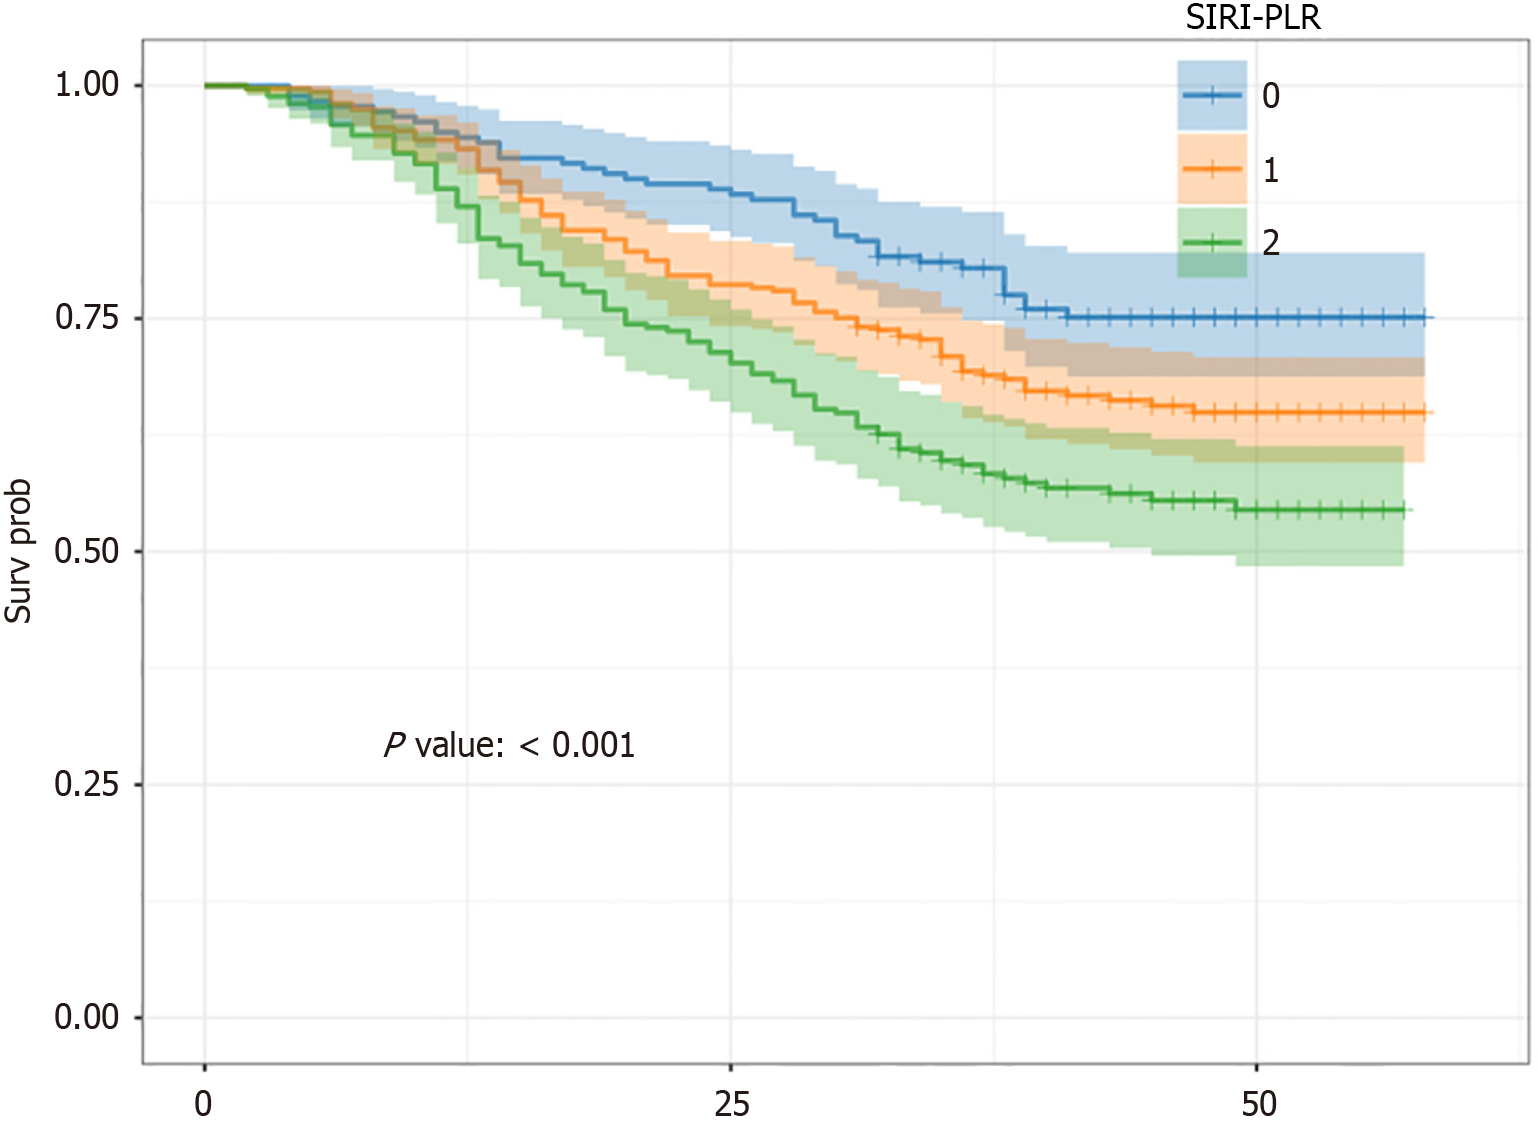
Figure 2 Kaplan-Meier analysis of overall survival in patients with stage I-III gastric cancer who were divided into three groups according to systemic inflammation response index-platelet-to-lymphocyte ratio in the training cohort.
SIRI-PLR: Systemic inflammation response index-platelet-to-lymphocyte ratio.
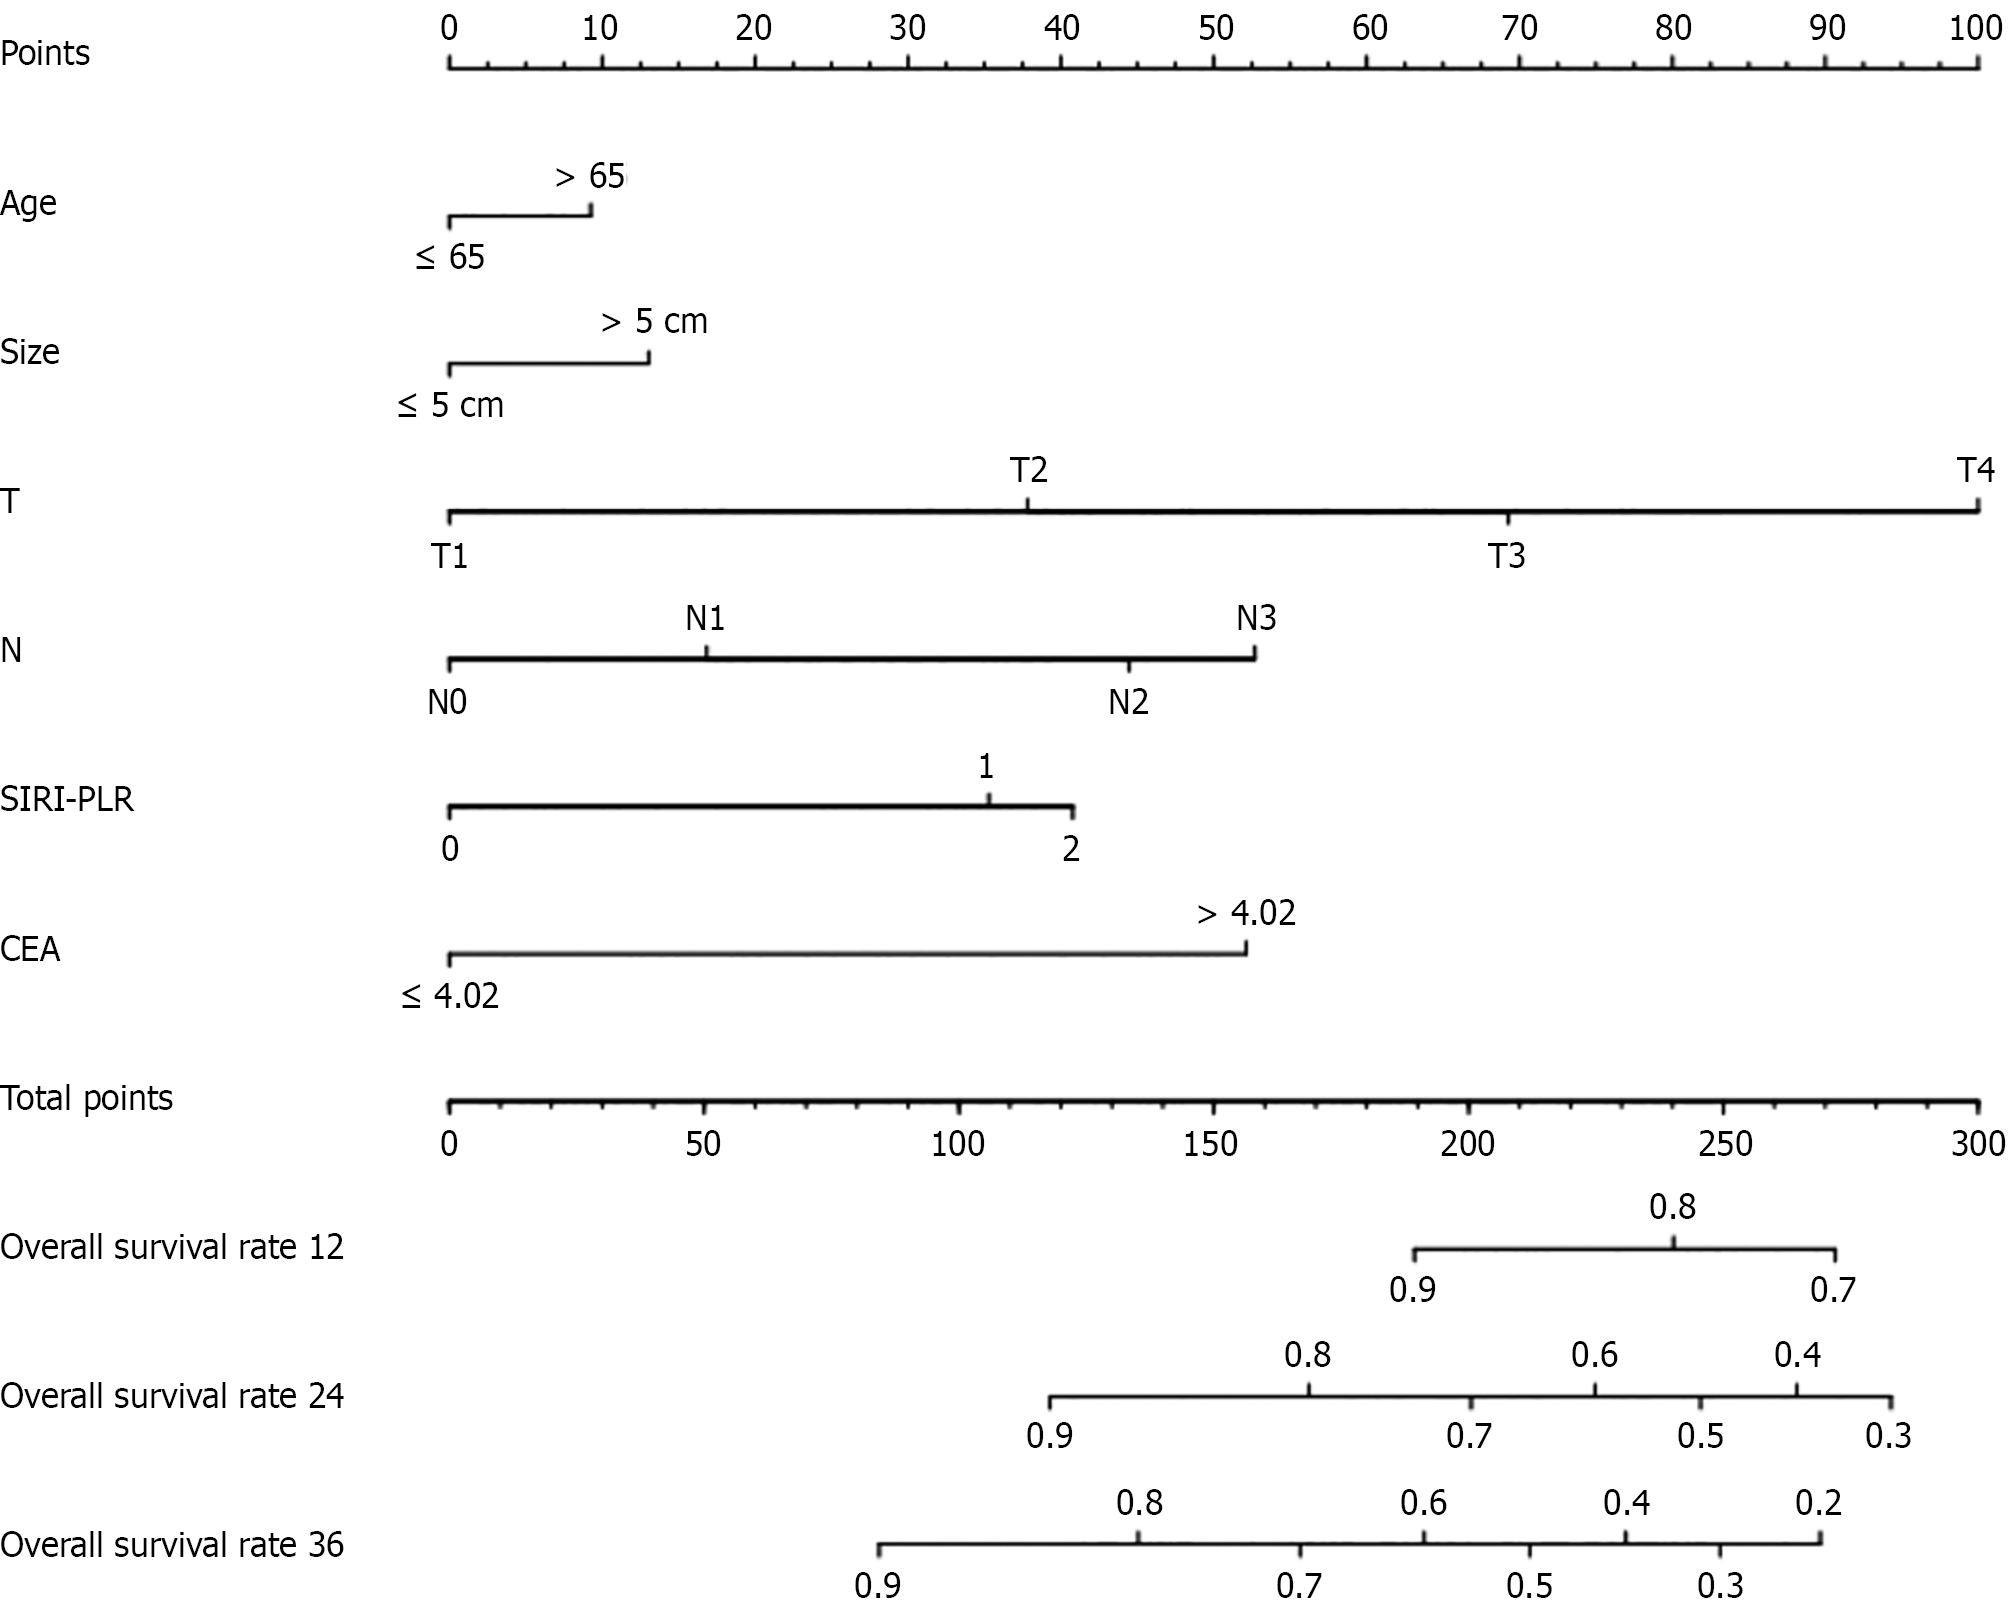
Figure 3 Construct a nomogram for predicting the postoperative overall survival of patients with stage I-III gastric cancer.
SIRI-PLR: Systemic inflammation response index-platelet-to-lymphocyte ratio; CEA: Carcinoembryonic antigen.
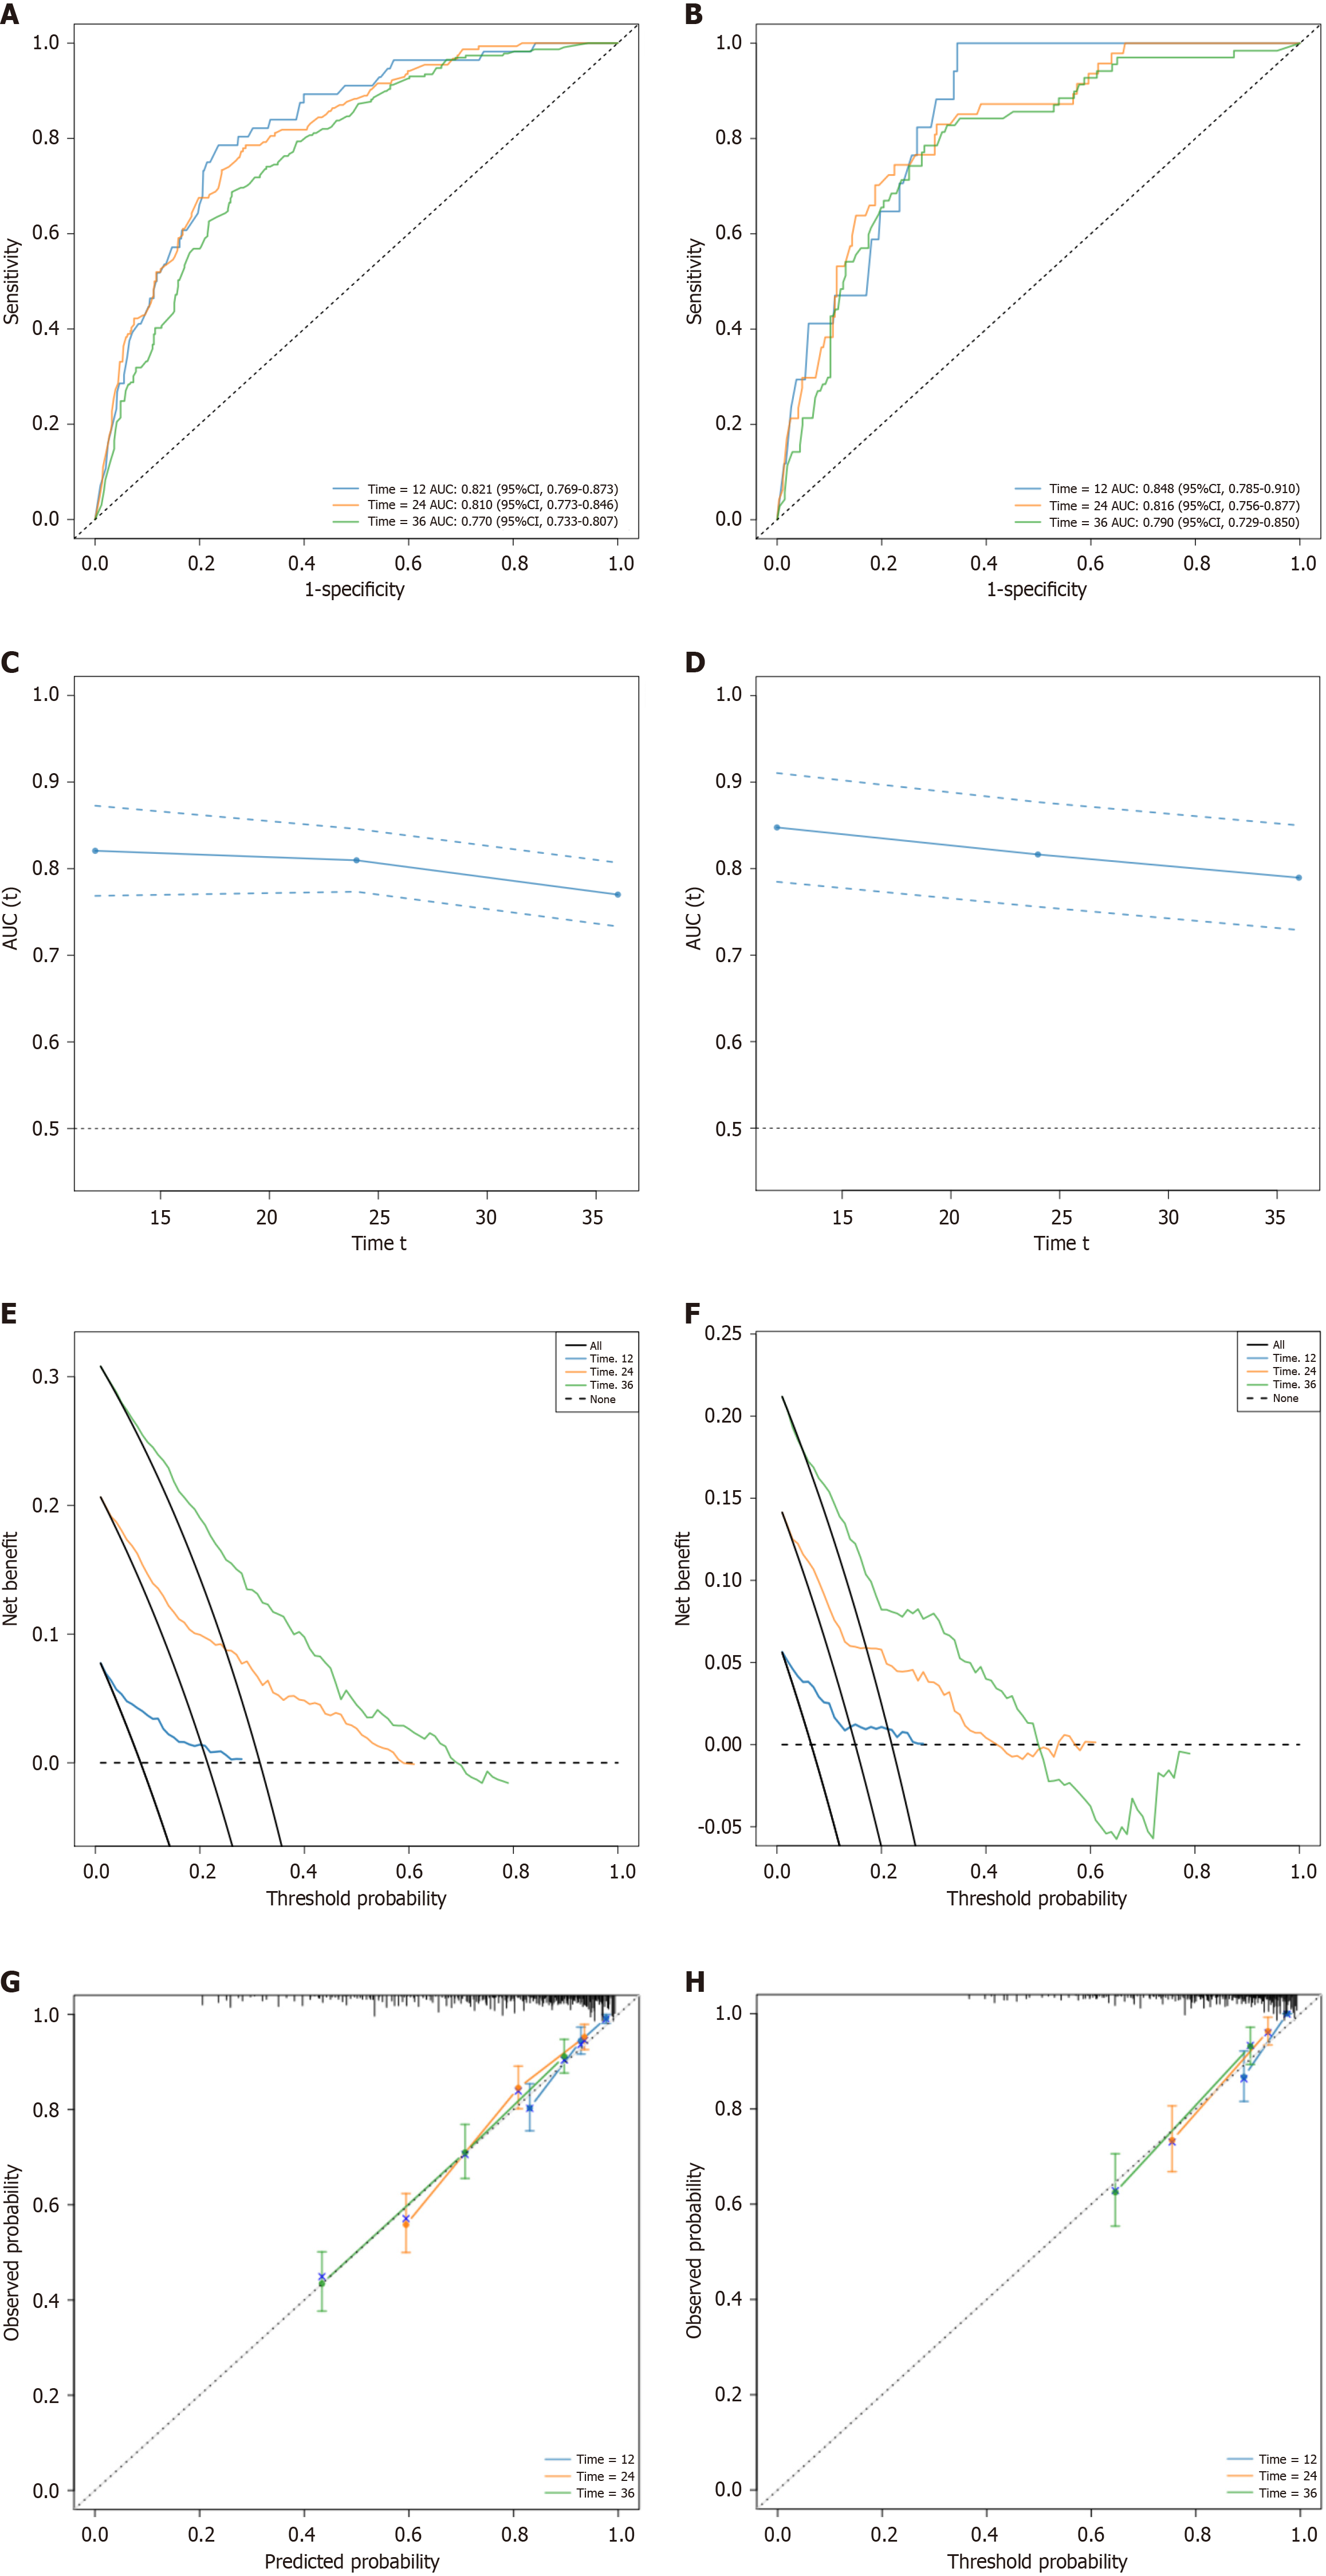
Figure 4 Receiver operating characteristic curve.
A: Receiver operating characteristic (ROC) curve of Nomogram model predicting 1-year, 2-year, and 3-year prognosis of patients in the training set; B: ROC curve of Nomogram model predicting 1-year, 2-year, and 3-year prognosis of patients in the validation set; C: C-index of the training group; D: C-index of the validation group; E: The decision analysis curve of the training group; F: The decision analysis curve of the validation group; G: Calibration curves for predicting 1-year, 2-year, and 3-year overall survival (OS) rates of patients with stage I-III gastric cancer (GC) in the training cohort. The actual OS rates are plotted on the Y-axis, while the OS rates predicted by the nomogram are plotted on the X-axis; H: Calibration curves for predicting the 1-year, 2-year, and 3-year OS rates of patients with stage I-III GC in the validation cohort. AUC: Area under the receiver operating characteristic curve.
- Citation: Zhou EZ, Zhang LX, Han WX, Xu AM, Wei ZJ. Clinical significance of systemic inflammation response index and platelet–lymphocyte ratio in patients with stage I-III gastric cancer. World J Gastrointest Surg 2025; 17(10): 110801
- URL: https://www.wjgnet.com/1948-9366/full/v17/i10/110801.htm
- DOI: https://dx.doi.org/10.4240/wjgs.v17.i10.110801


