
















Copyright: ©Author(s) 2026.
World J Gastrointest Oncol. Jul 15, 2026; 18(7): 119971
Published online Jul 15, 2026. doi: 10.4251/wjgo.v18.i7.119971
Published online Jul 15, 2026. doi: 10.4251/wjgo.v18.i7.119971
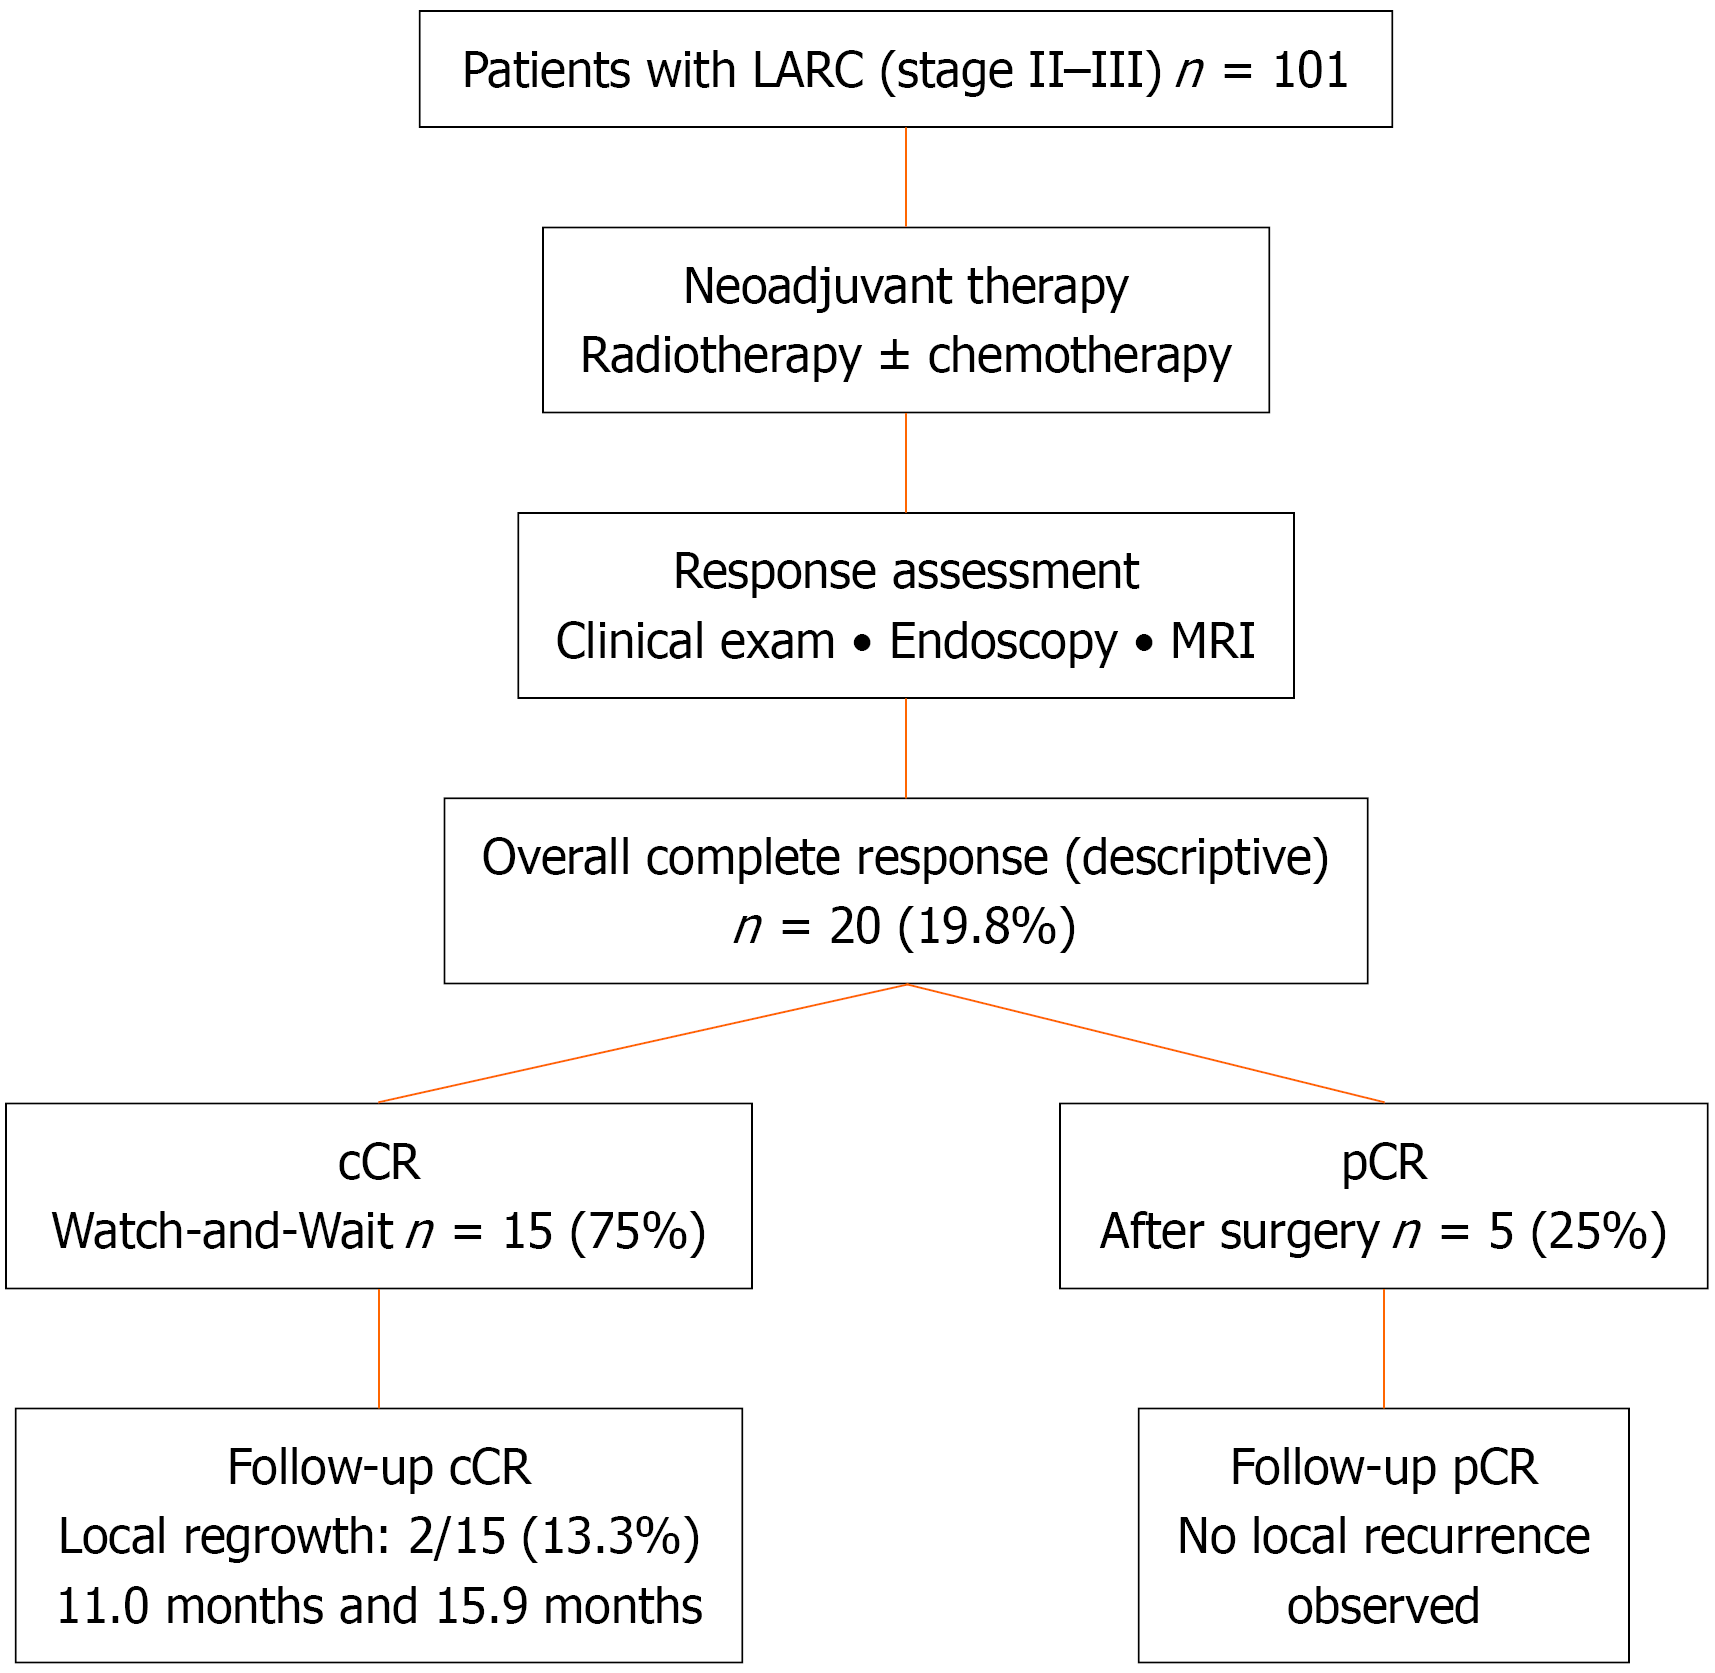
Figure 1 Flow diagram of the cohort and assessment of complete response.
The diagram illustrates patient selection, neoadjuvant treatment, post-treatment response assessment, and clinical outcomes. It shows the proportion of patients achieving a complete response, including those with complete clinical response managed with a watch-and-wait strategy and those with pathological complete response confirmed after surgery, as well as the occurrence of local recurrence during follow-up. LARC: Locally advanced rectal cancer; MRI: Magnetic resonance imaging; cCR: Complete clinical response; pCR: Pathological complete response.
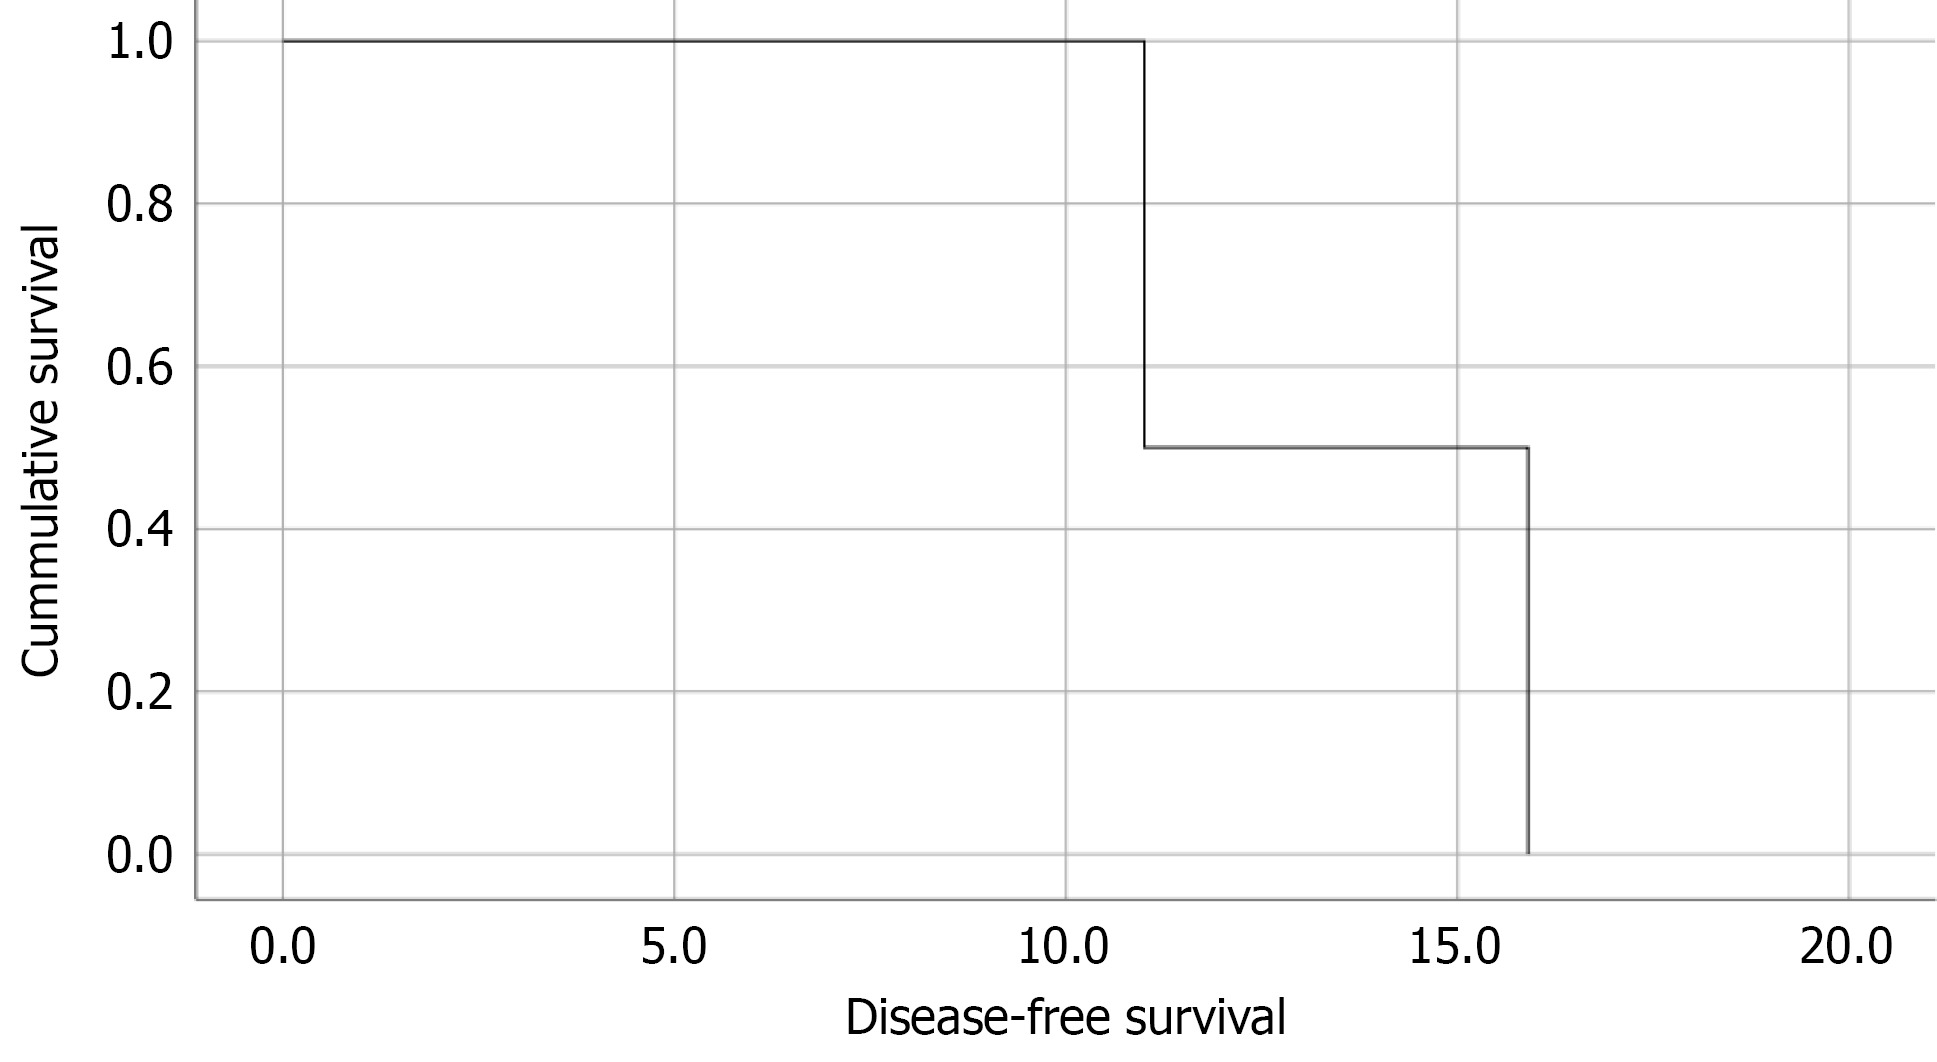
Figure 2 Kaplan-Meier curve for local recurrence.
The graph shows the cumulative probability of local recurrence-free survival among complete responders (n = 20). Two local recurrence events were registered within the follow-up period (11 months and 15.9 months). The median recurrence-free survival was not reached due to the small number of events.
- Citation: Brito-Toledo I, Sansón-Riofrío JA, Cervantes-Díaz MT, de Anda-González J, Medrano-Guzmán R, Moreno-González E, Vadillo E, Ibarra A. Factors associated with complete clinical response after neoadjuvant therapy in locally advanced rectal cancer: A Mexican retrospective study. World J Gastrointest Oncol 2026; 18(7): 119971
- URL: https://www.wjgnet.com/1948-5204/full/v18/i7/119971.htm
- DOI: https://dx.doi.org/10.4251/wjgo.v18.i7.119971