Copyright
©The Author(s) 2025.
World J Gastrointest Oncol. Sep 15, 2025; 17(9): 110245
Published online Sep 15, 2025. doi: 10.4251/wjgo.v17.i9.110245
Published online Sep 15, 2025. doi: 10.4251/wjgo.v17.i9.110245
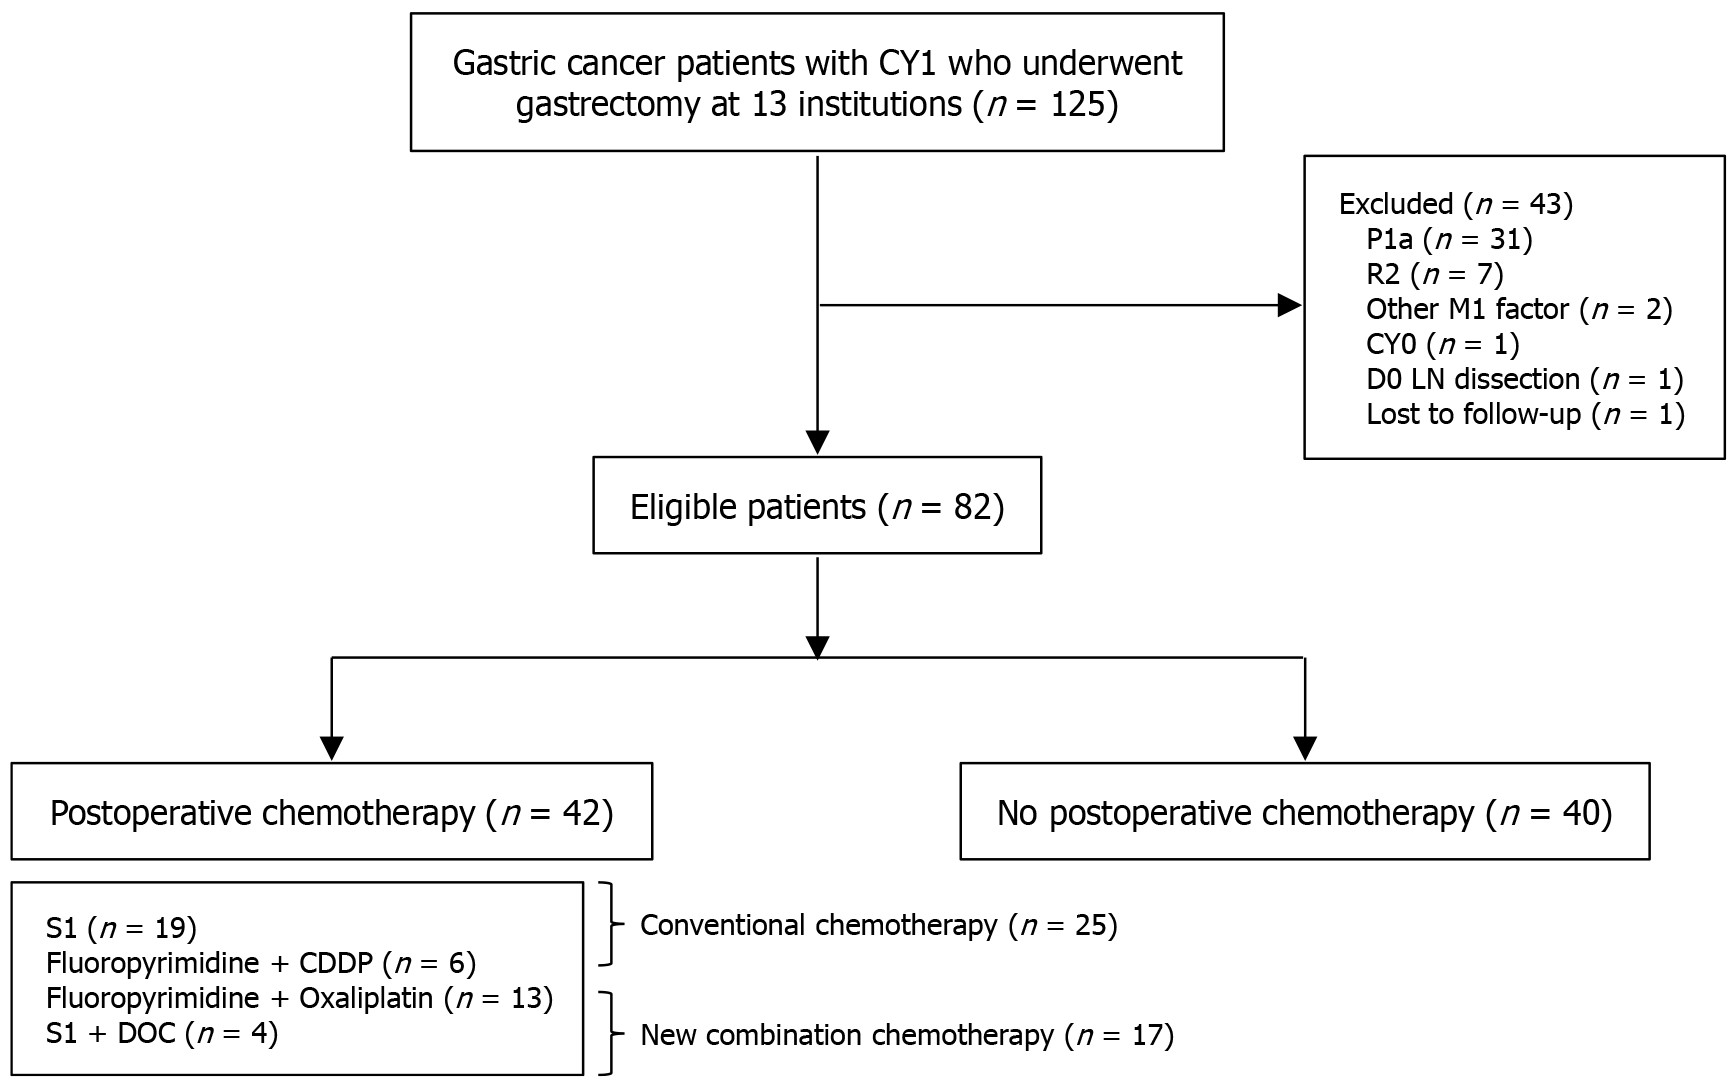
Figure 1 Flow diagram of gastric cancer patients with peritoneal lavage cytology-positive who underwent gastrectomy.
CY1: Peritoneal lavage cytology-positive; P1a: Localized peritoneal metastasis; R2: Residual tumor (gross/pathological) with peritoneal dissemination or positive margins in locally advanced disease; M1: Metastasis to distant organs; CY0: Peritoneal lavage cytology-suspected false positive; D0 LN: Lymph node (D0); CDDP: Cisplatin; DOC: Docetaxel.
Figure 2 Transition of chemotherapy.
CTx: Chemotherapy.
Figure 3 Kaplan-Meier curves.
A: Kaplan-Meier curves of survival in the two postoperative chemotherapy groups for progression-free survival; B: Kaplan-Meier curves of survival in the two postoperative chemotherapy groups for overall survival; C: Inverse probability of treatment weighting-adjusted Kaplan-Meier curves for progression-free survival; D: Inverse probability of treatment weighting-adjusted Kaplan-Meier curves for overall survival. CTx: Chemotherapy; PFS: Progression-free survival.
- Citation: Sugiyama Y, Tanabe K, Yanagawa S, Tazawa H, Toyota K, Kano M, Misumi T, Shishida M, Okano K, Hotta R, Ota H, Imaoka Y, Fukuda T, Takahashi S, Ohdan H. Prognostic factors and efficacy of postoperative chemotherapy in patients with gastric cancer with positive peritoneal cytology after gastrectomy. World J Gastrointest Oncol 2025; 17(9): 110245
- URL: https://www.wjgnet.com/1948-5204/full/v17/i9/110245.htm
- DOI: https://dx.doi.org/10.4251/wjgo.v17.i9.110245


