Copyright
©The Author(s) 2025.
World J Gastrointest Oncol. Sep 15, 2025; 17(9): 109378
Published online Sep 15, 2025. doi: 10.4251/wjgo.v17.i9.109378
Published online Sep 15, 2025. doi: 10.4251/wjgo.v17.i9.109378
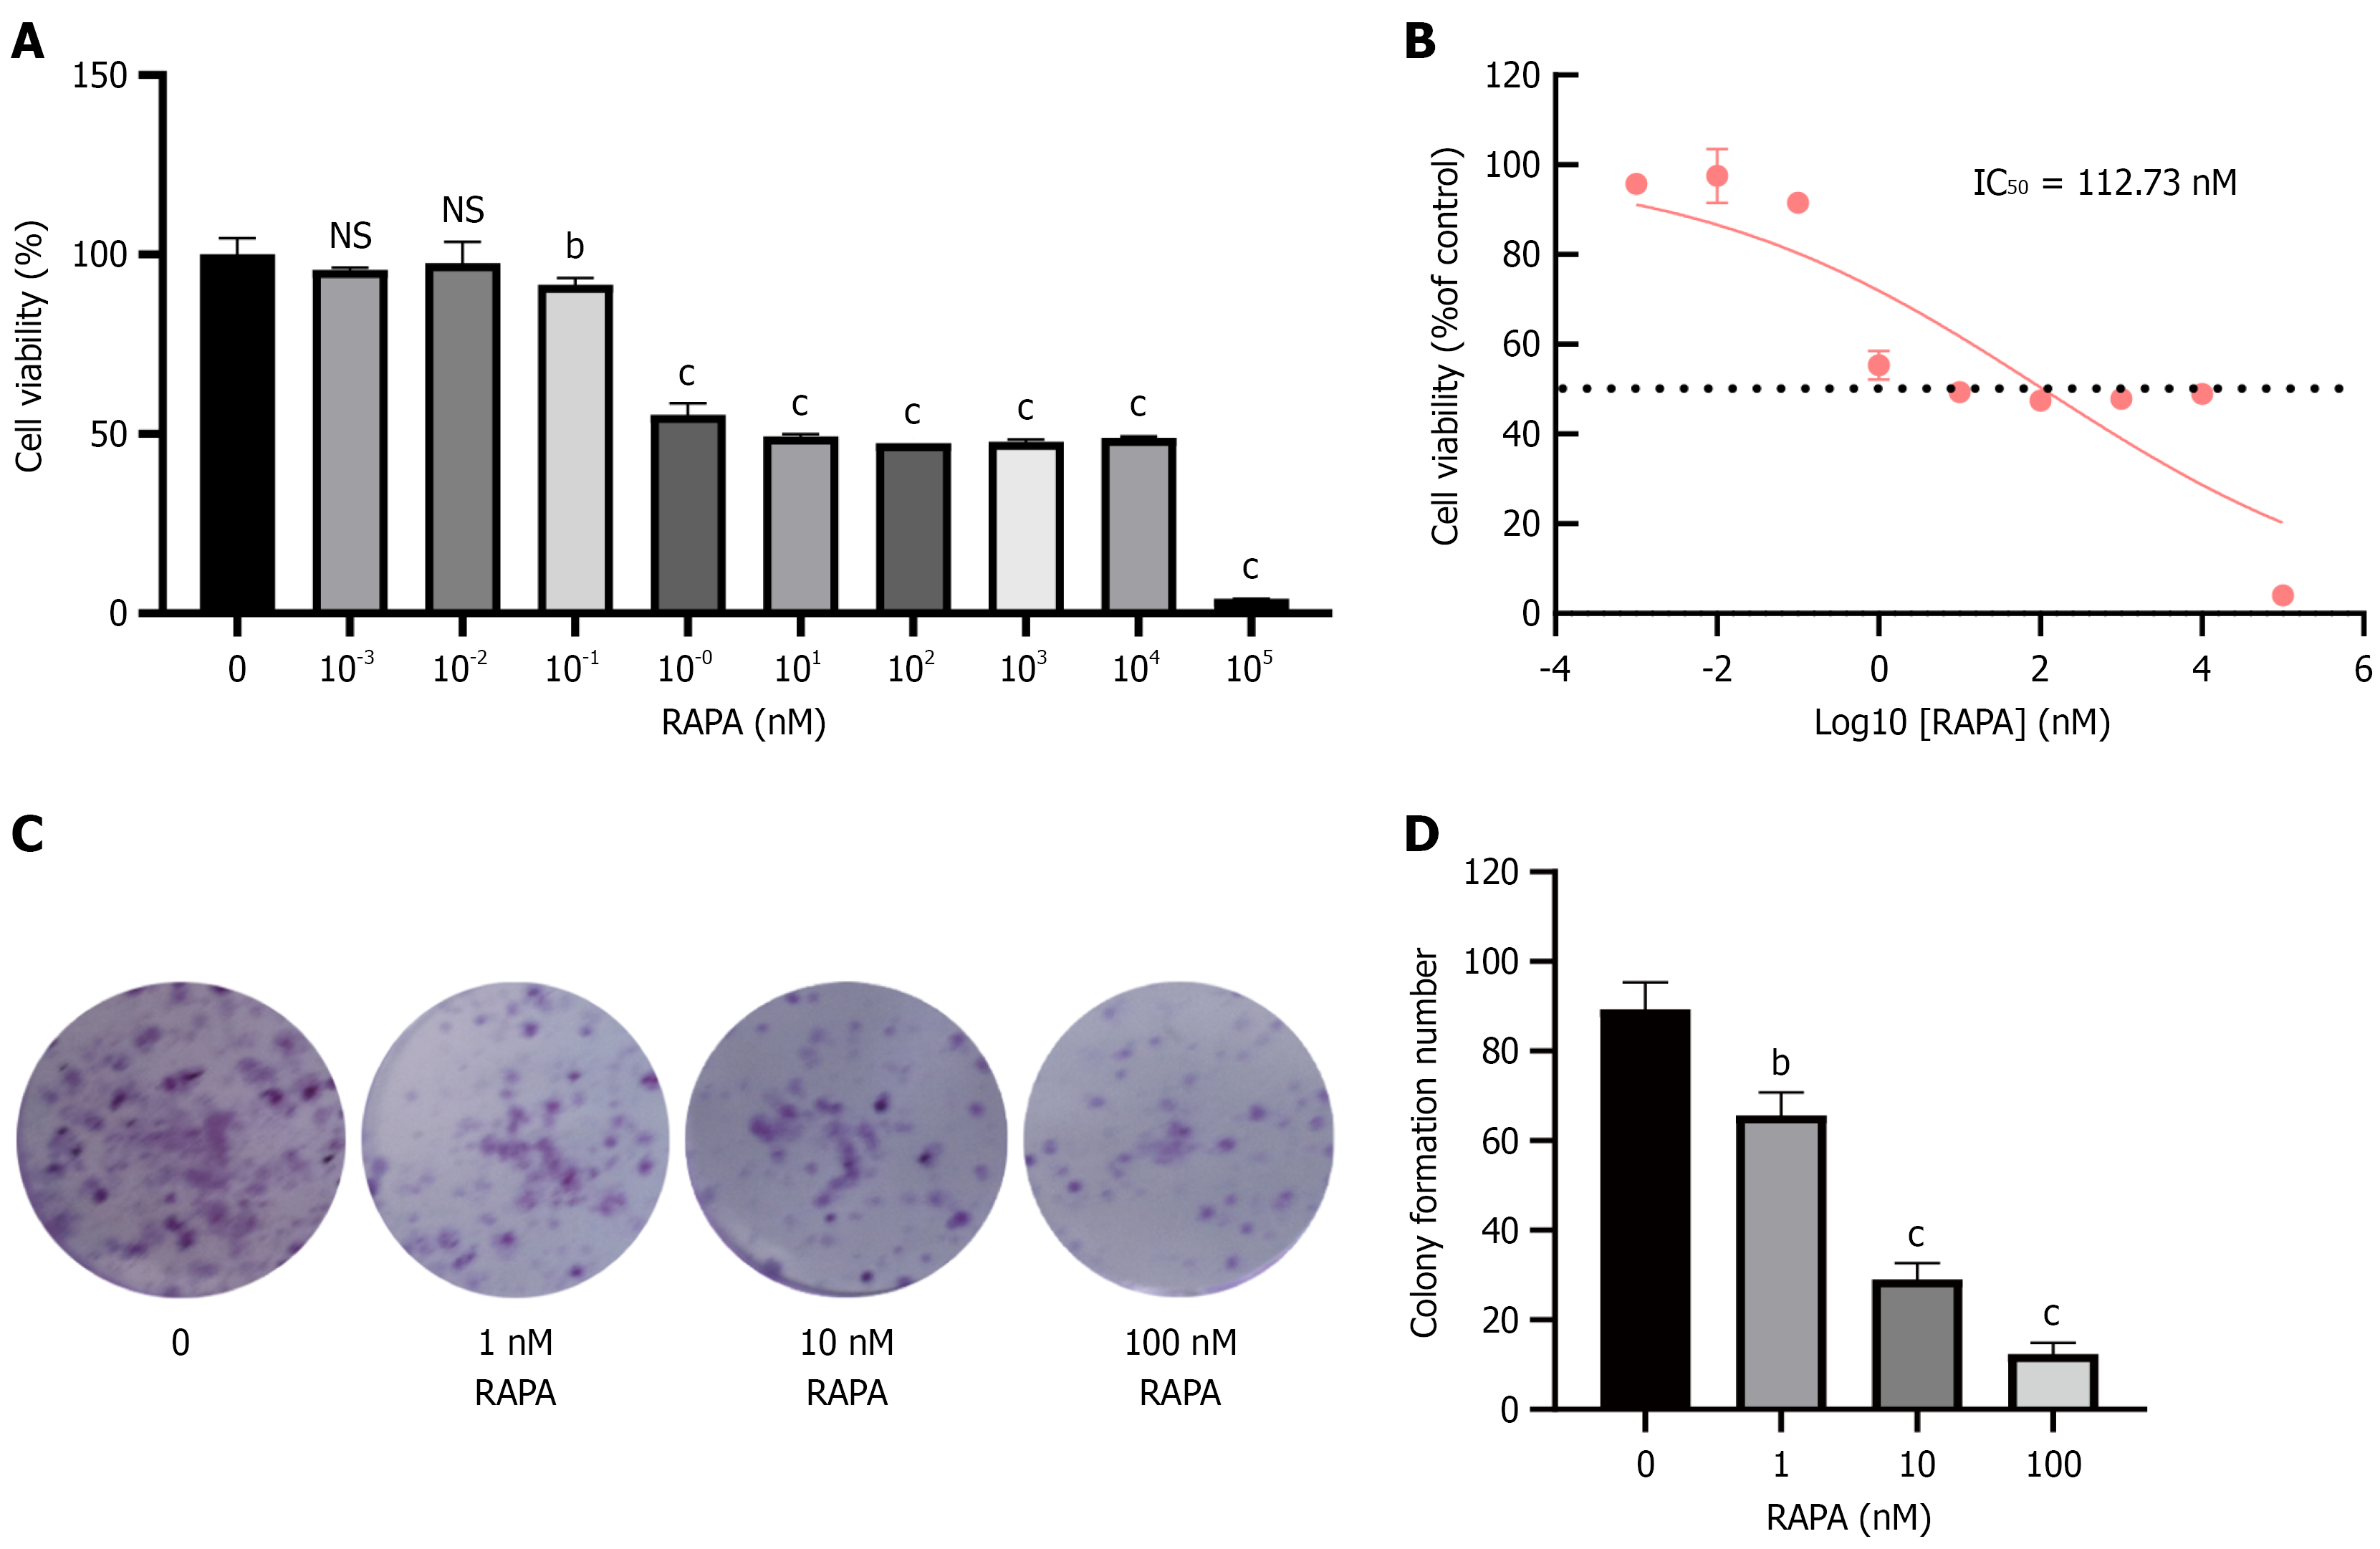
Figure 1 Effects of rapamycin on HUTU 80 cells proliferation.
A: Methylthiazolyldiphenyl-tetrazolium bromide assay was used to assess the effect of rapamycin (RAPA) on the proliferation of HUTU 80 cells at 48 hours; B: Calculation of the IC50 of RAPA on cells after 48 hours; C: Colony formation assay was used to assess the effect of RAPA on cell proliferation; D: Colony statistical chart. Data are presented as the mean ± SD (n = 3). aP < 0.05. bP < 0.01. cP < 0.001. RAPA: Rapamycin; NS: No significance.
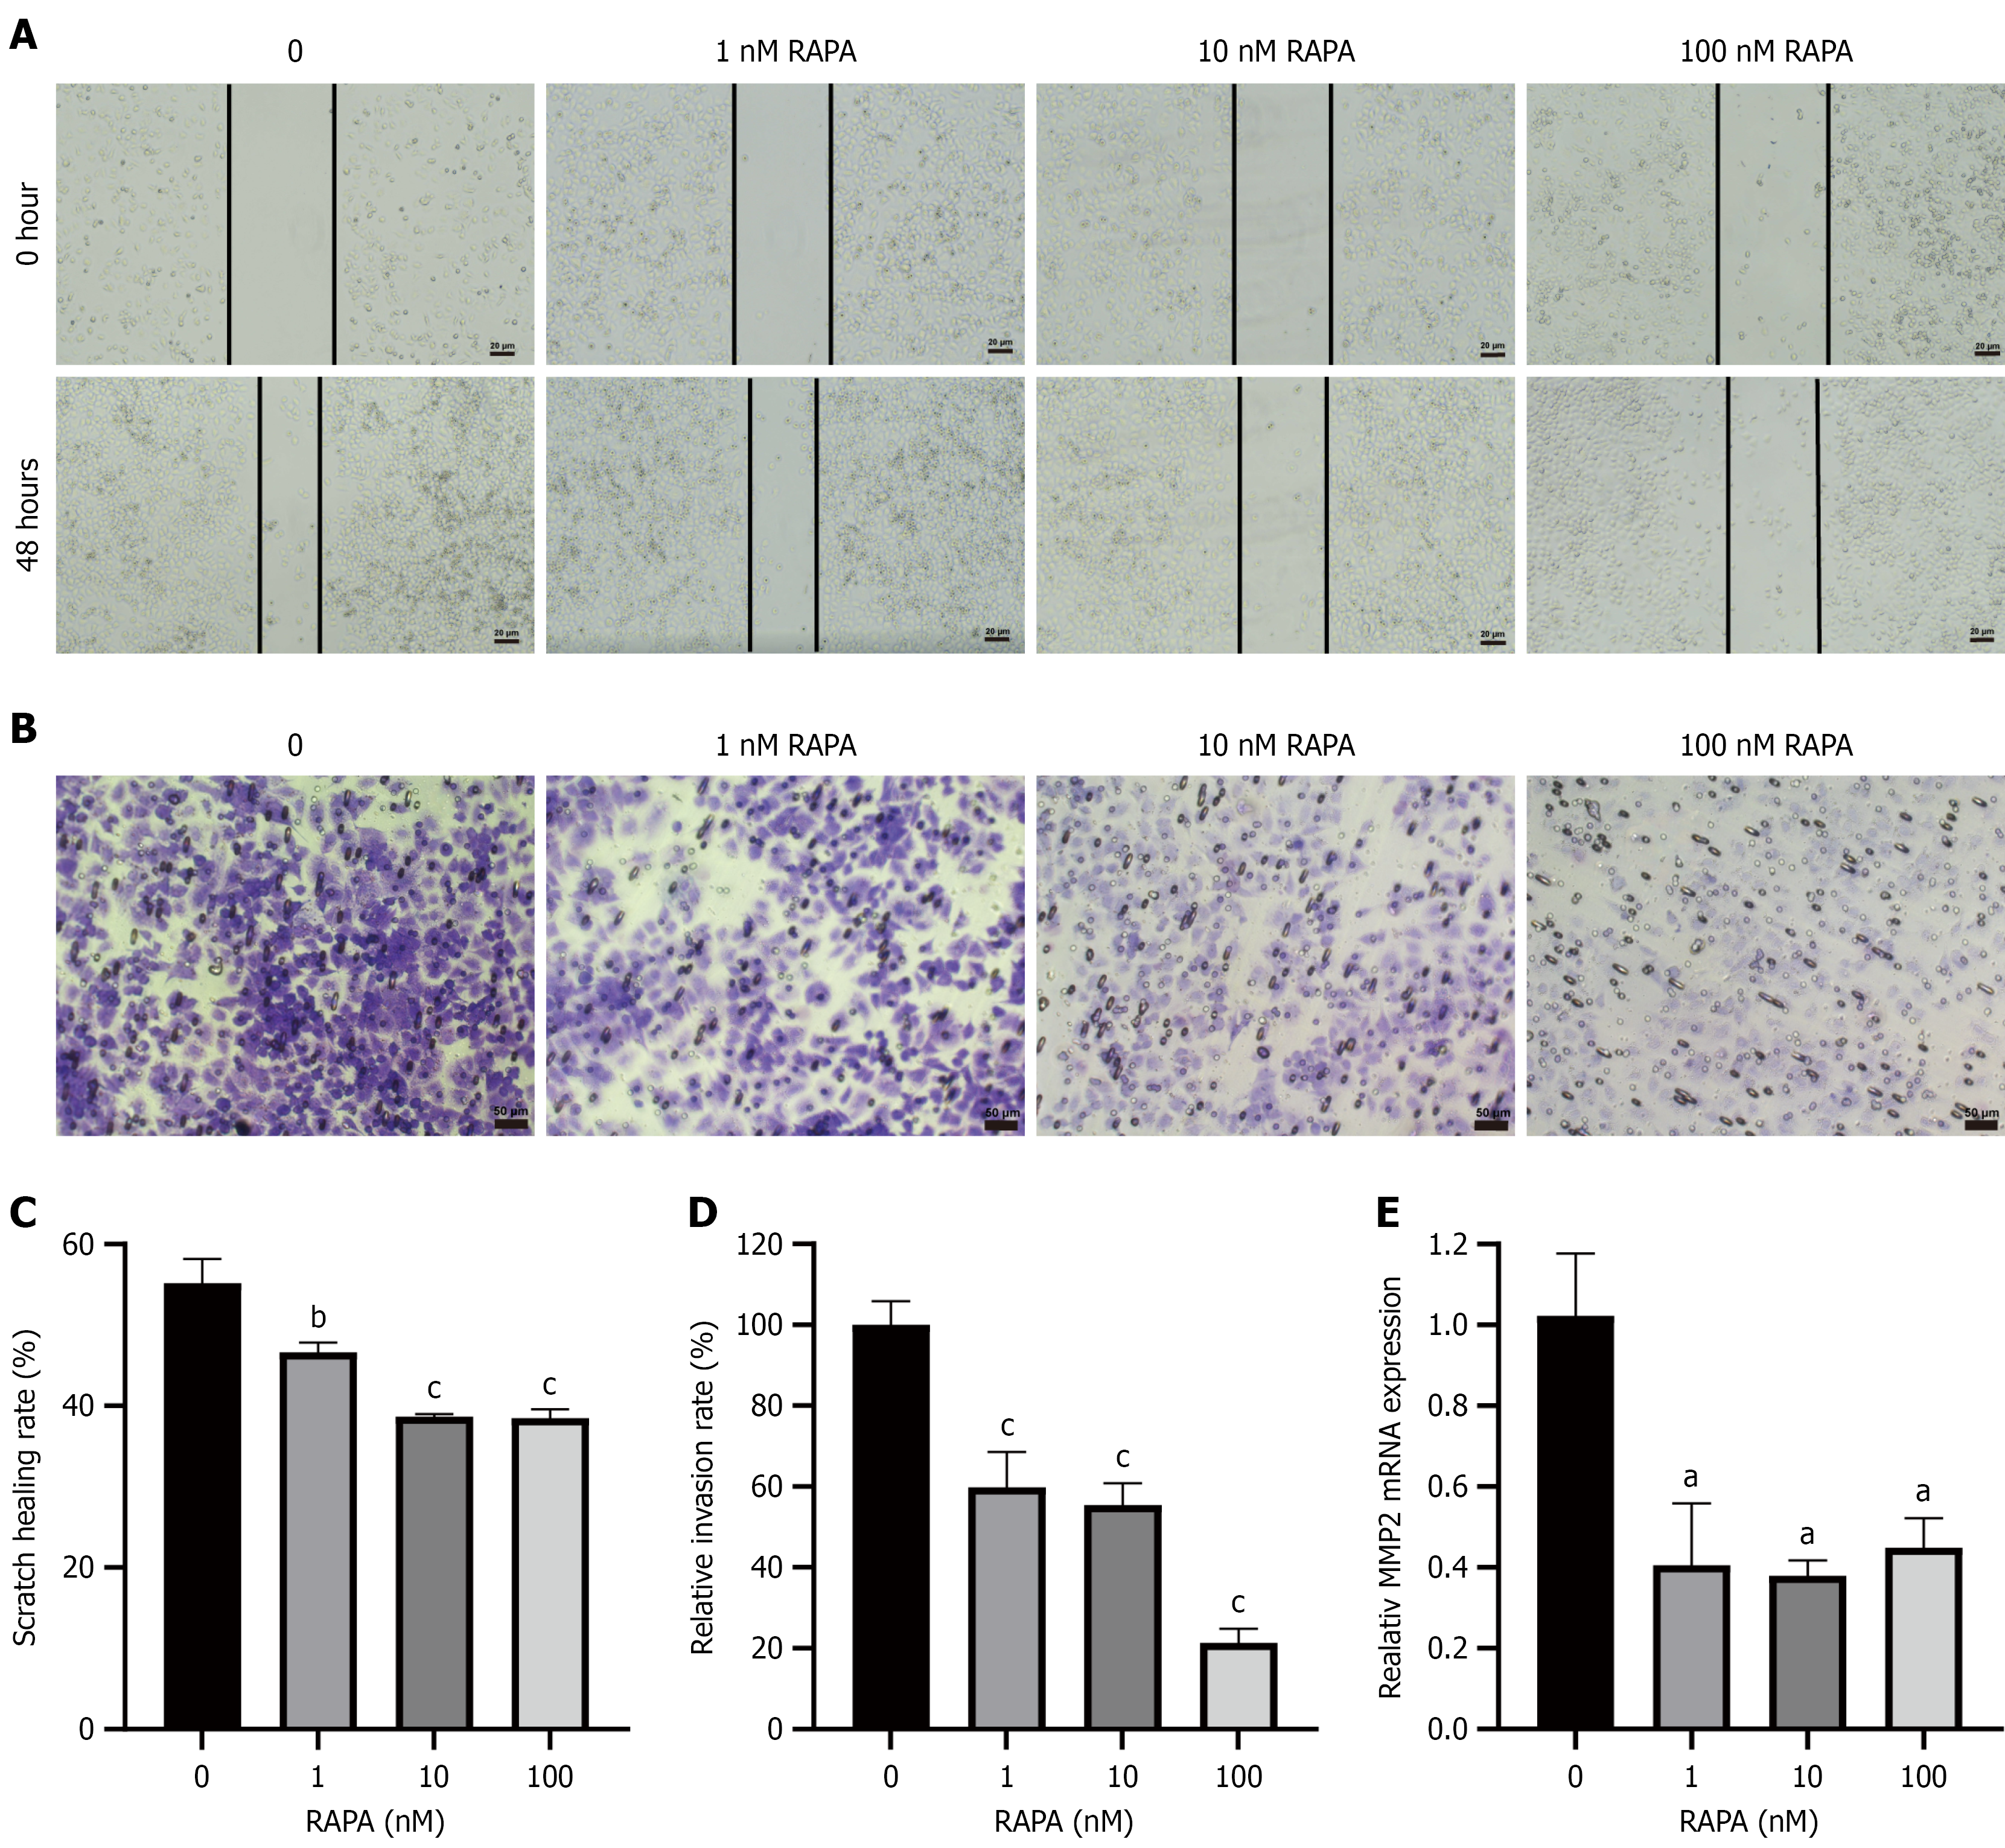
Figure 2 Effects of rapamycin on migration and invasion of HUTU 80 cells.
A: Detection of the effect of rapamycin (RAPA) on cell migration ability through a wound healing assay; B: Assessment of the influence of RAPA on cell invasion capabilities using Transwell assay; C: Statistical chart of the cell migration ratio; D: Statistical chart of cell invasion ability; E: Quantitative polymerase chain reaction was used to evaluate the messenger RNA expression level of MMP2. Data are presented as the mean ± SD (n = 3). aP < 0.05. bP < 0.01. cP < 0.001. MMP: Matrix metalloproteinase; RAPA: Rapamycin.
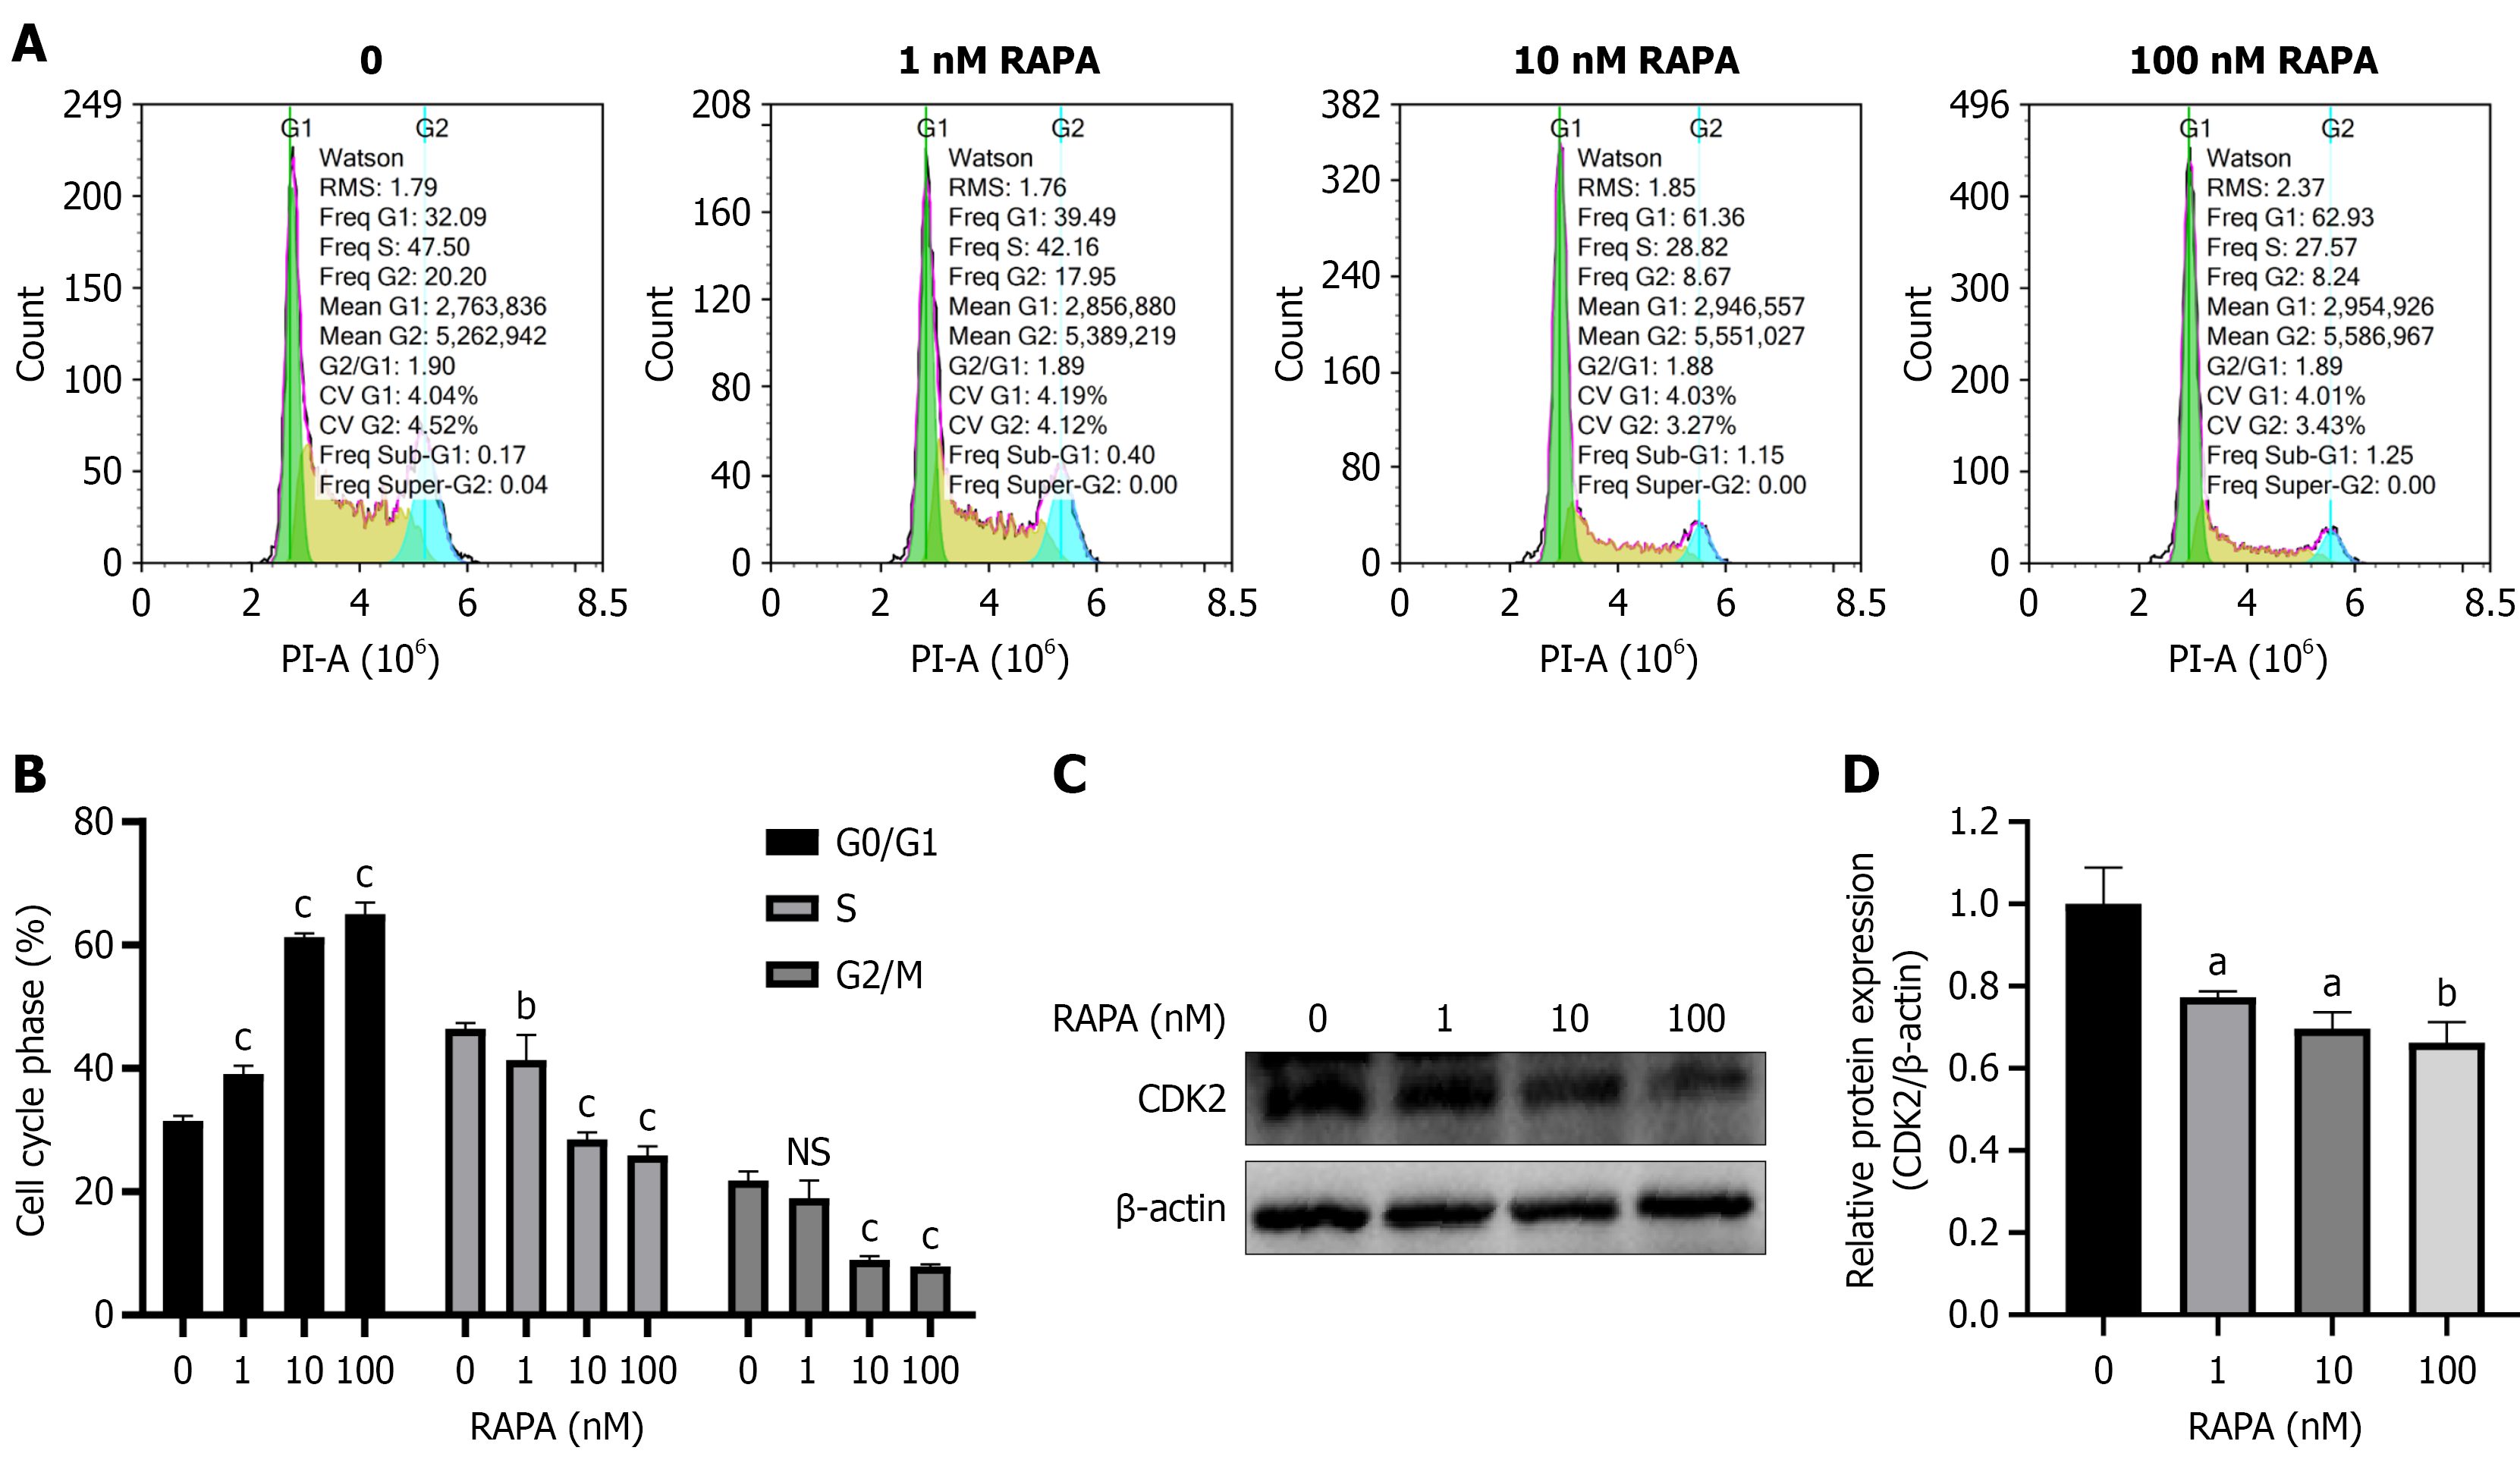
Figure 3 Effects of rapamycin on cell cycle of HUTU 80 cells.
A: Flow cytometry was used to assess cell cycle changes; B: Statistical map of cell cycle distribution; C: Detection of protein expression of cell cycle proteins by western blotting; D: Statistical graph of protein expression. Data are presented as the mean ± SD (n = 3). aP < 0.05. bP < 0.01. cP < 0.001. PI-A: Propidium iodide-area; RAPA: Rapamycin; NS: No significance; CDK2: Cyclin-dependent kinases 2.
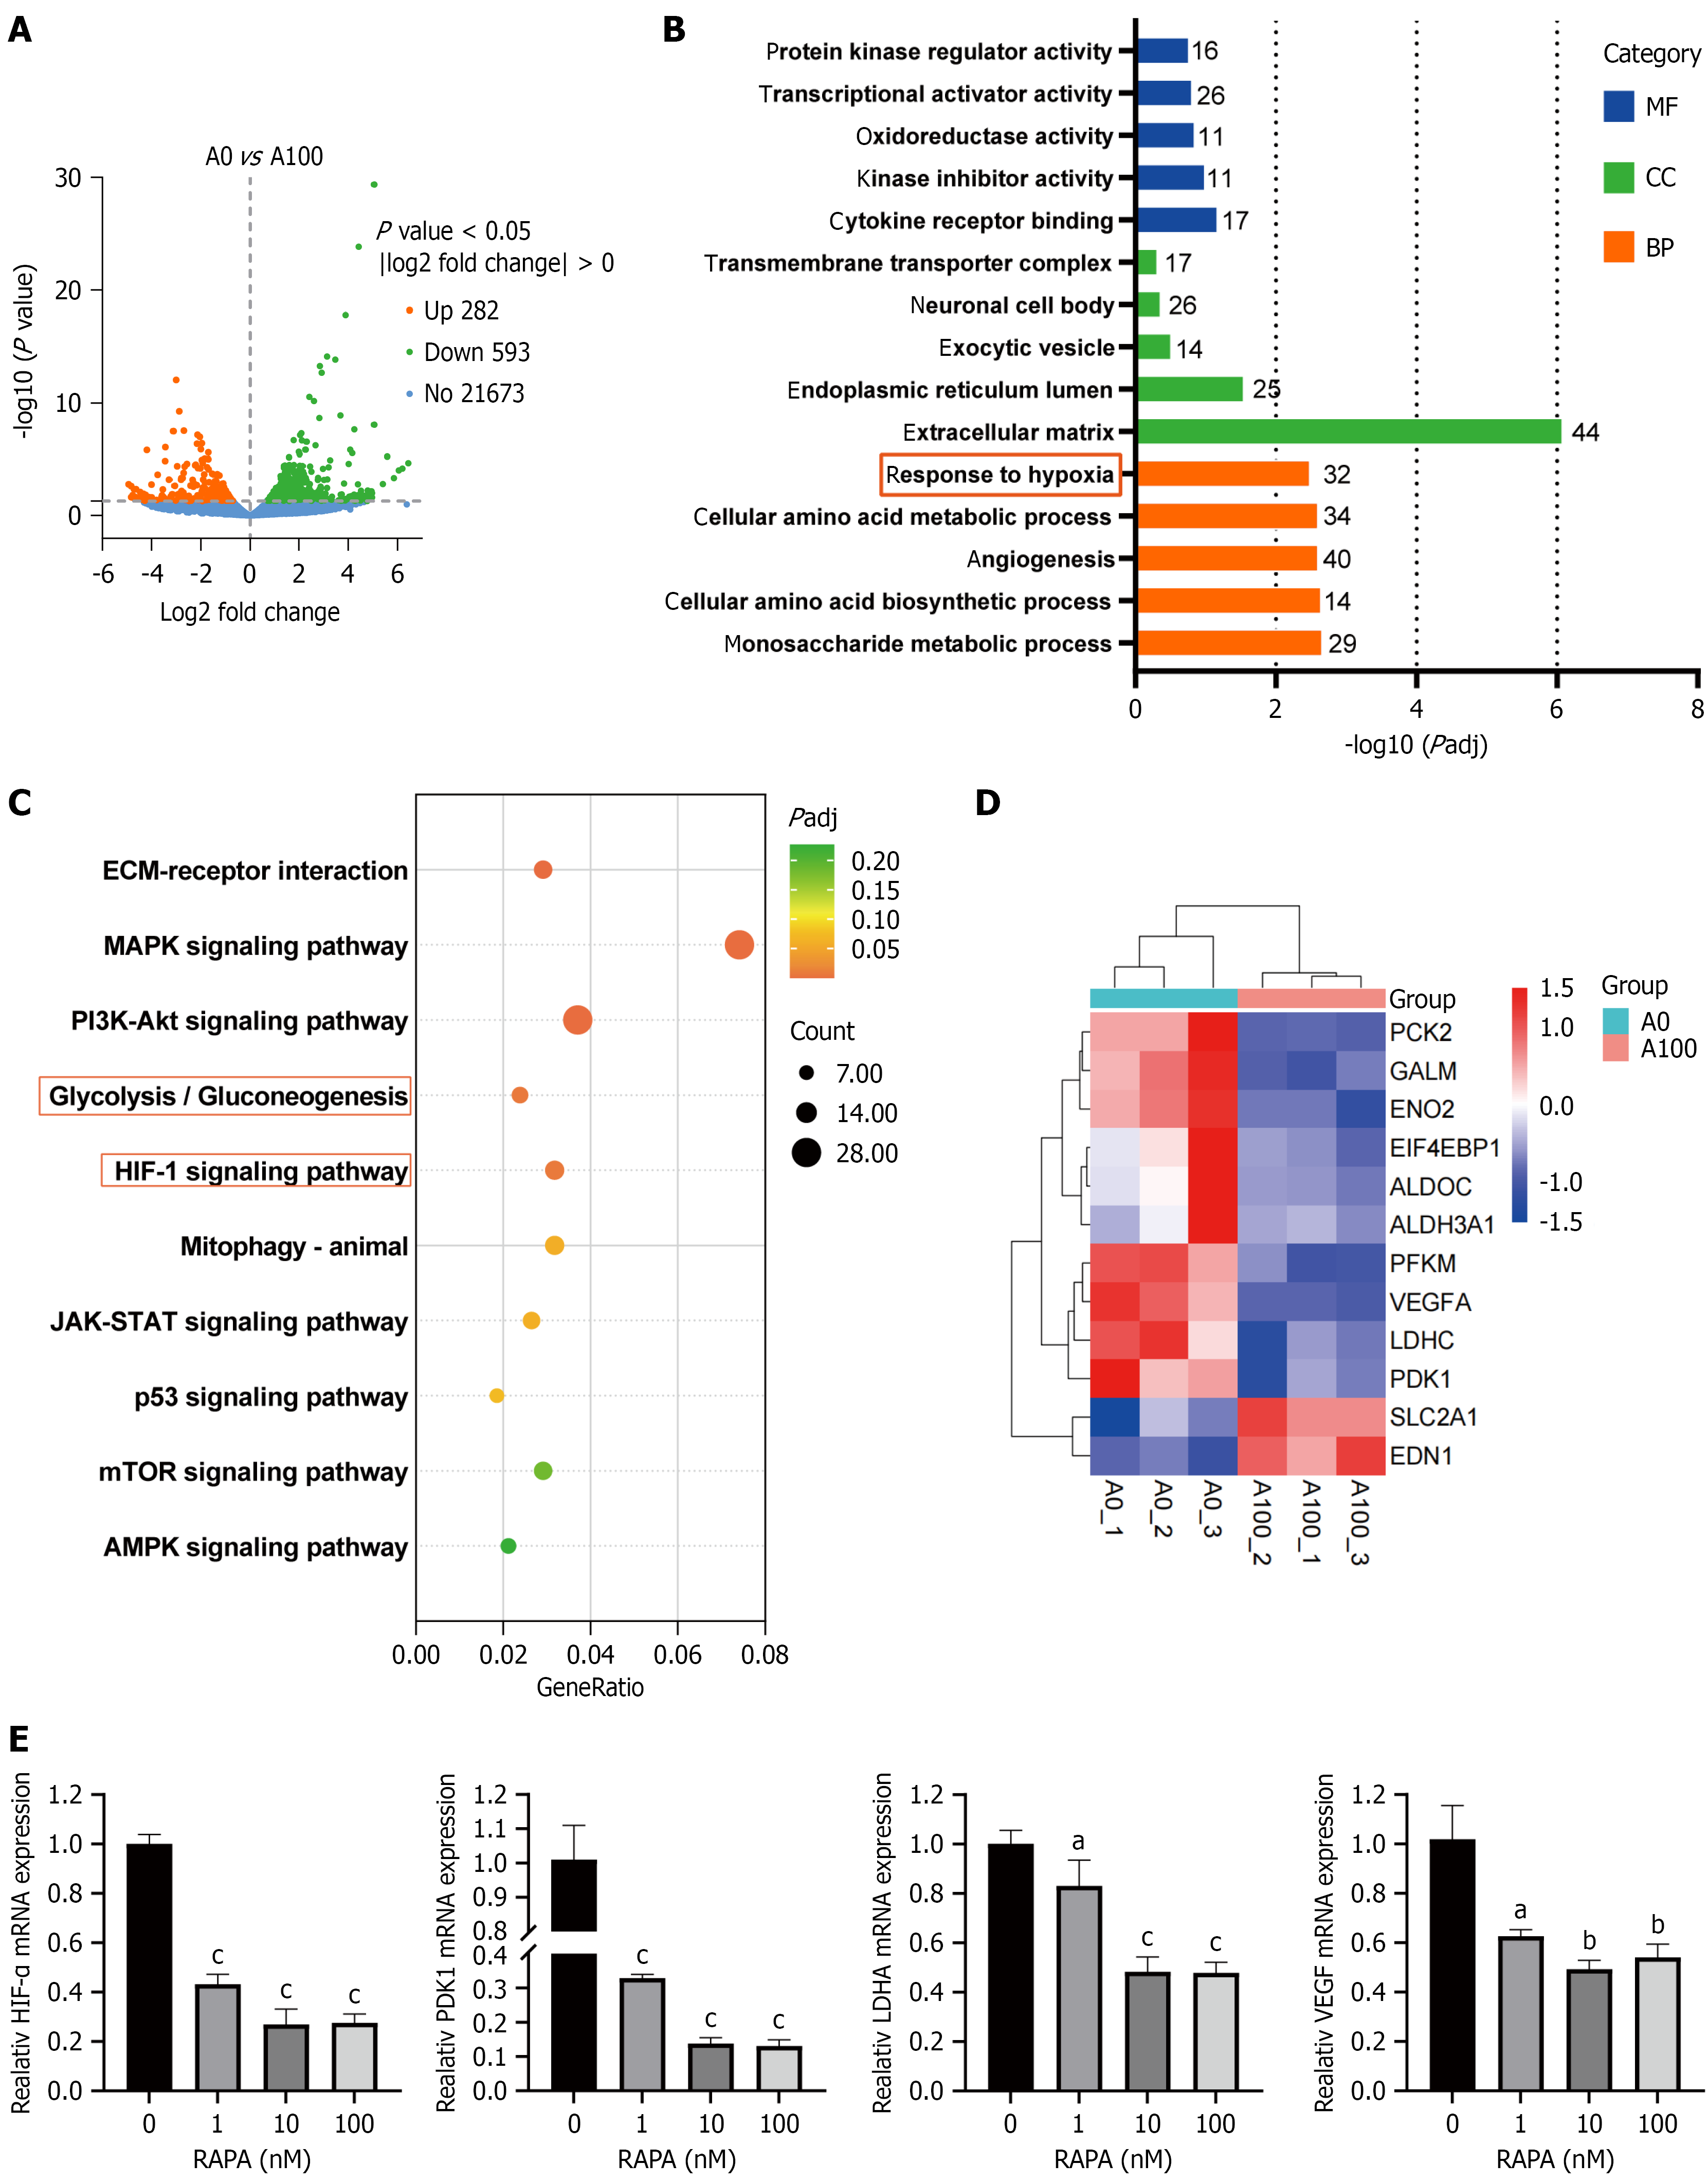
Figure 4 RNA sequencing results of rapamycin treatment with HUTU 80 cells.
A: Volcano plot showed the number of differentially expressed genes (DEGs) in the rapamycin (RAPA) group and the control group; B: Gene Ontology enrichment analysis related to antitumor functions; C: Selection of the top 10 Kyoto Encyclopedia of Genes and Genomes pathways related to antitumor effects; D: Heatmap displayed DEGs involved in the hypoxia-inducible factor (HIF)-1α and glycolysis/gluconeogenesis pathways; E: Quantitative polymerase chain reaction was used to detect the messenger RNA expression levels of HIF-1α, PDK1, LDHA and VEGF in RAPA-treated HUTU 80 cells. Data are presented as the mean ± SD (n = 3). aP < 0.05. bP < 0.01. cP < 0.001. RAPA: Rapamycin; MF: Molecular function; CC: Cellular component; BP: Biological process; ECM: Extracellular matrix; MAPK: Mitogen-activated protein kinase; PI3K/Akt: Phosphatidylinositol 3-kinase/protein kinase B; JAK/STAT: Janus tyrosine kinase/signal transducer and activator of transcription; mTOR: Mammalian target of rapamycin; AMPK: Adenosine 5’-monophosphate-activated protein kinase; HIF-1α: Hypoxia-inducible factor-1α; mRNA: Messenger RNA.
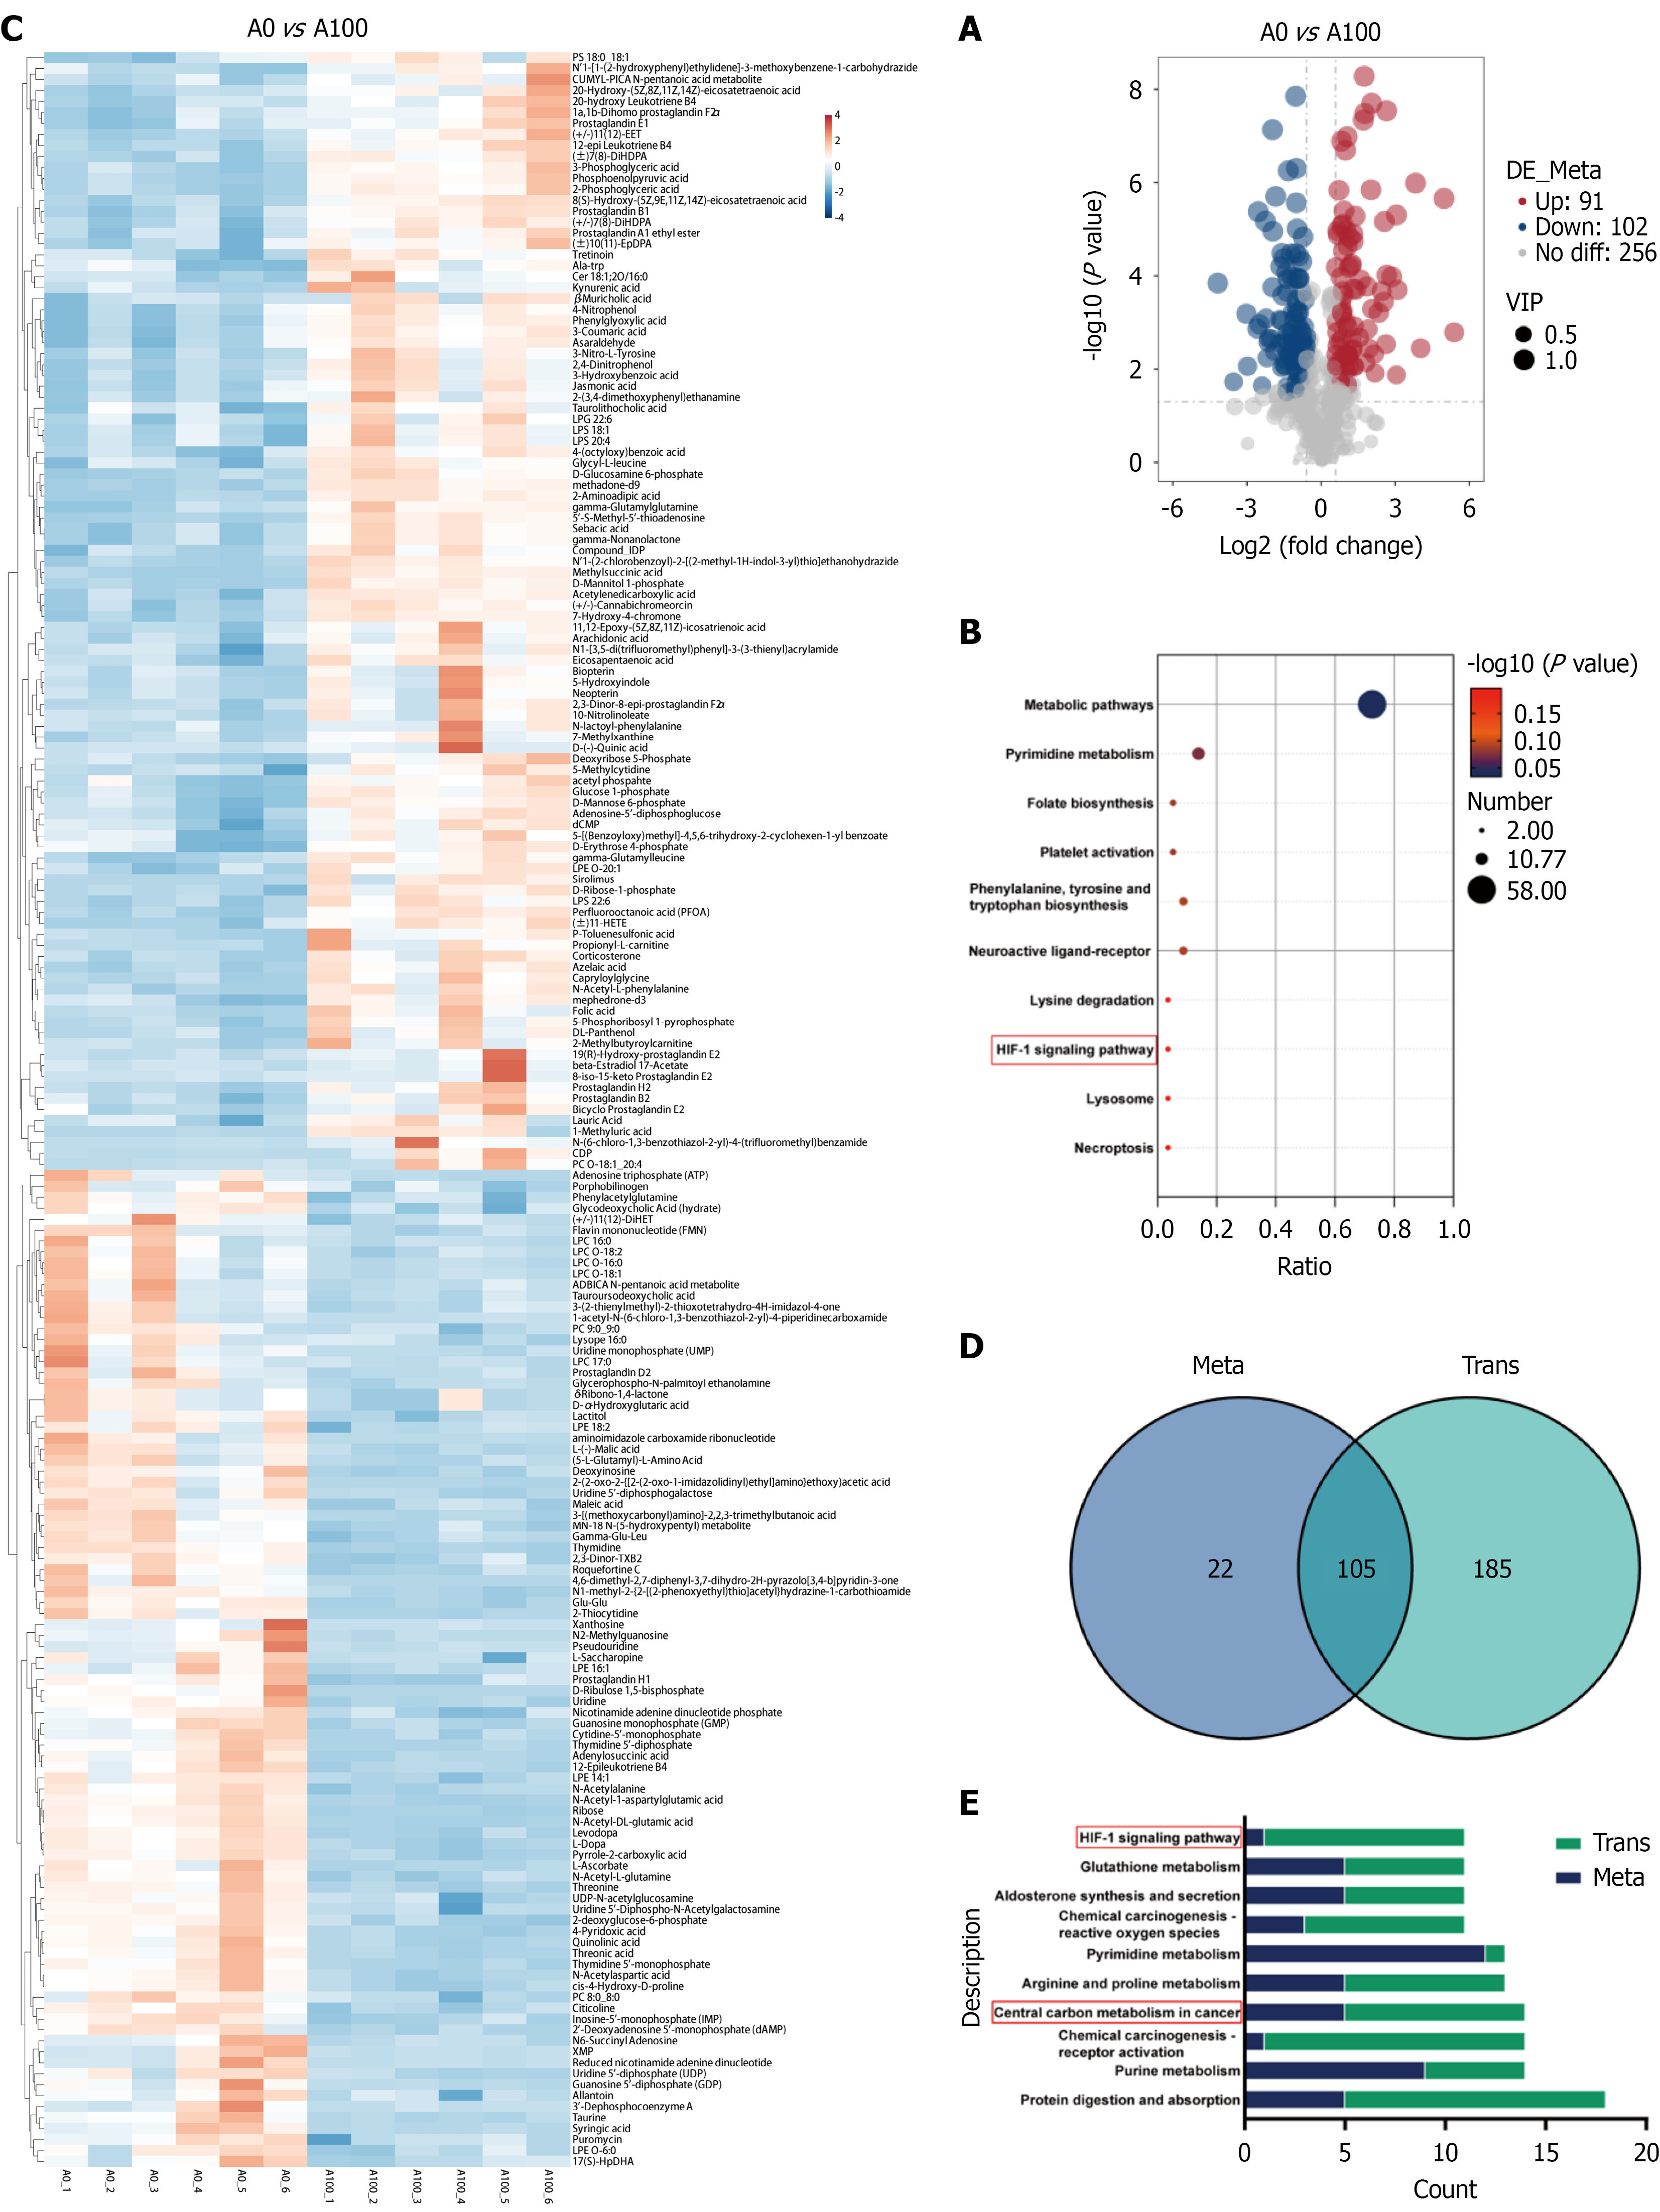
Figure 5 Metabolome results of rapamycin treatment with HUTU 80 cells and combined omics analysis.
A: Volcano plot demonstrated the quantity of different metabolites; B: Kyoto Encyclopedia of Genes and Genomes (KEGG) enrichment analysis revealed the top 10 metabolomic pathways related to antitumor effects; C: Heatmap displayed differential metabolites; D: Venn diagram revealed the number of KEGG pathways commonly annotated by different molecules in the transcriptome and metabolome; E: Bar graph displaying the top 10 KEGG pathways with the total number of differential molecules related to anti-cancer properties selected from two groups (number of different genes and number of different metabolites). VIP: Variable importance in projection; HIF-1α: Hypoxia-inducible factor-1α.
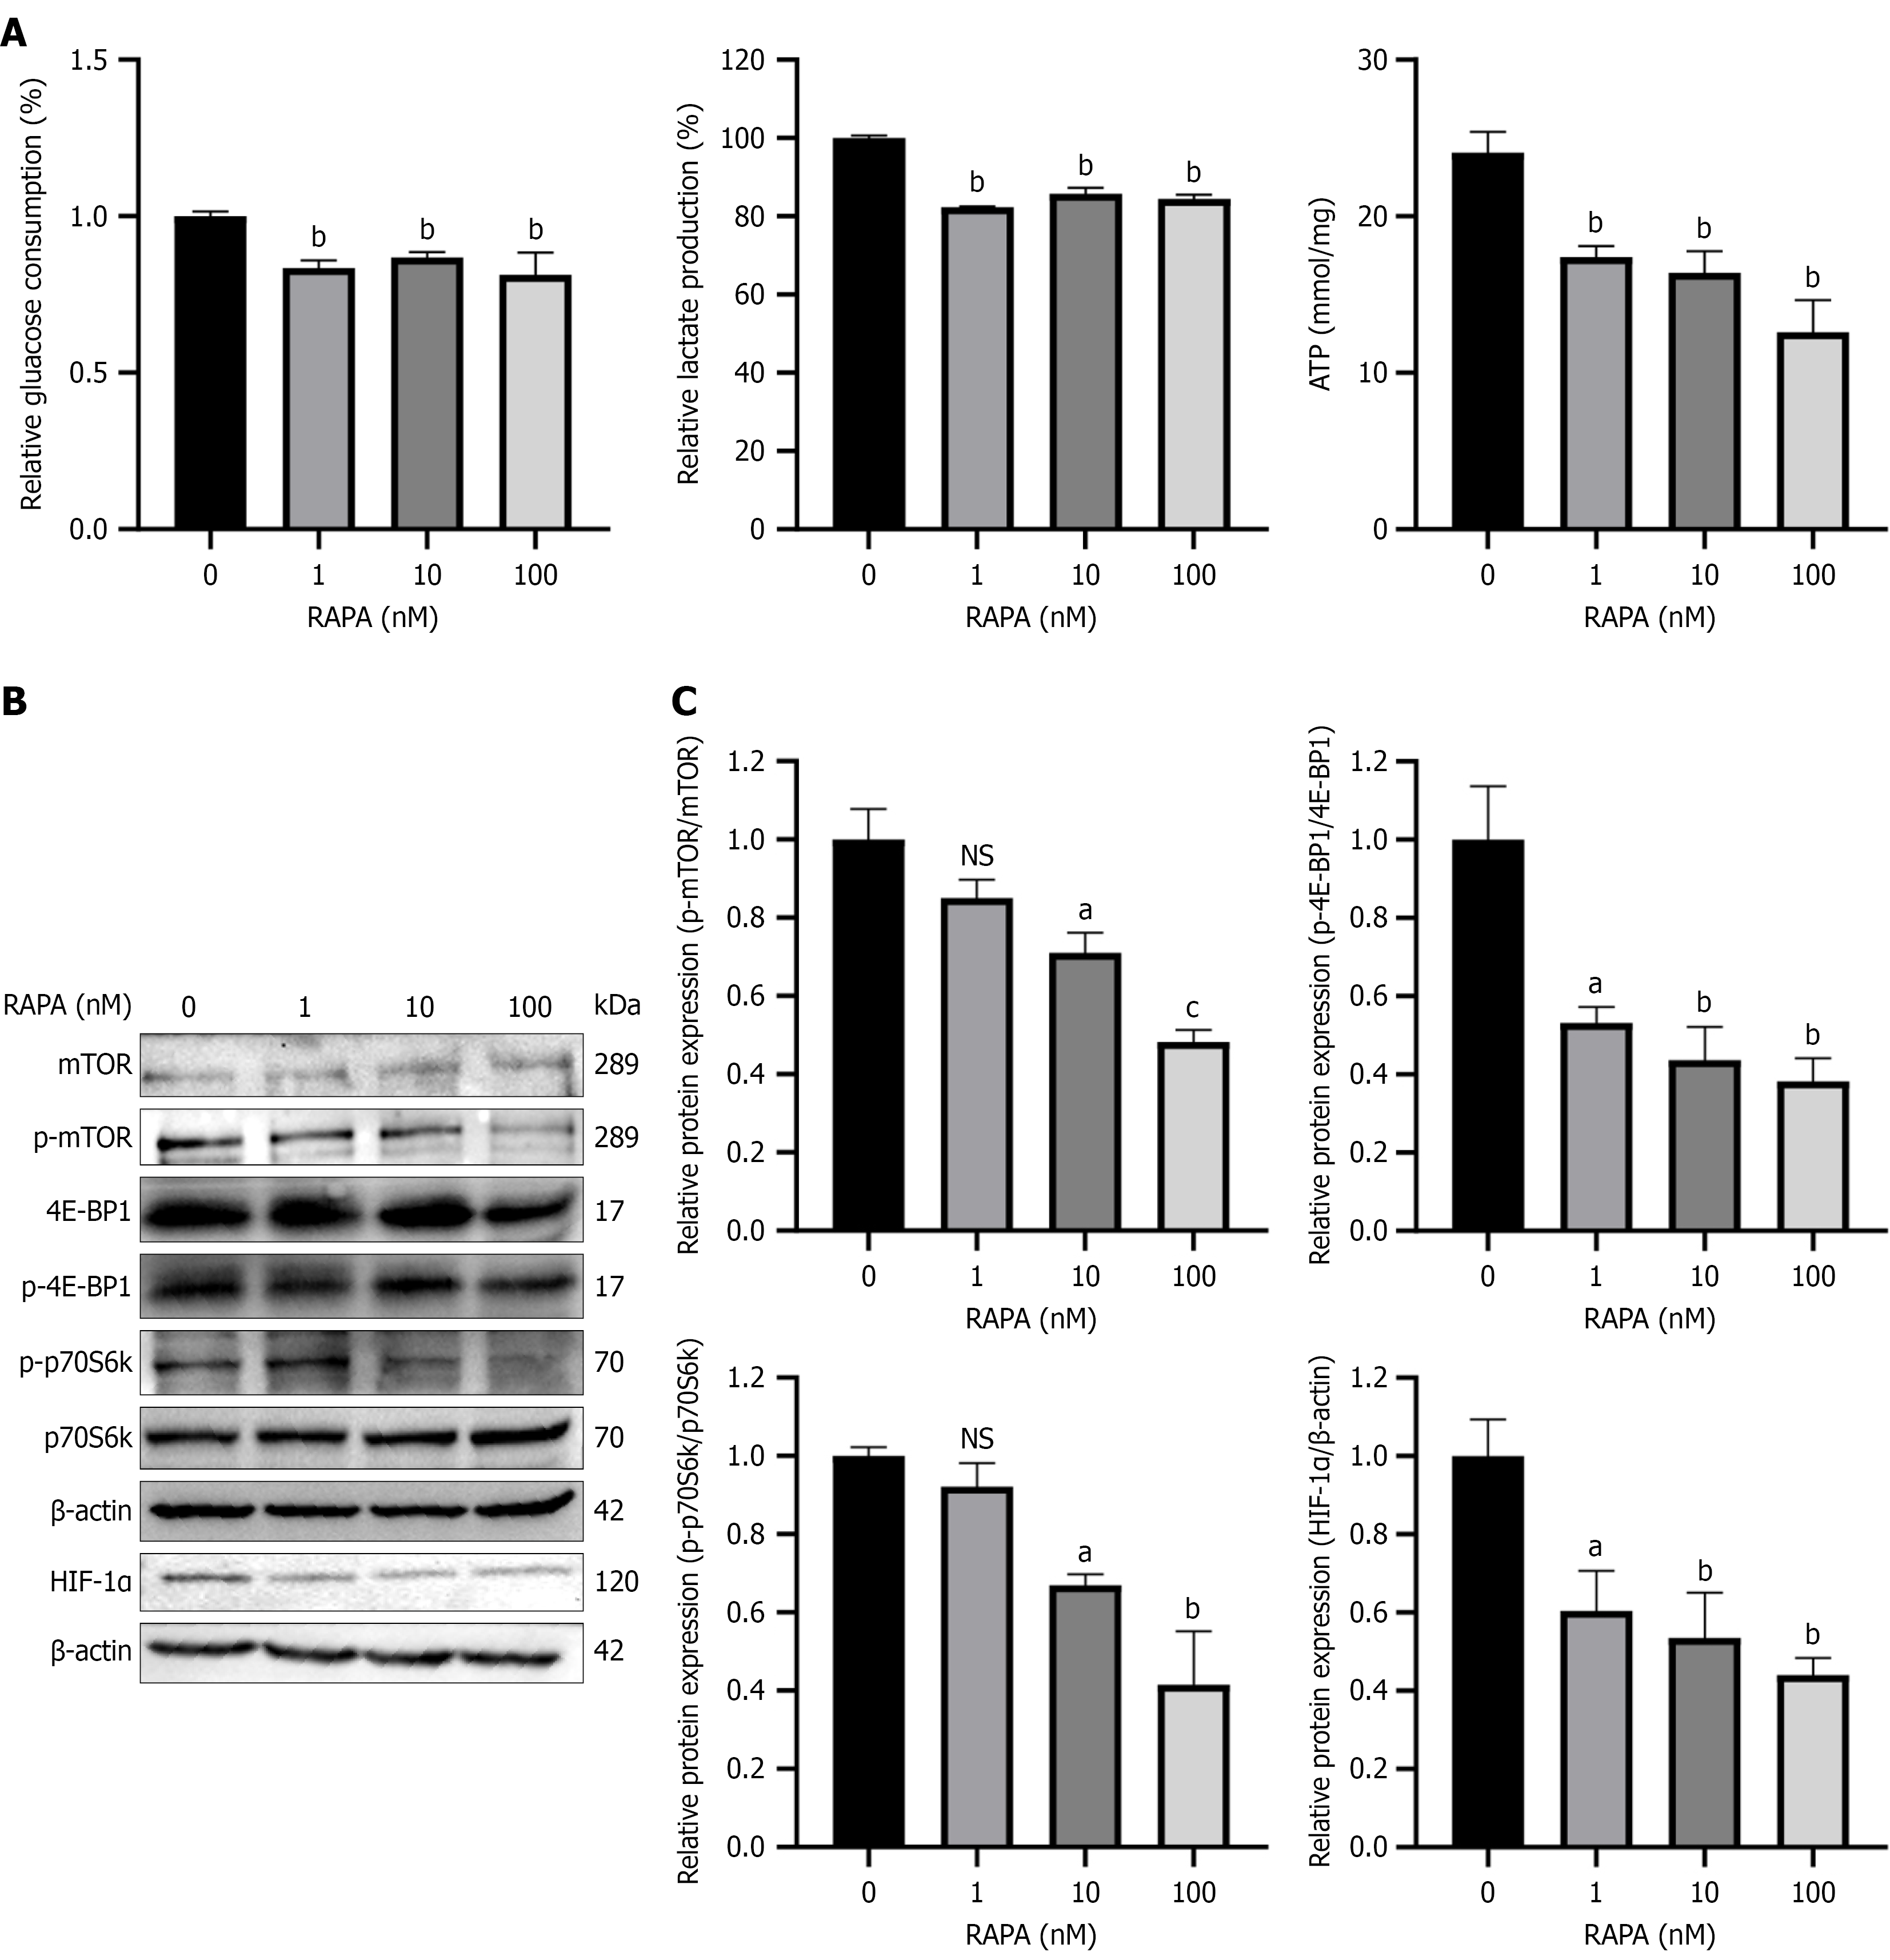
Figure 6 Rapamycin inhibited glycolysis in HUTU 80 cells via inhibition of the mammalian target of rapamycin/hypoxia-inducible facto-1α pathway.
A: Measurement of glucose consumption, lactate production and adenosine triphosphate generation to reflect the glycolytic metabolism of HUTU 80 cells; B: Protein levels were assayed after treatment of HUTU 80 cells with rapamycin, including mammalian target of rapamycin (mTOR), eukaryotic translation initiation factor 4E-binding protein 1 (4E-BP1) and 70 kDa ribosomal protein S6 kinase (p70S6k), phosphorylated (p)-mTOR, p-4E-BP1 and p-p70S6k and hypoxia-inducible facto-1α; C: Quantification of protein expression using ImageJ. Data are presented as the mean ± SD (n = 3). aP < 0.05. bP < 0.01. cP < 0.001. HIF-1α: Hypoxia-inducible factor-1α; ns: No significance; RAPA: Rapamycin; ATP: Adenosine triphosphate; mTOR: Mammalian target of rapamycin; p-mTOR: Phosphorylated-mammalian target of rapamycin; 4E-BP1: Eukaryotic translation initiation factor 4E-binding protein 1; p-4E-BP1: Phosphorylated-eukaryotic translation initiation factor 4E-binding protein 1; p70S6k: 70 kDa ribosomal protein S6 kinase; p-p70S6k: Phosphorylated-70 kDa ribosomal protein S6 kinase.
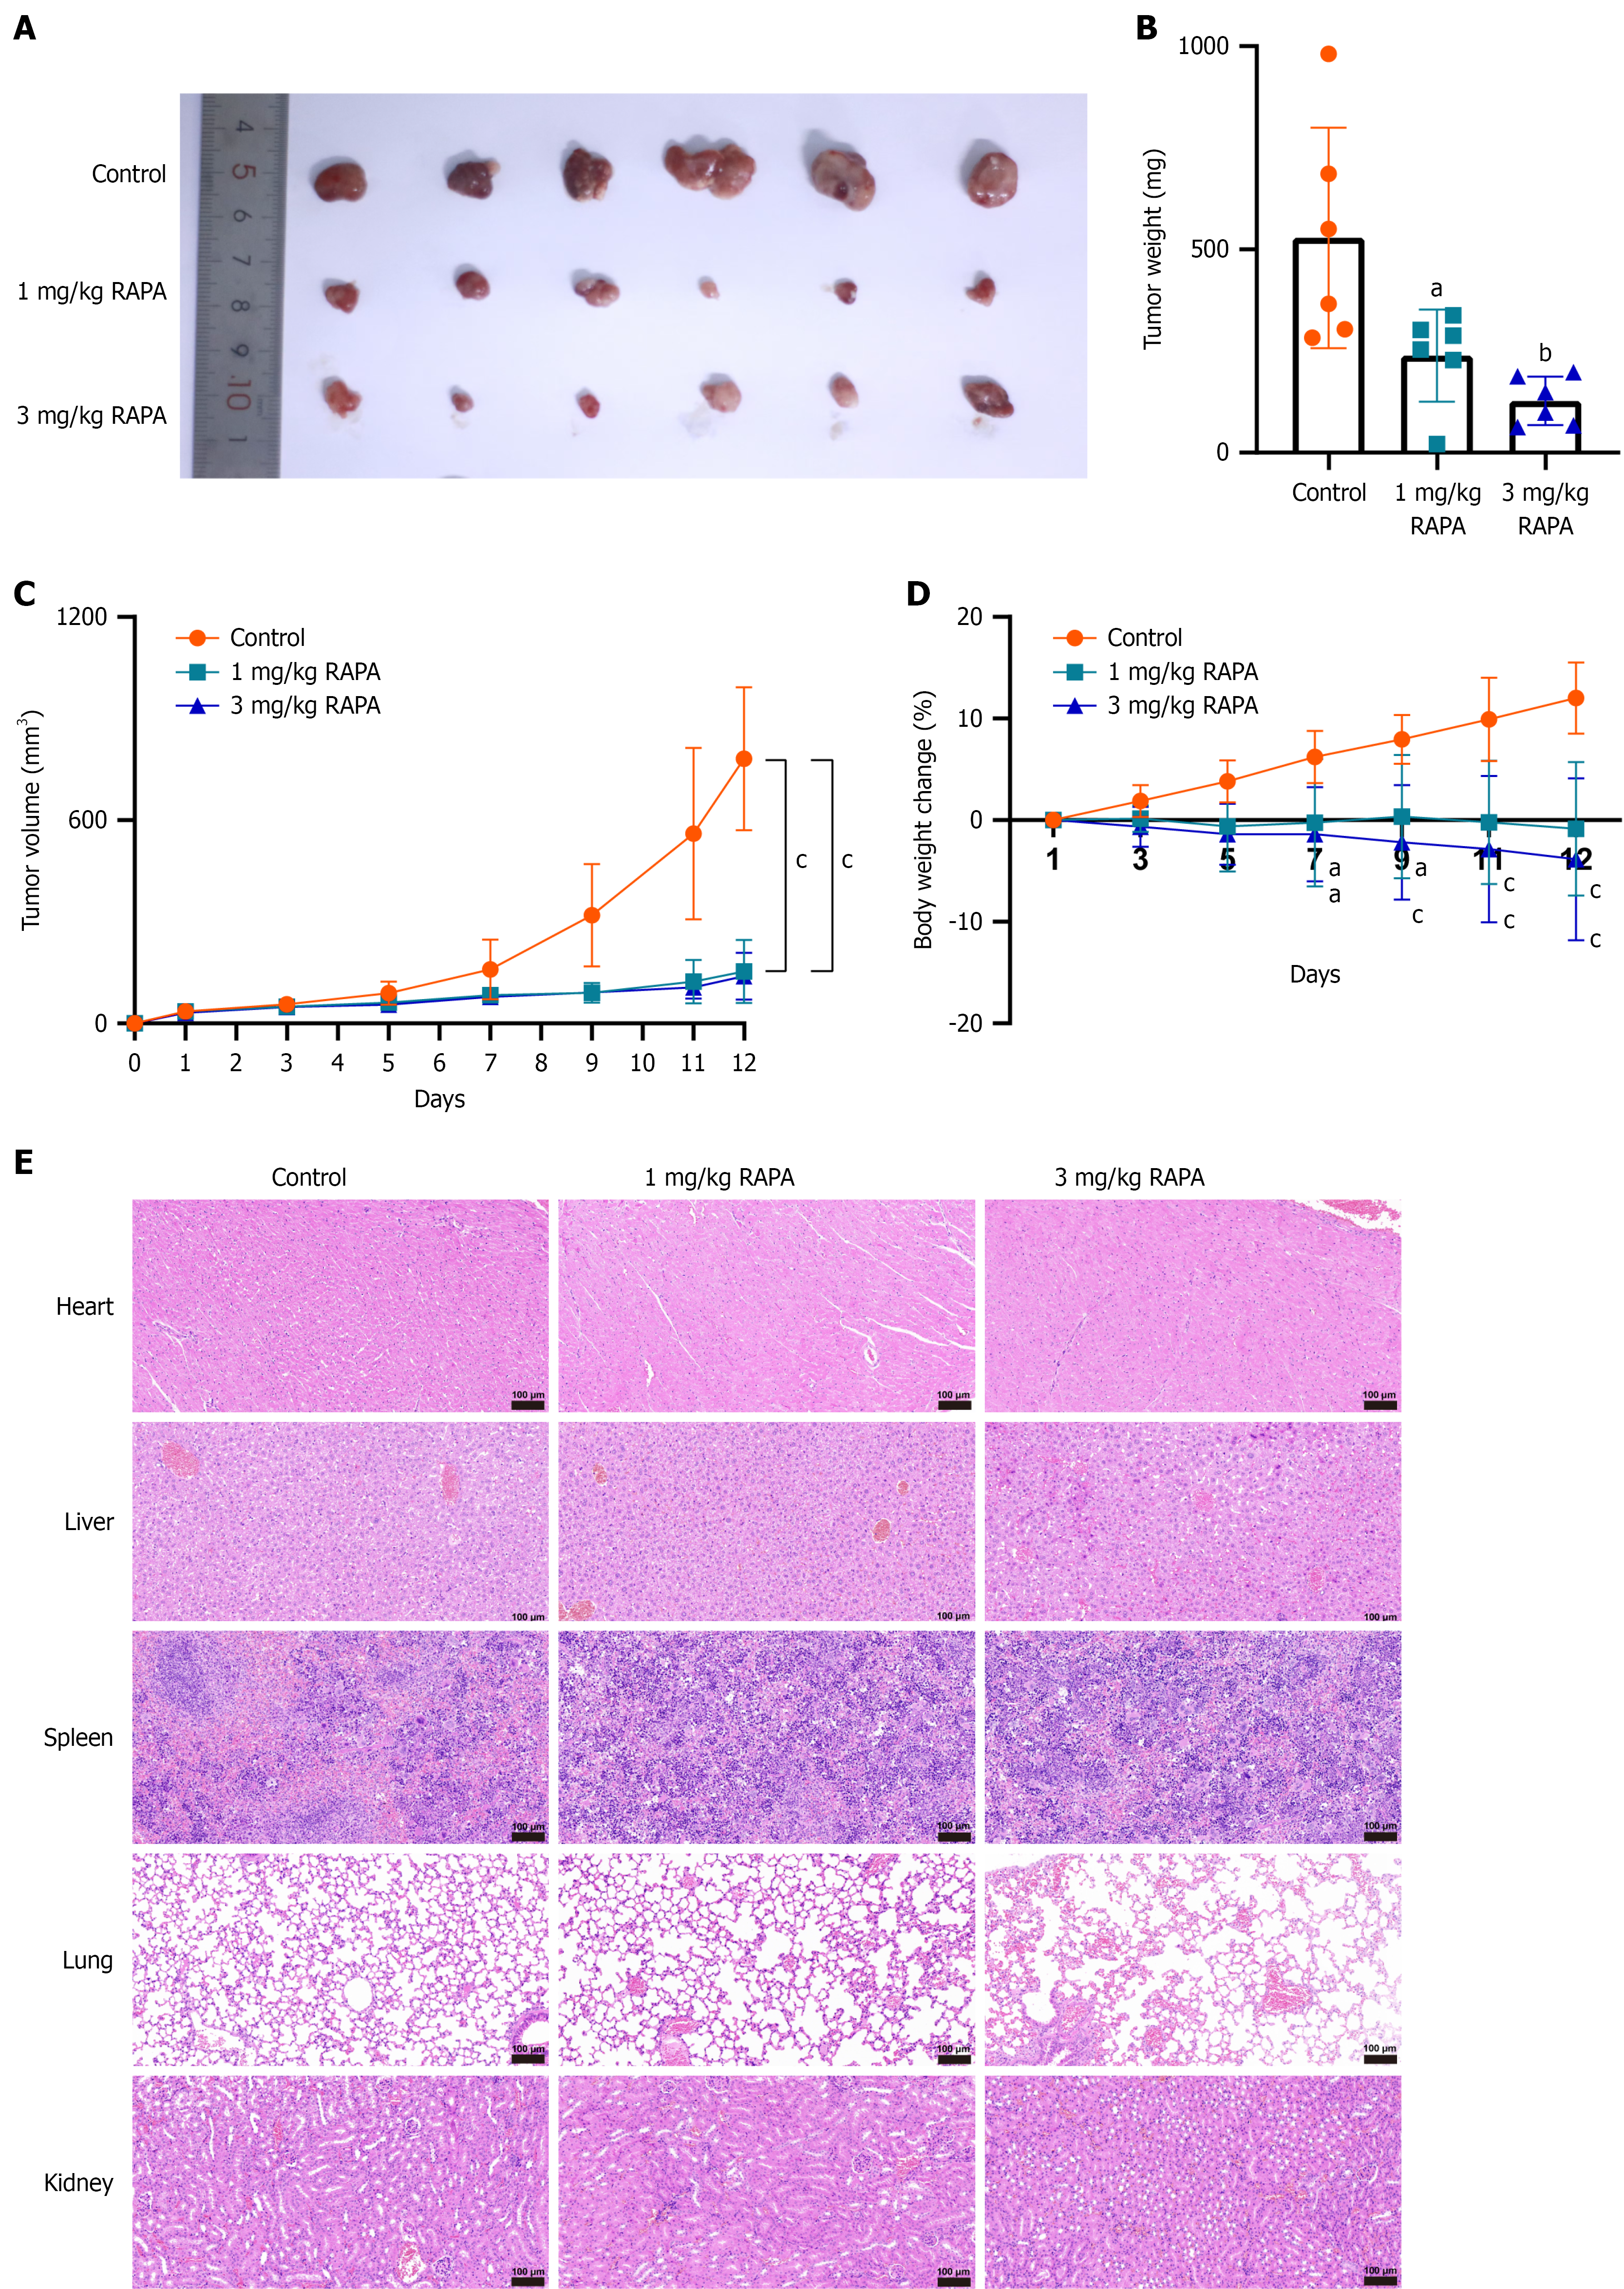
Figure 7 Effects of rapamycin on HUTU 80 cells proliferation in vivo.
A: Tumor anatomies showing the subcutaneous xenograft model with different treatments of HUTU 80 cells as well as the tumor anatomy of the euthanized mice (n = 6 mice per group); B: Weight of mouse tumors; C: Tumor volume change curves of mice; the tumor volume was calculated as [length (mm) × width (mm) × width (mm)]/2; D: Tumor weight change curves of mice. Data are presented as the mean ± SD (n = 6); E: Hematoxylin-eosin staining of the internal organs of nude mice after different treatments. Data are presented as the mean ± SD (n = 3). aP < 0.05. bP < 0.01. cP < 0.001. RAPA: Rapamycin.
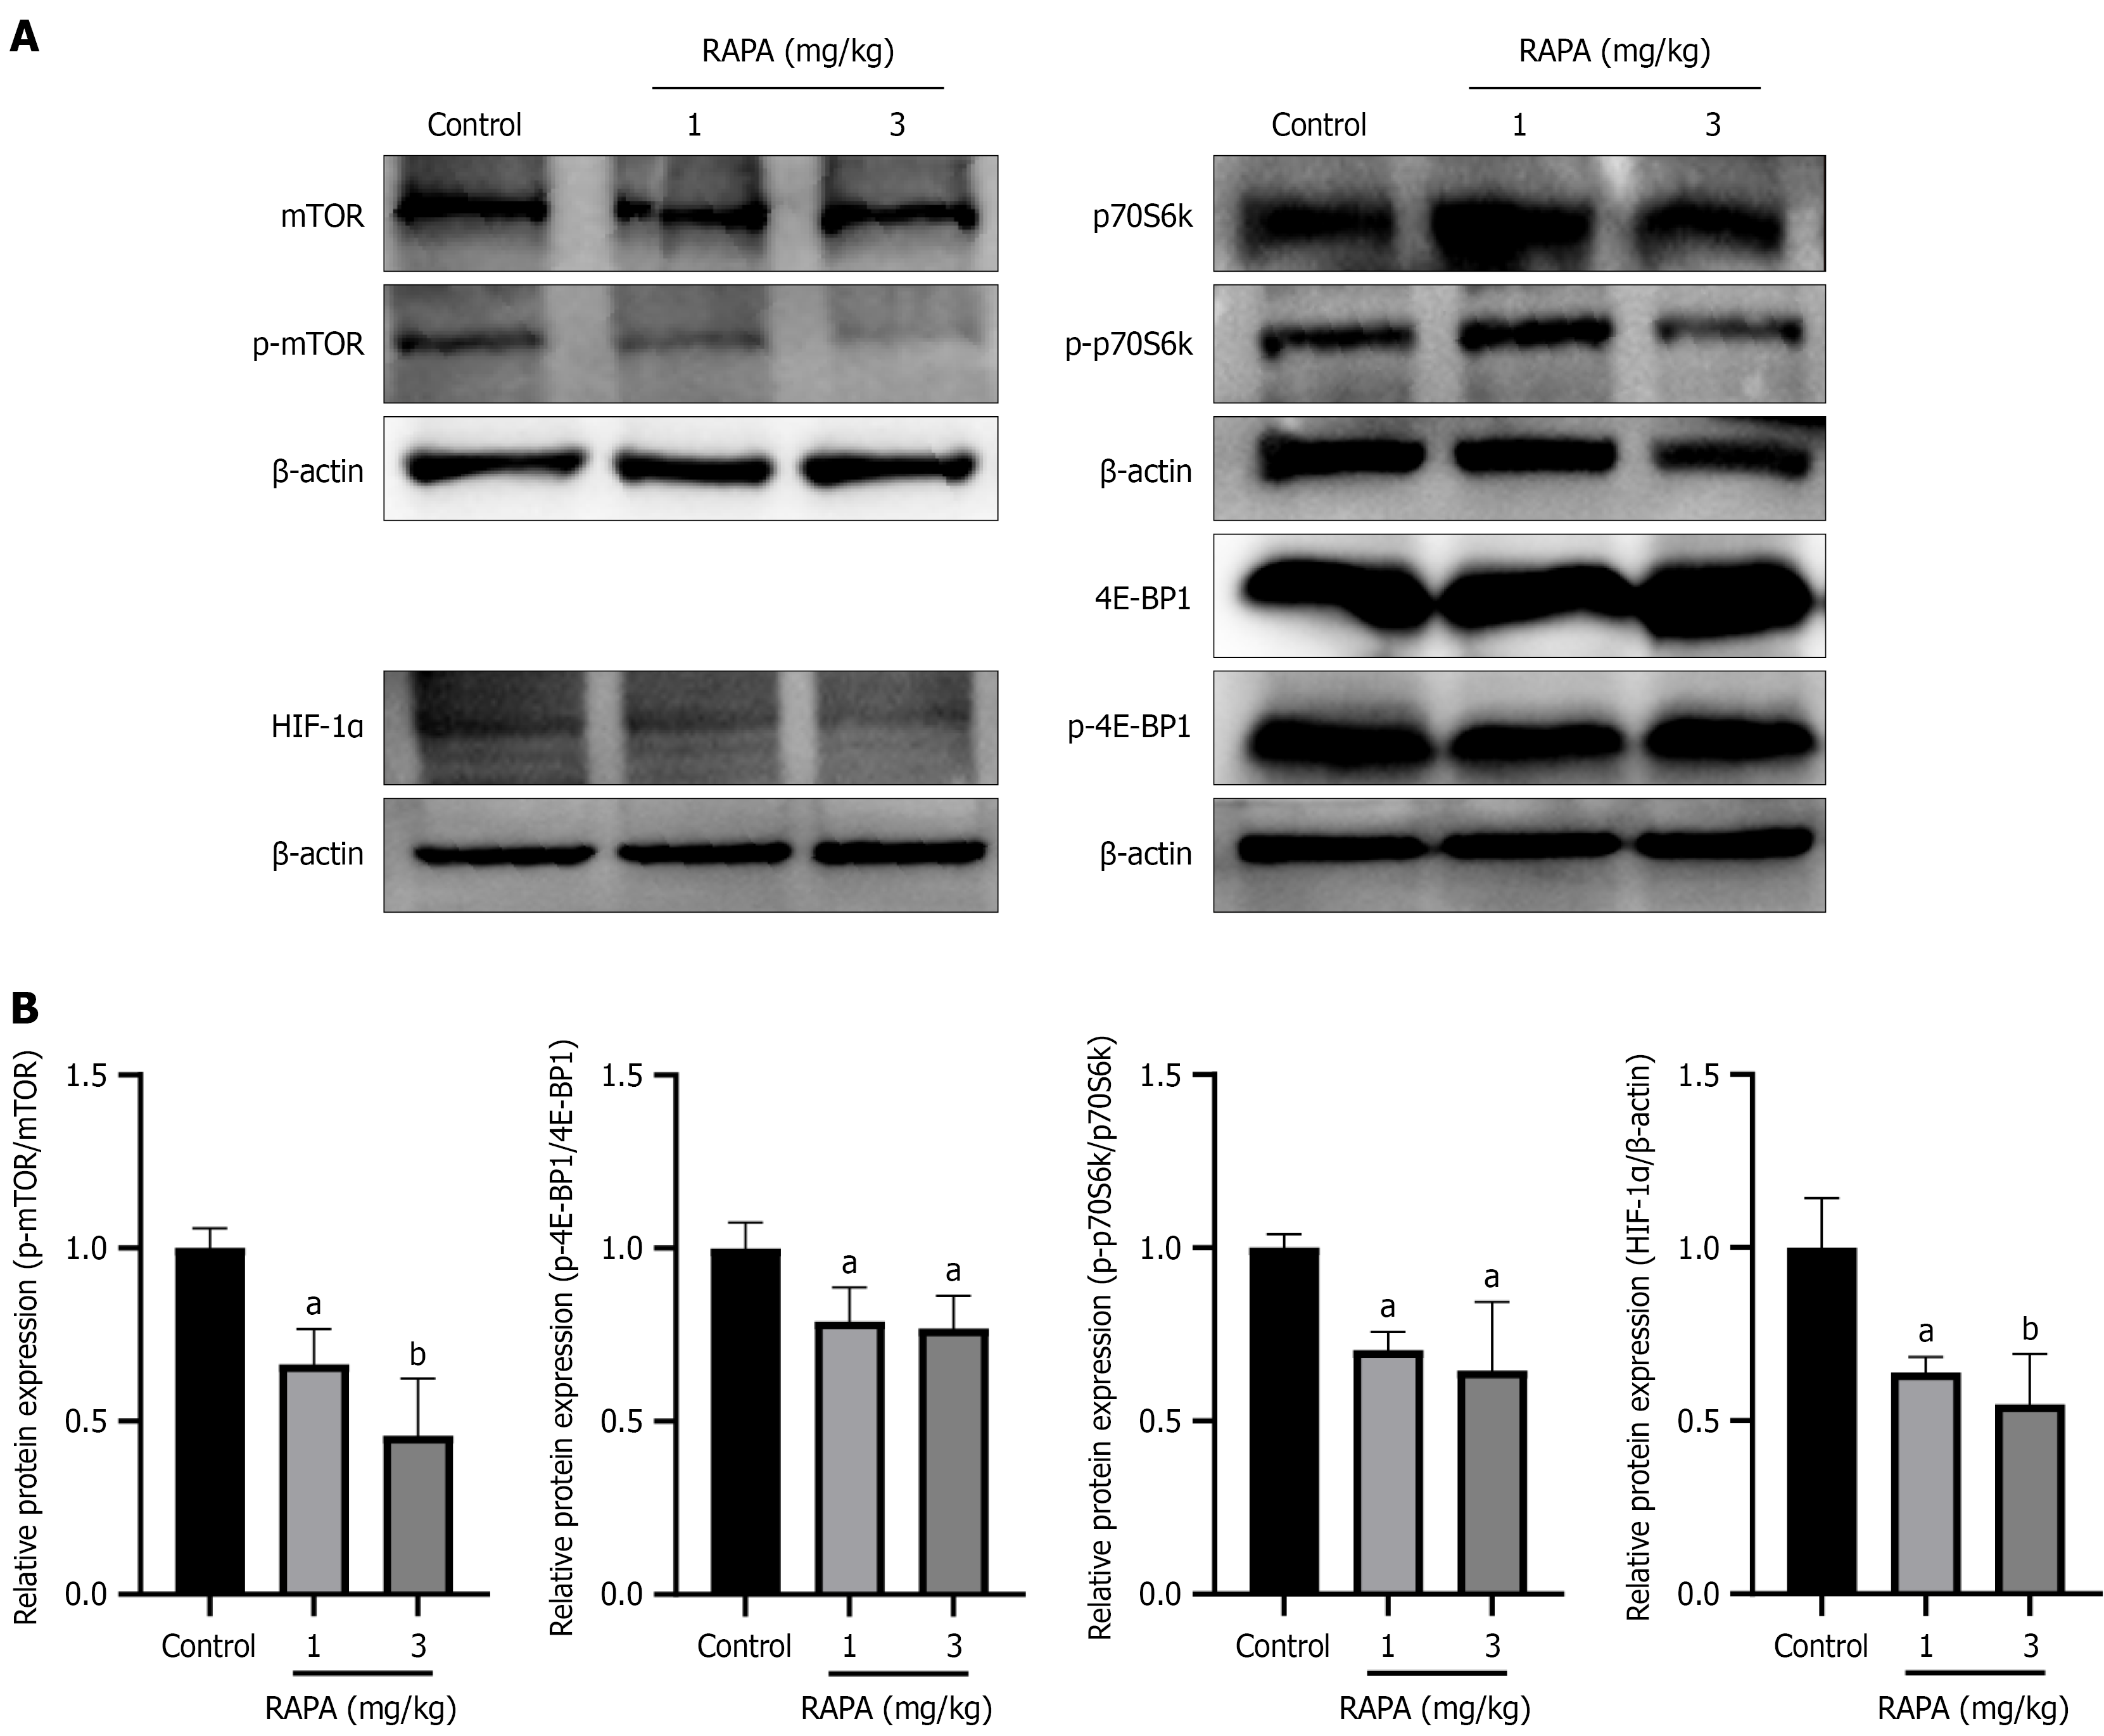
Figure 8 Rapamycin reduces the protein expression of phosphorylated-mammalian target of rapamycin, phosphorylated-eukaryotic translation initiation factor 4E-binding protein 1, phosphorylated-70 kDa ribosomal protein S6 kinase and hypoxia-inducible factor-1α in tumors in vivo.
A: Protein levels were assayed after treatment of tumors with rapamycin, including mammalian target of rapamycin (mTOR), eukaryotic translation initiation factor 4E-binding protein 1 (4E-BP1) and 70 kDa ribosomal protein S6 kinase (p70S6k), phosphorylated (p)-mTOR, p-4E-BP1 and p-p70S6k and hypoxia-inducible facto-1α; B: Quantification of protein expression using ImageJ. Data are presented as the mean ± SD (n = 3). aP < 0.05. bP < 0.01. RAPA: Rapamycin; mTOR: Mammalian target of rapamycin; p-mTOR: Phosphorylated-mammalian target of rapamycin; 4E-BP1: Eukaryotic translation initiation factor 4E-binding protein 1; p-4E-BP1: Phosphorylated-eukaryotic translation initiation factor 4E-binding protein 1; p70S6k: 70 kDa ribosomal protein S6 kinase; p-p70S6k: Phosphorylated-70 kDa ribosomal protein S6 kinase.
- Citation: Pu BP, Wang PH, Guo KK, Liu C, Chen SR, Li XM, Chen SM, Zeng XZ, Gao C. Rapamycin suppresses small bowel adenocarcinoma HUTU 80 cells proliferation by inhibiting hypoxia-inducible factor-1α mediated metabolic reprogramming. World J Gastrointest Oncol 2025; 17(9): 109378
- URL: https://www.wjgnet.com/1948-5204/full/v17/i9/109378.htm
- DOI: https://dx.doi.org/10.4251/wjgo.v17.i9.109378


