Copyright
©The Author(s) 2025.
World J Hepatol. Sep 27, 2025; 17(9): 110384
Published online Sep 27, 2025. doi: 10.4254/wjh.v17.i9.110384
Published online Sep 27, 2025. doi: 10.4254/wjh.v17.i9.110384
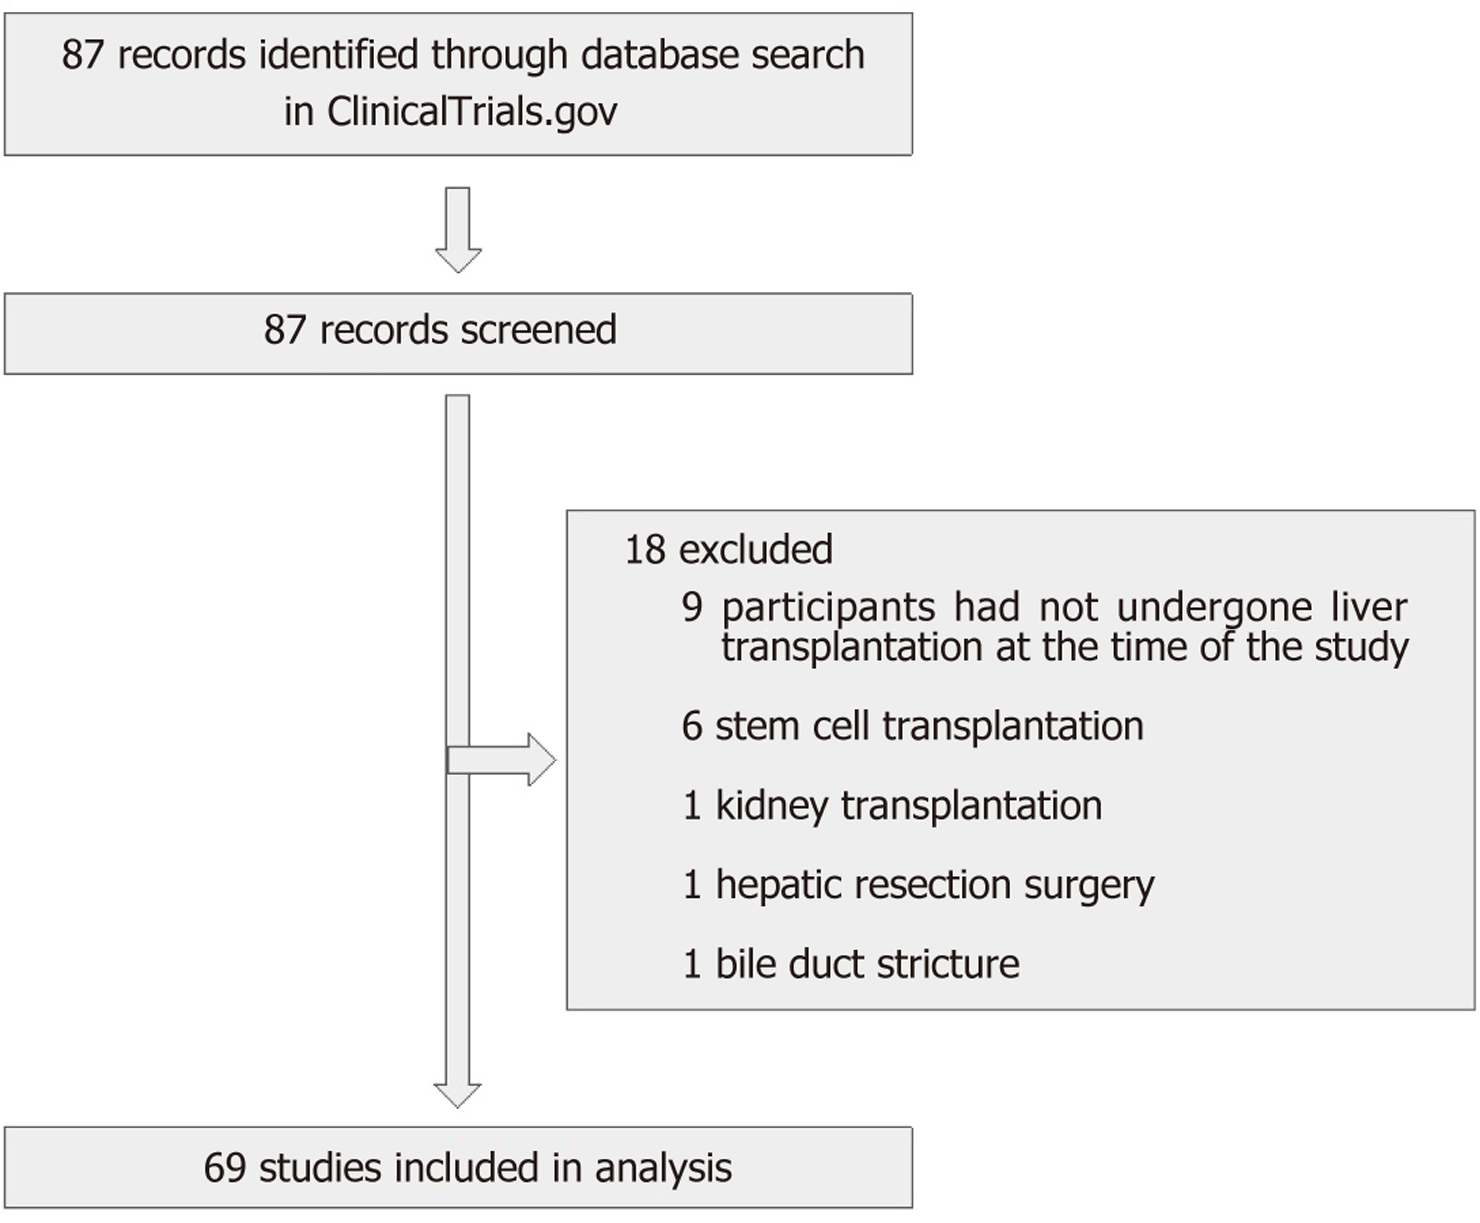
Figure 1 Flow diagram of study selection.
A total of 87 trials were identified through ClinicalTrials.gov (July 2002-July 2018). After screening, 18 trials were excluded due to irrelevant populations or interventions. Sixty-nine trials met inclusion criteria and were included in the final analysis.
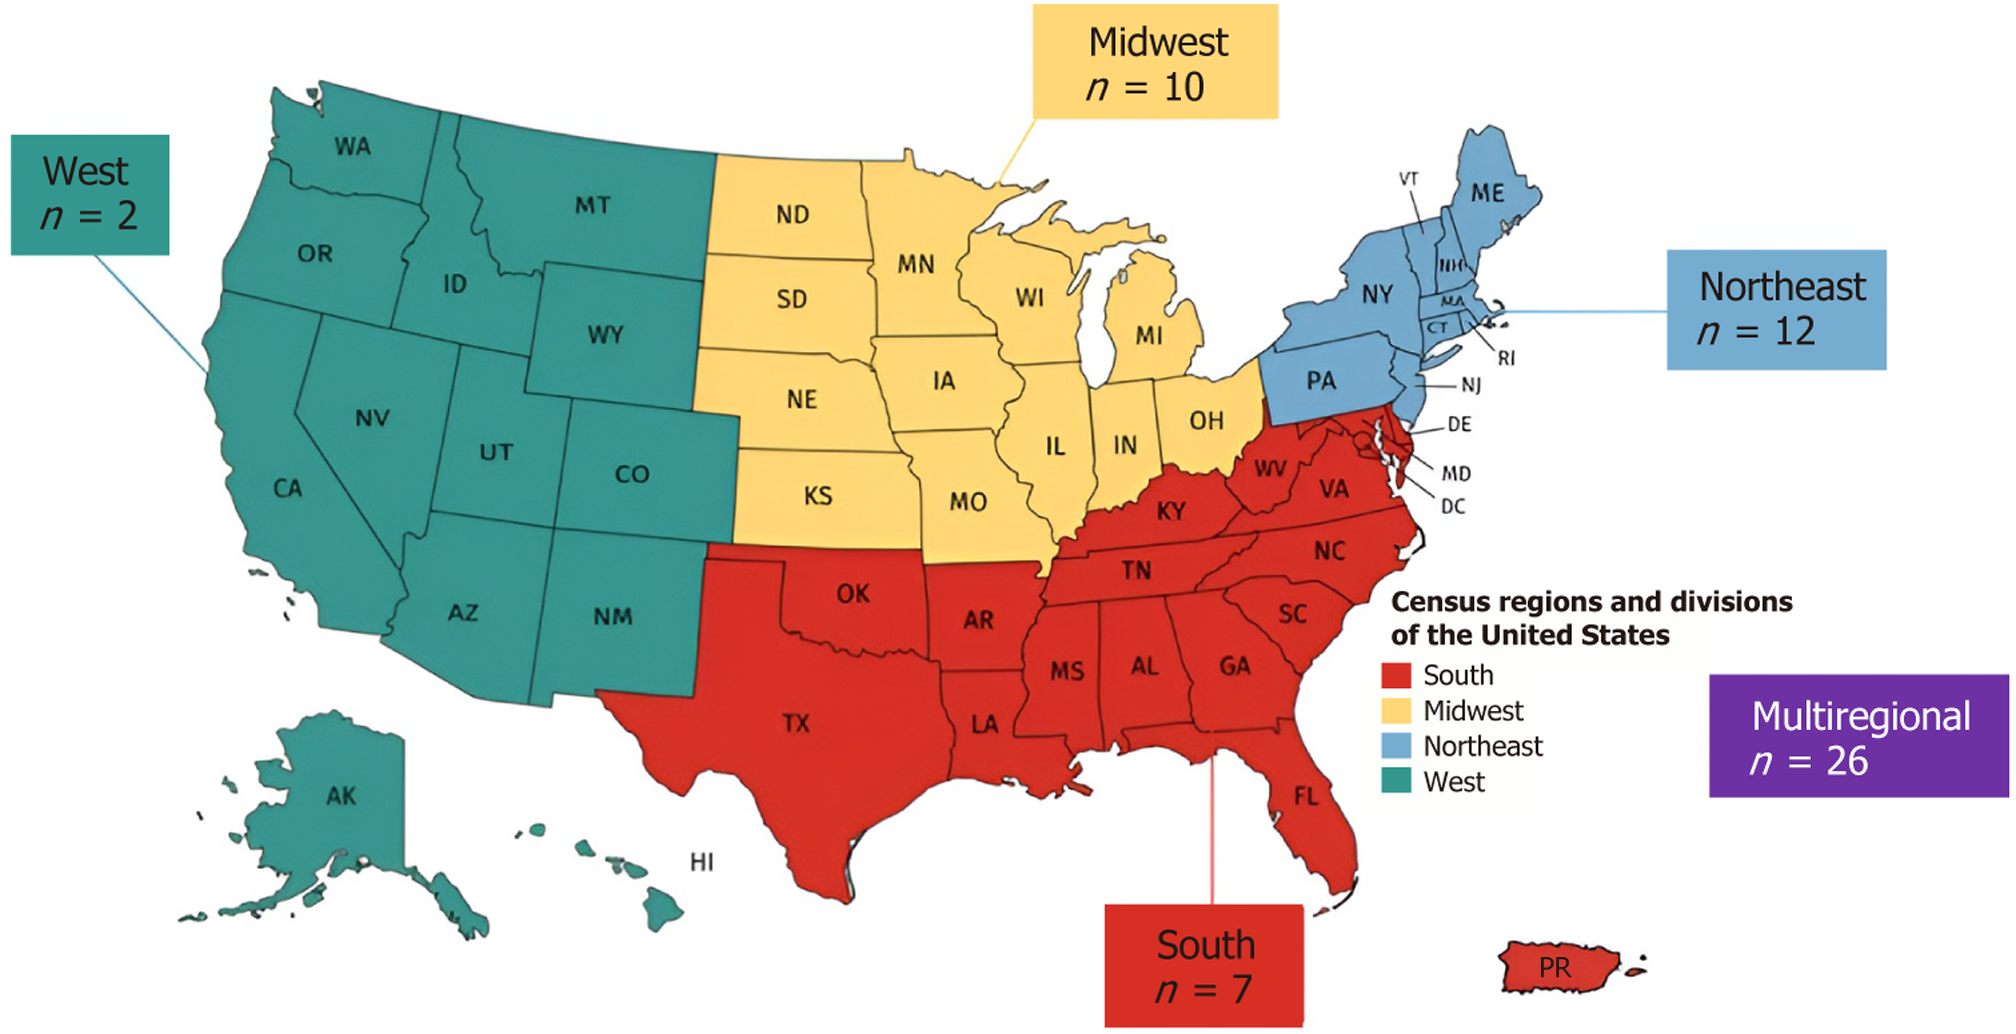
Figure 2 Distribution of clinical trials across regions of the United States.
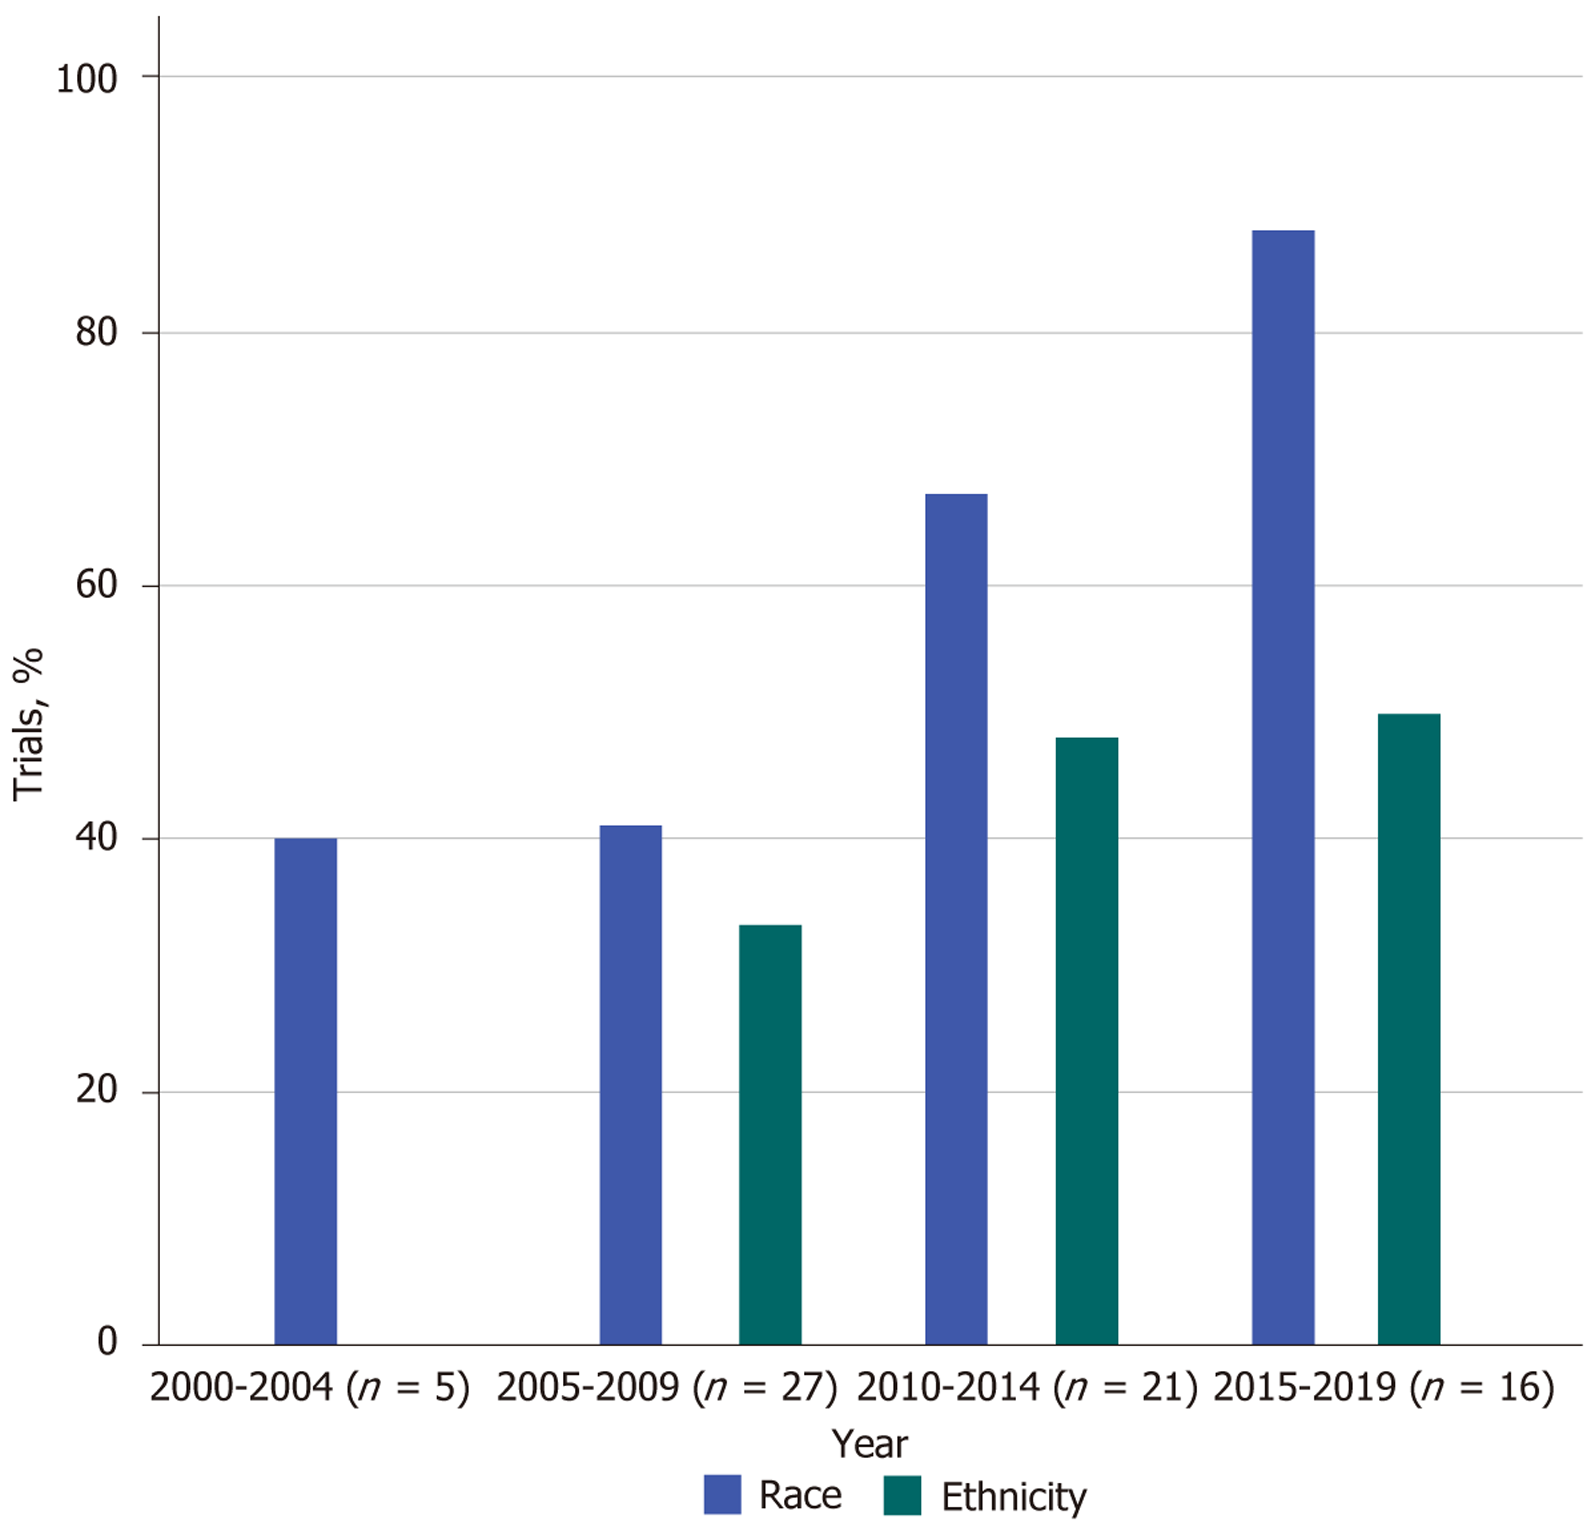
Figure 3 Reporting of race/ethnicity of participants in liver transplantation trials.
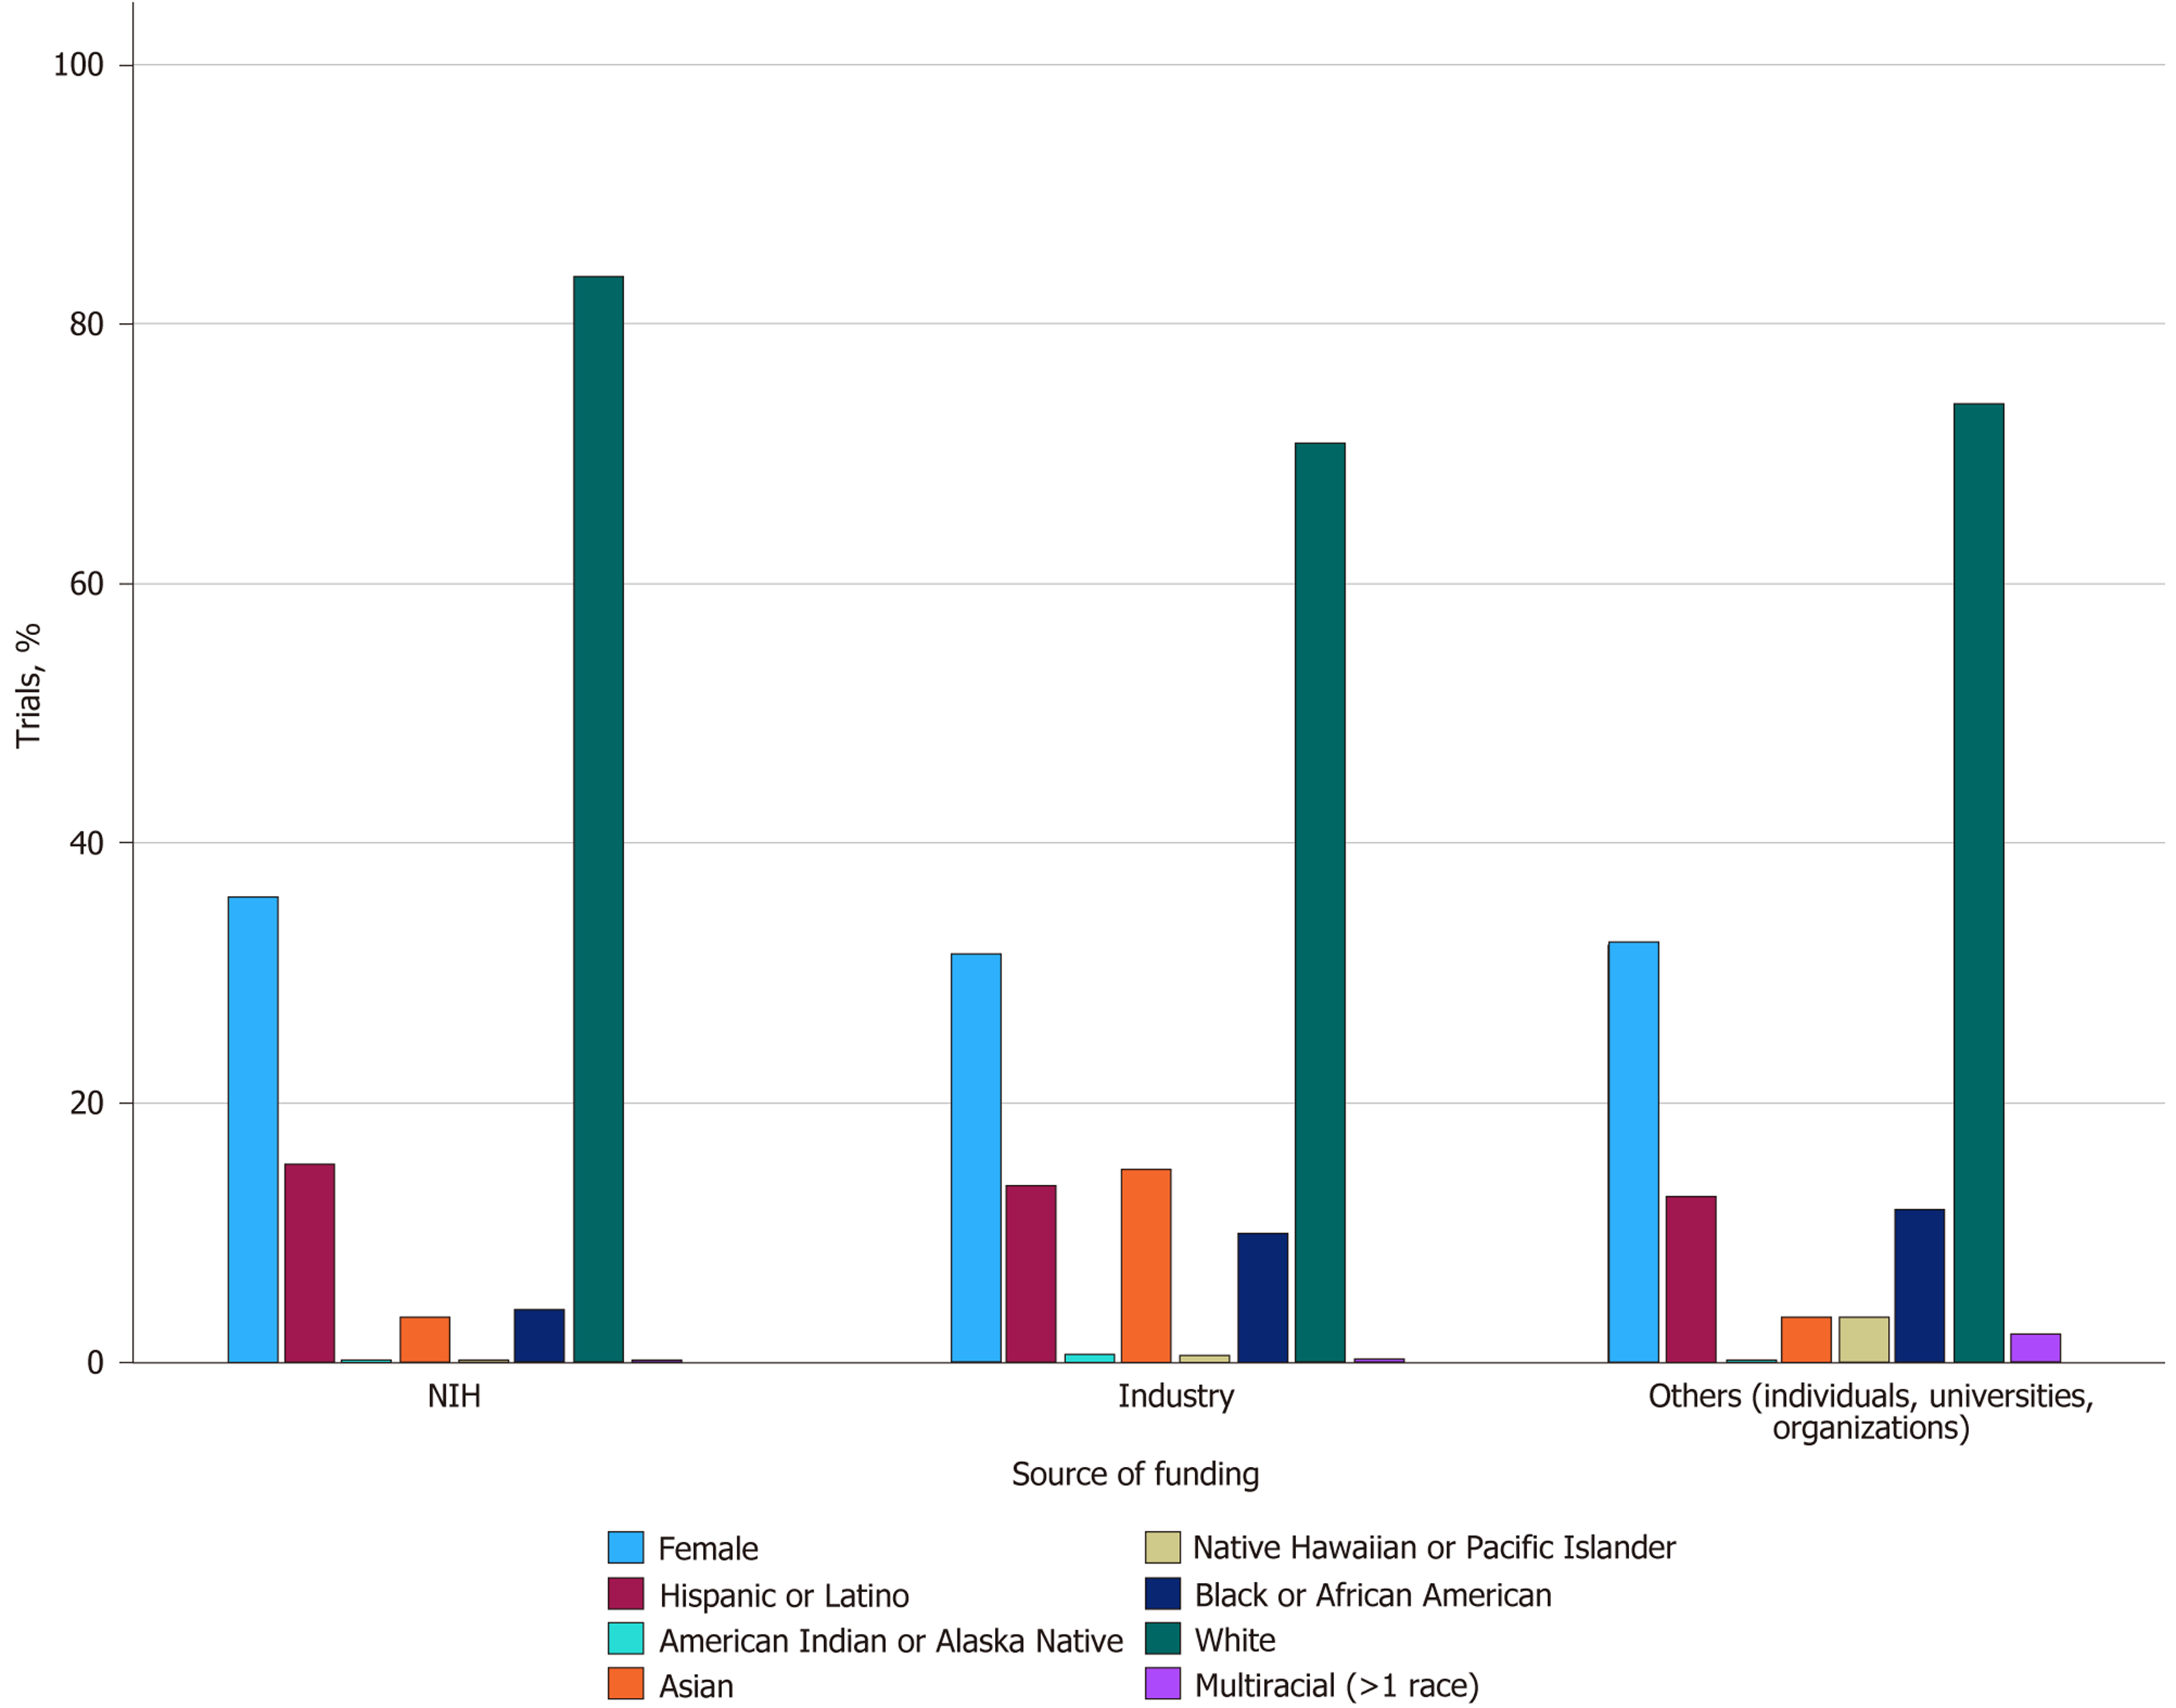
Figure 4 Participant demographics by funding source.
Industry-funded trials showed higher Asian participant representation, while National Institute of Health-funded trials demonstrated underrepresentation of African American participants and overrepresentation of White participants.
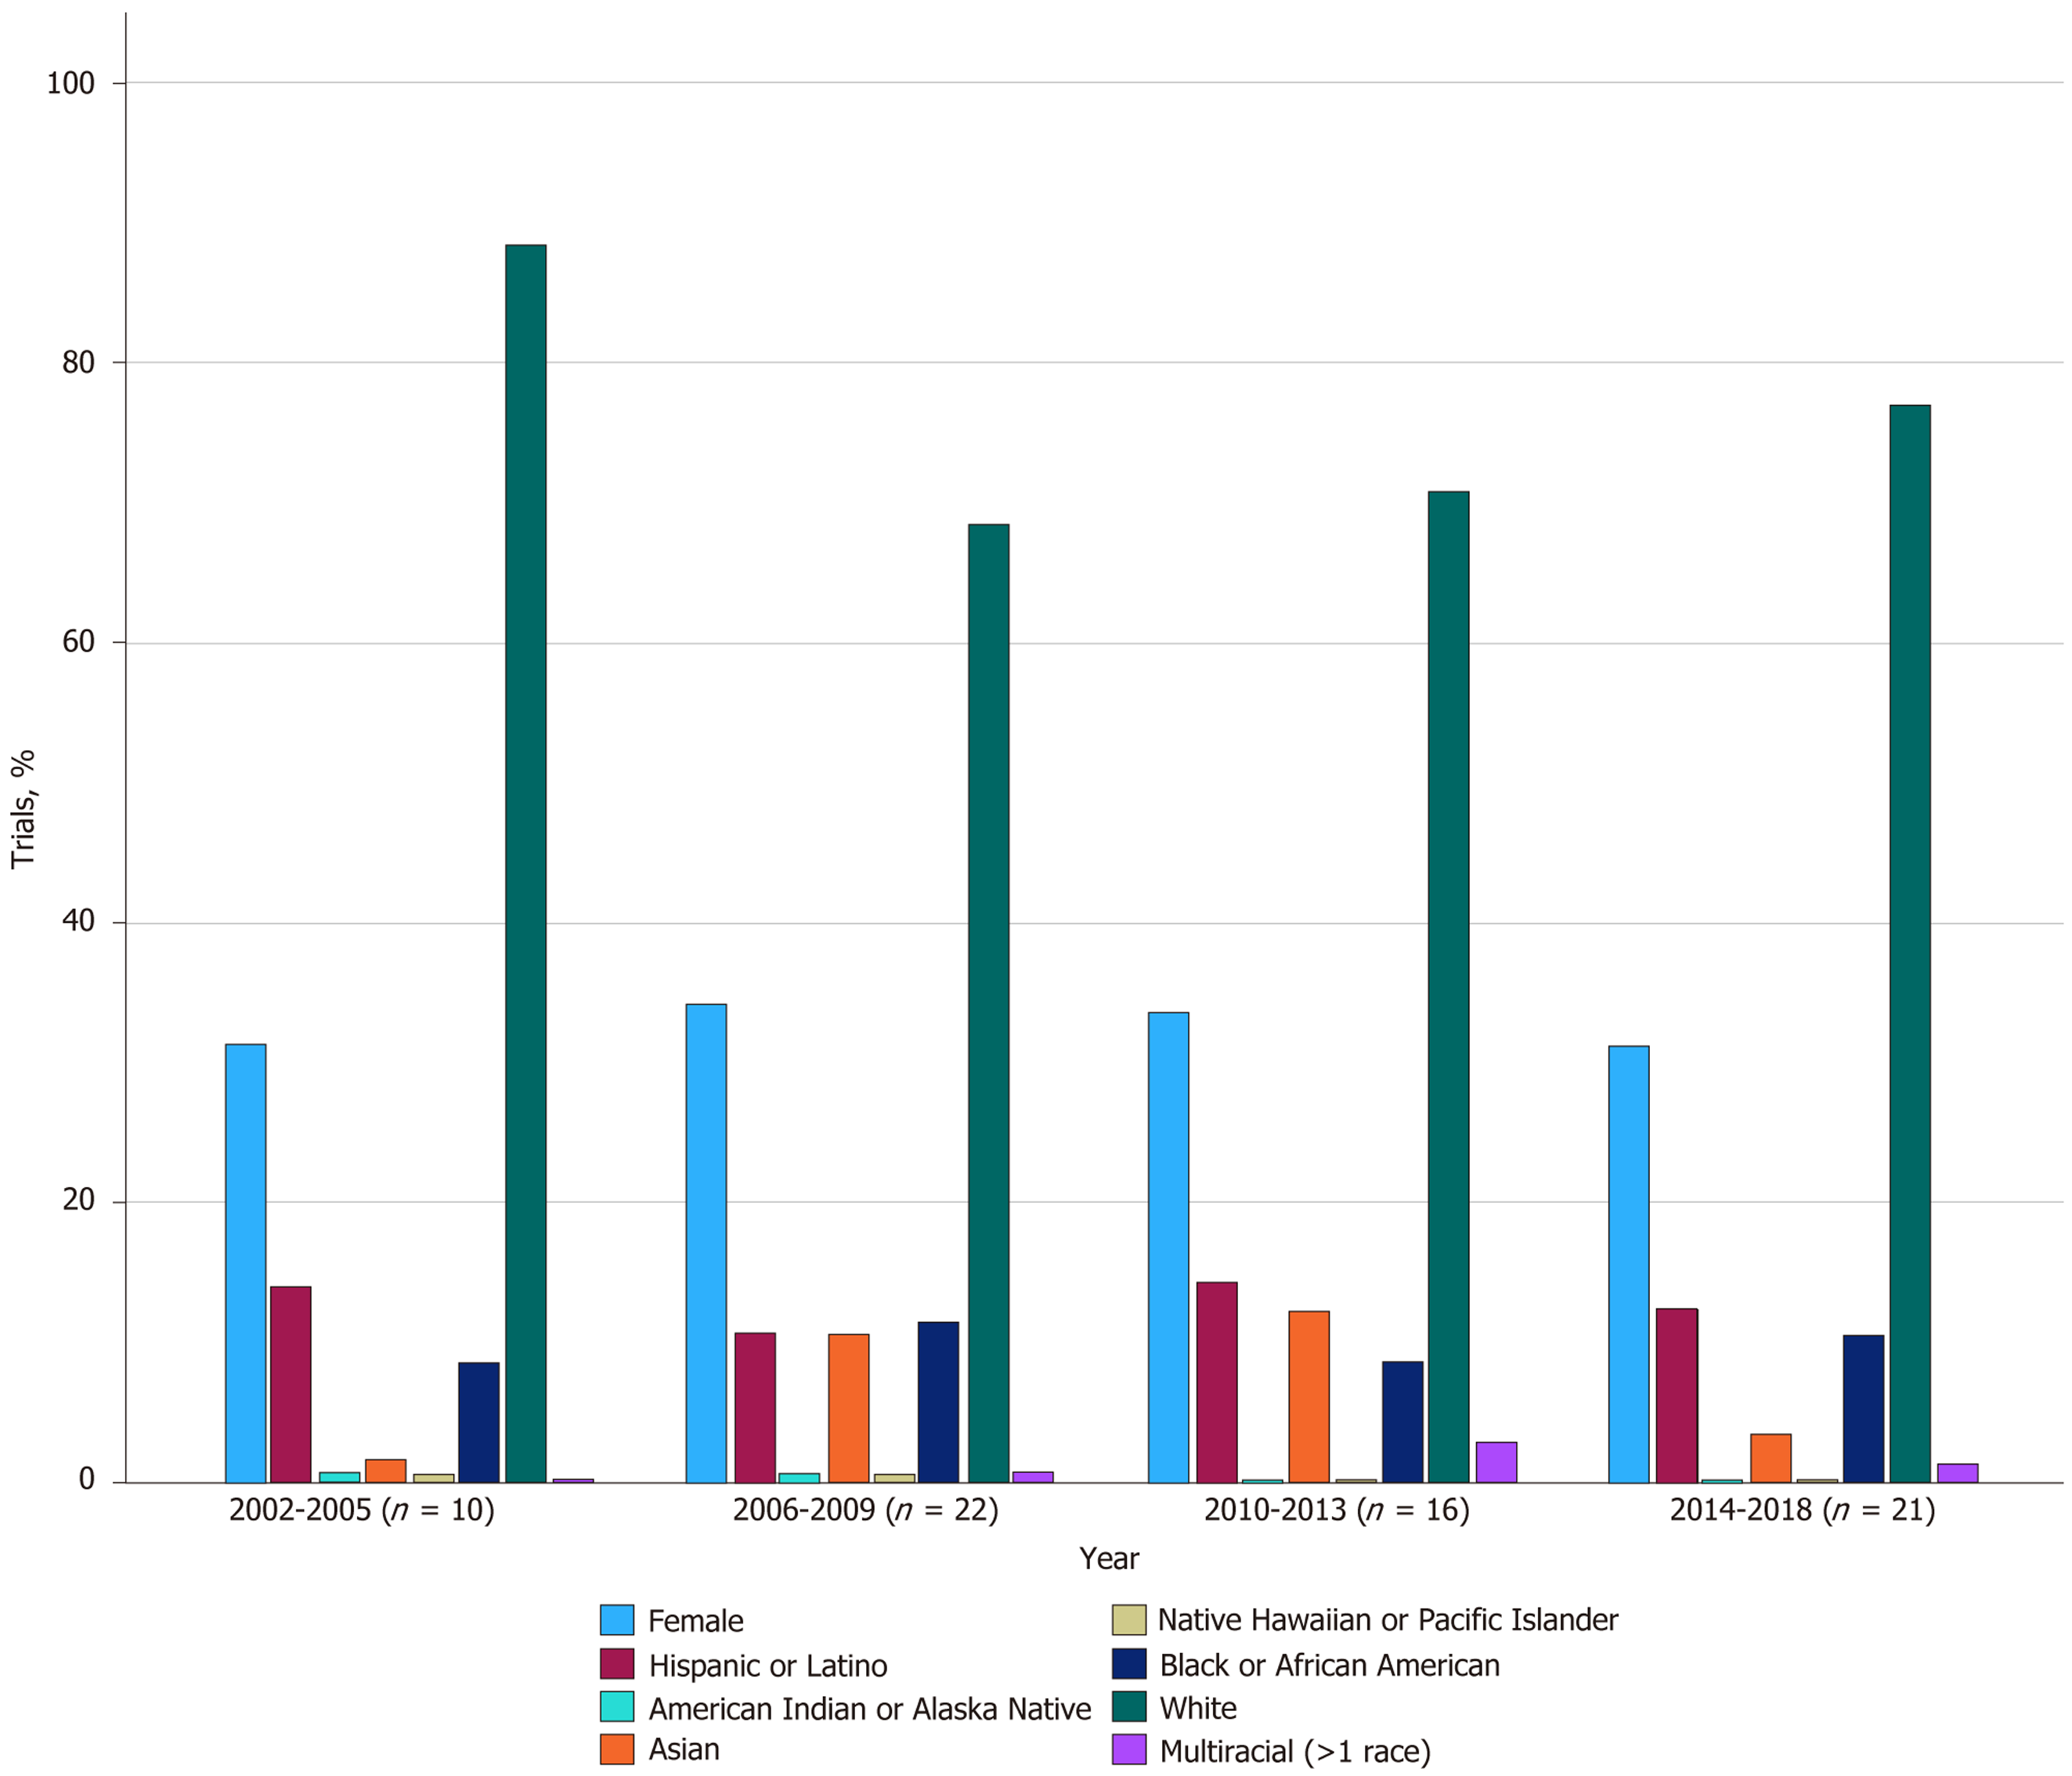
Figure 5 Participants’ representation in liver transplantation trials based on demographics and year.
Women accounted for 31.1% of all trial participants, significantly below their proportion in the general United States population.
- Citation: Alsakarneh S, Khalifa A, Almasaid S, Aburumman R, Kilani Y, Khalid Z, Numan L, Dahiya DS, Karagozian R, Helzberg JH. Sex, racial, and ethnic disparities in United States liver transplantation clinical trials. World J Hepatol 2025; 17(9): 110384
- URL: https://www.wjgnet.com/1948-5182/full/v17/i9/110384.htm
- DOI: https://dx.doi.org/10.4254/wjh.v17.i9.110384


