Copyright
©The Author(s) 2024.
World J Hepatol. Dec 27, 2024; 16(12): 1480-1492
Published online Dec 27, 2024. doi: 10.4254/wjh.v16.i12.1480
Published online Dec 27, 2024. doi: 10.4254/wjh.v16.i12.1480
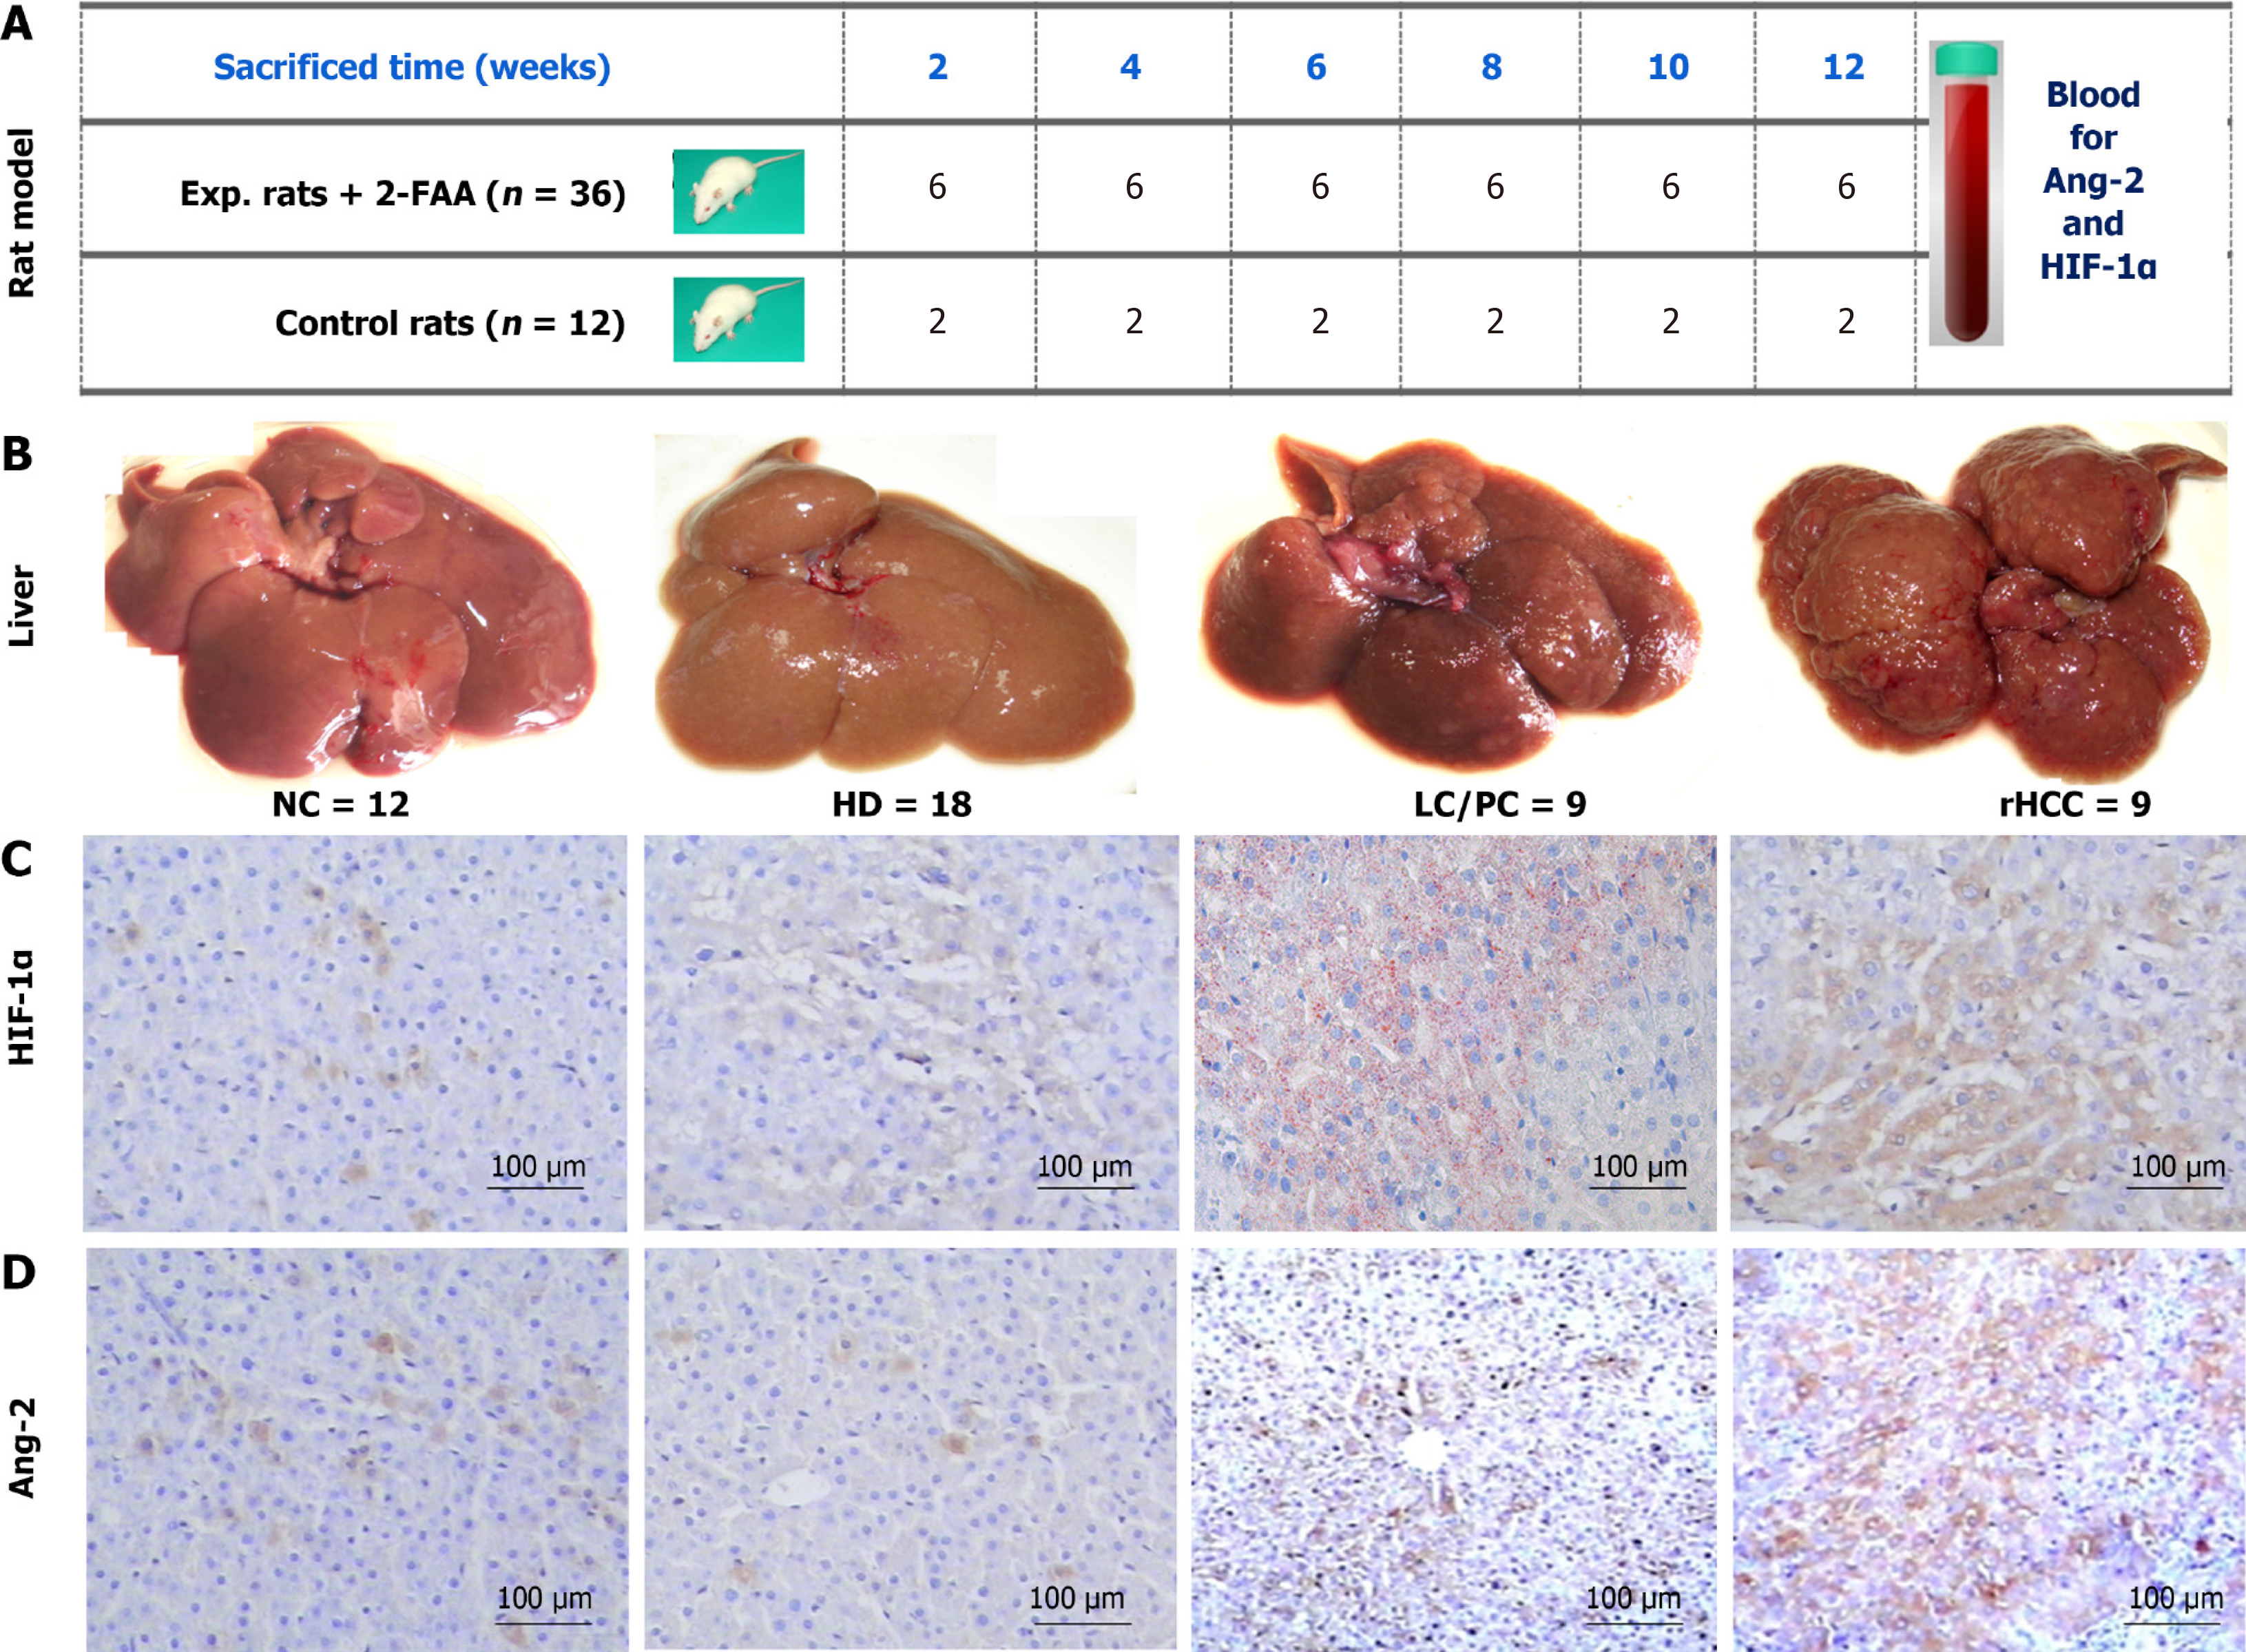
Figure 1 Dynamic expression of hypoxia-inducible factor-1α and angiopoietin-2 during hepatocarcinogenesis in rats.
A: Sprague-Dawley rats (n = 48) were used to establish dynamic hepatocarcinogenesis models; B: Model livers subjected to morphological changes in liver sections were examined by hematoxylin and eosin staining and divided into normal control (n = 12), hepatocyte degeneration (n = 18) at the early stage, liver cirrhosis or precancerosis (n = 9) at the middle stage, and rat hepatocellular carcinoma (n = 9) at the later stage; C: Corresponding liver hypoxia-inducible factor-1α expression by immunohistochemical (SP × 100); D: Corresponding liver angiopoietin-2 expression by immunohistochemical (SP × 100). 2-FAA: 2-fluorenylacet-amide; Ang-2: Angiopoietin-2; HIF-1α: Hypoxia-inducible factor-1α; NC: Normal control; HD: Hepatocyte degeneration; LC: Liver cirrhosis; PC: Precancerosis; rHCC: Rat hepatocellular carcinoma.
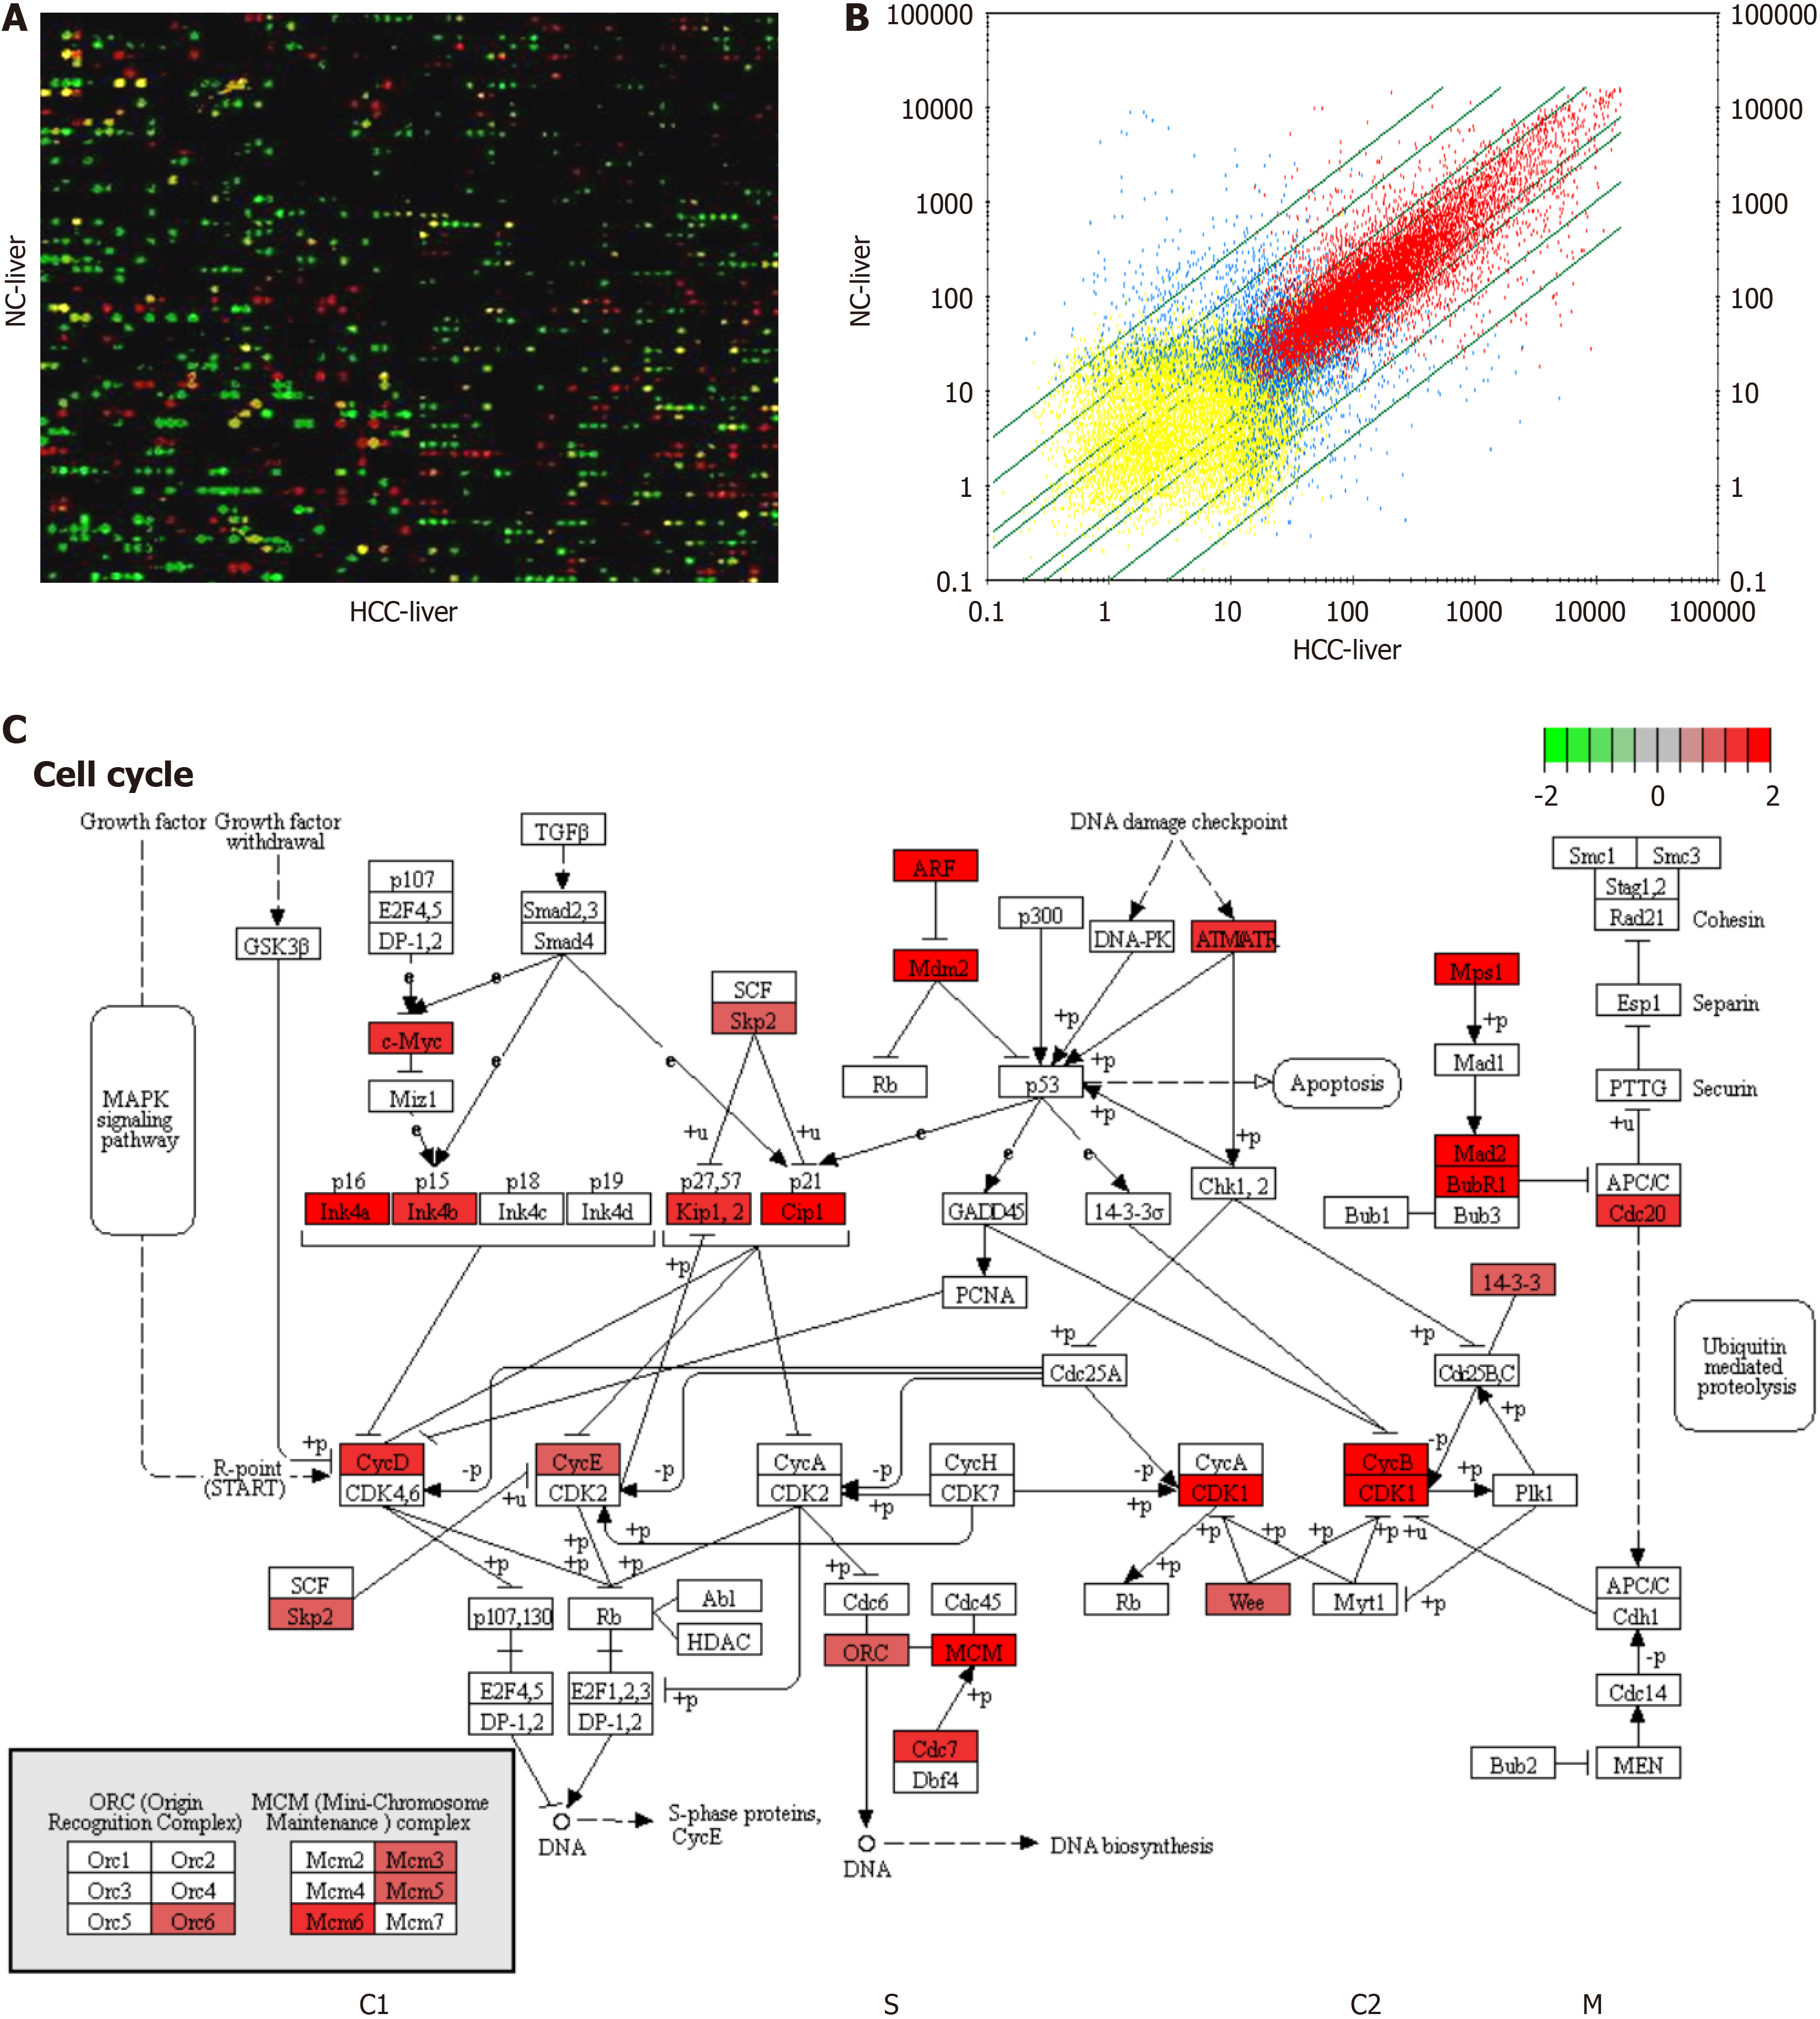
Figure 2 Alterations in whole gene expression profiling.
A: Microarray analysis of the expression levels of a total of 28000 genes between rat hepatocellular carcinoma and normal control liver samples by false color imaging; B: The scatter plot of gene alterations between rat hepatocellular carcinoma and normal control livers is shown in a volcano plot; C: Gene upregulation in the cell cycle in hepato- carcinogenesis model rats. NC: Normal control; HCC: Hepatocellular carcinoma.
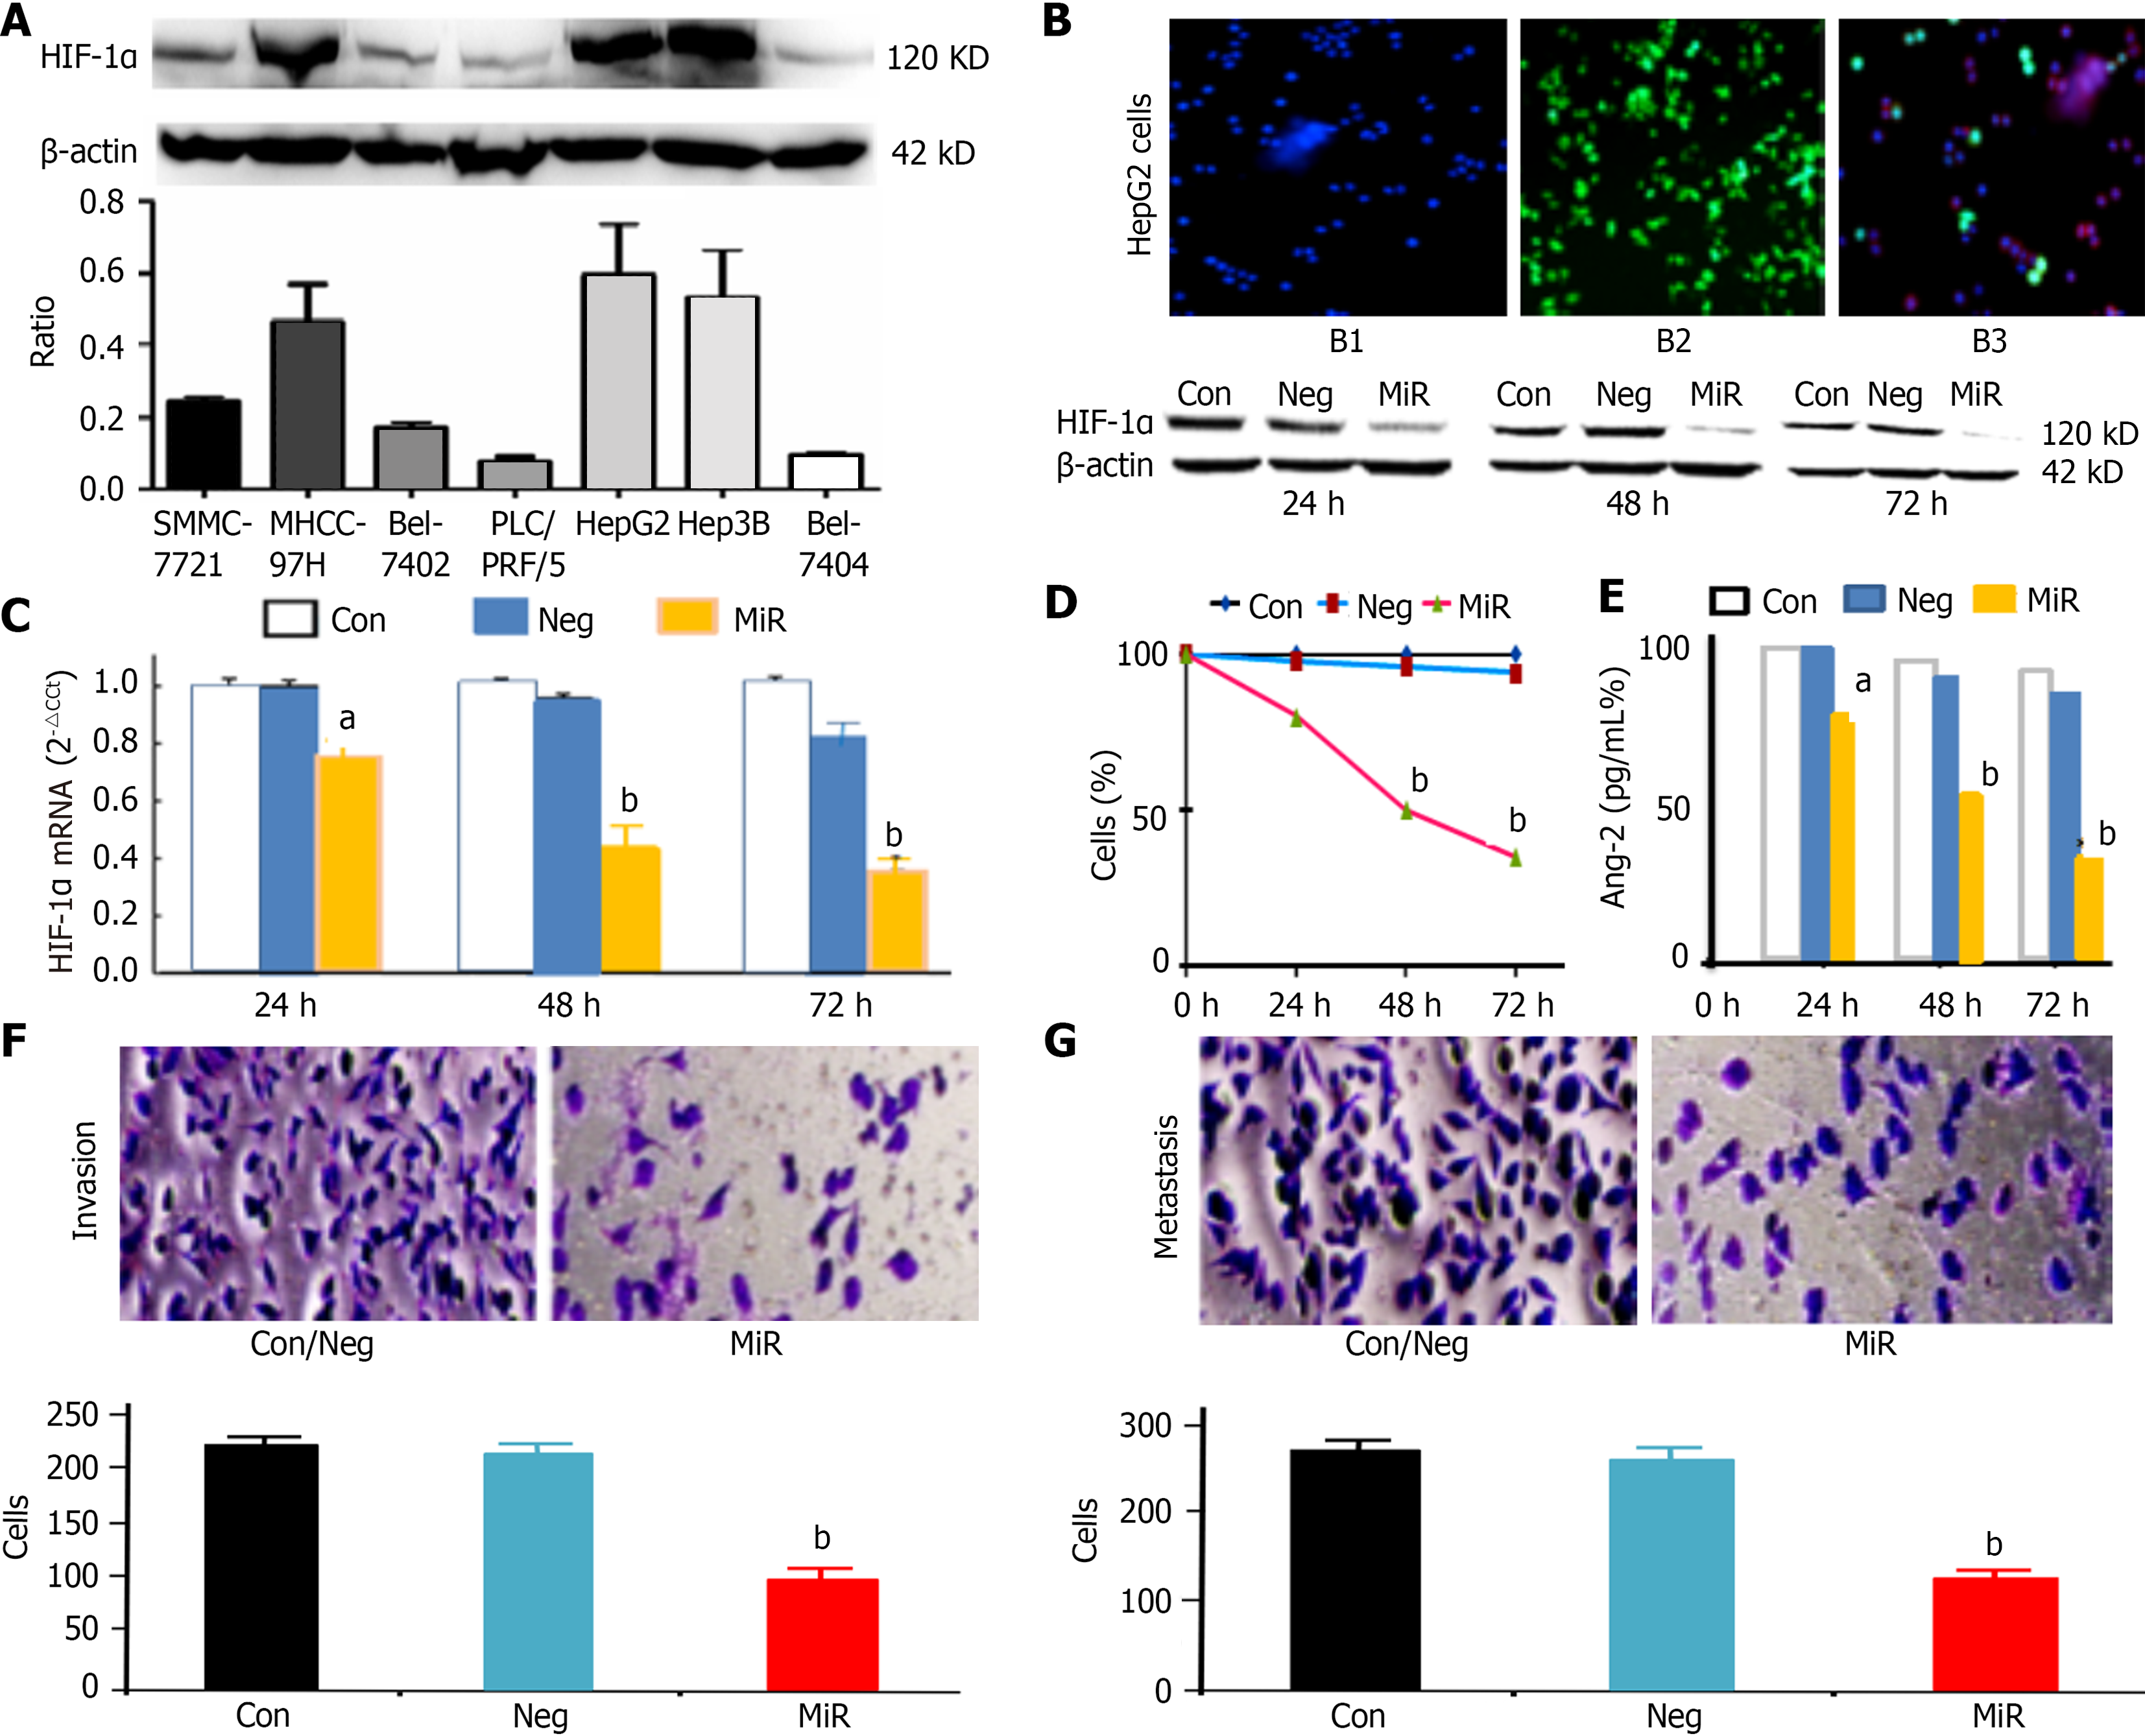
Figure 3 Silencing of hypoxia-inducible factor-1α affects angiopoietin-2 and the biological behavior of hepatocellular carcinoma cells.
A: Hypoxia-inducible factor-1α (HIF-1α) expression among different hepatocellular carcinoma cell lines; B: Fluorescence micrographs of HepG2 cells (× 40): Control group (B1, no fluorescence), negative microRNA group (B2), and microRNA group (B3) at 48 hours, with HIF-1α (120 kDa) downregulation illustrated at the protein level by western blotting (B4) with β-actin (42 kDa) as a control; C: Downregulation of HIF-1α mRNA after microRNA (150 mmol/Lol/L) transfection by quantitative real-time polymerase chain reaction; D: Cell proliferation inhibition; E: Angiopoietin-2 downregulation; F: Crystal violet staining and invasion of cells (× 200); G: Crystal violet staining and migration of cells (× 200). HIF-1α: Hypoxia-inducible factor-1α; Con: Control group; Neg: Negative microRNA group; MiR: MicroRNA group; Ang-2: Angiopoietin-2. aP < 0.05 or bP < 0.01, compared with the microRNA or control group.
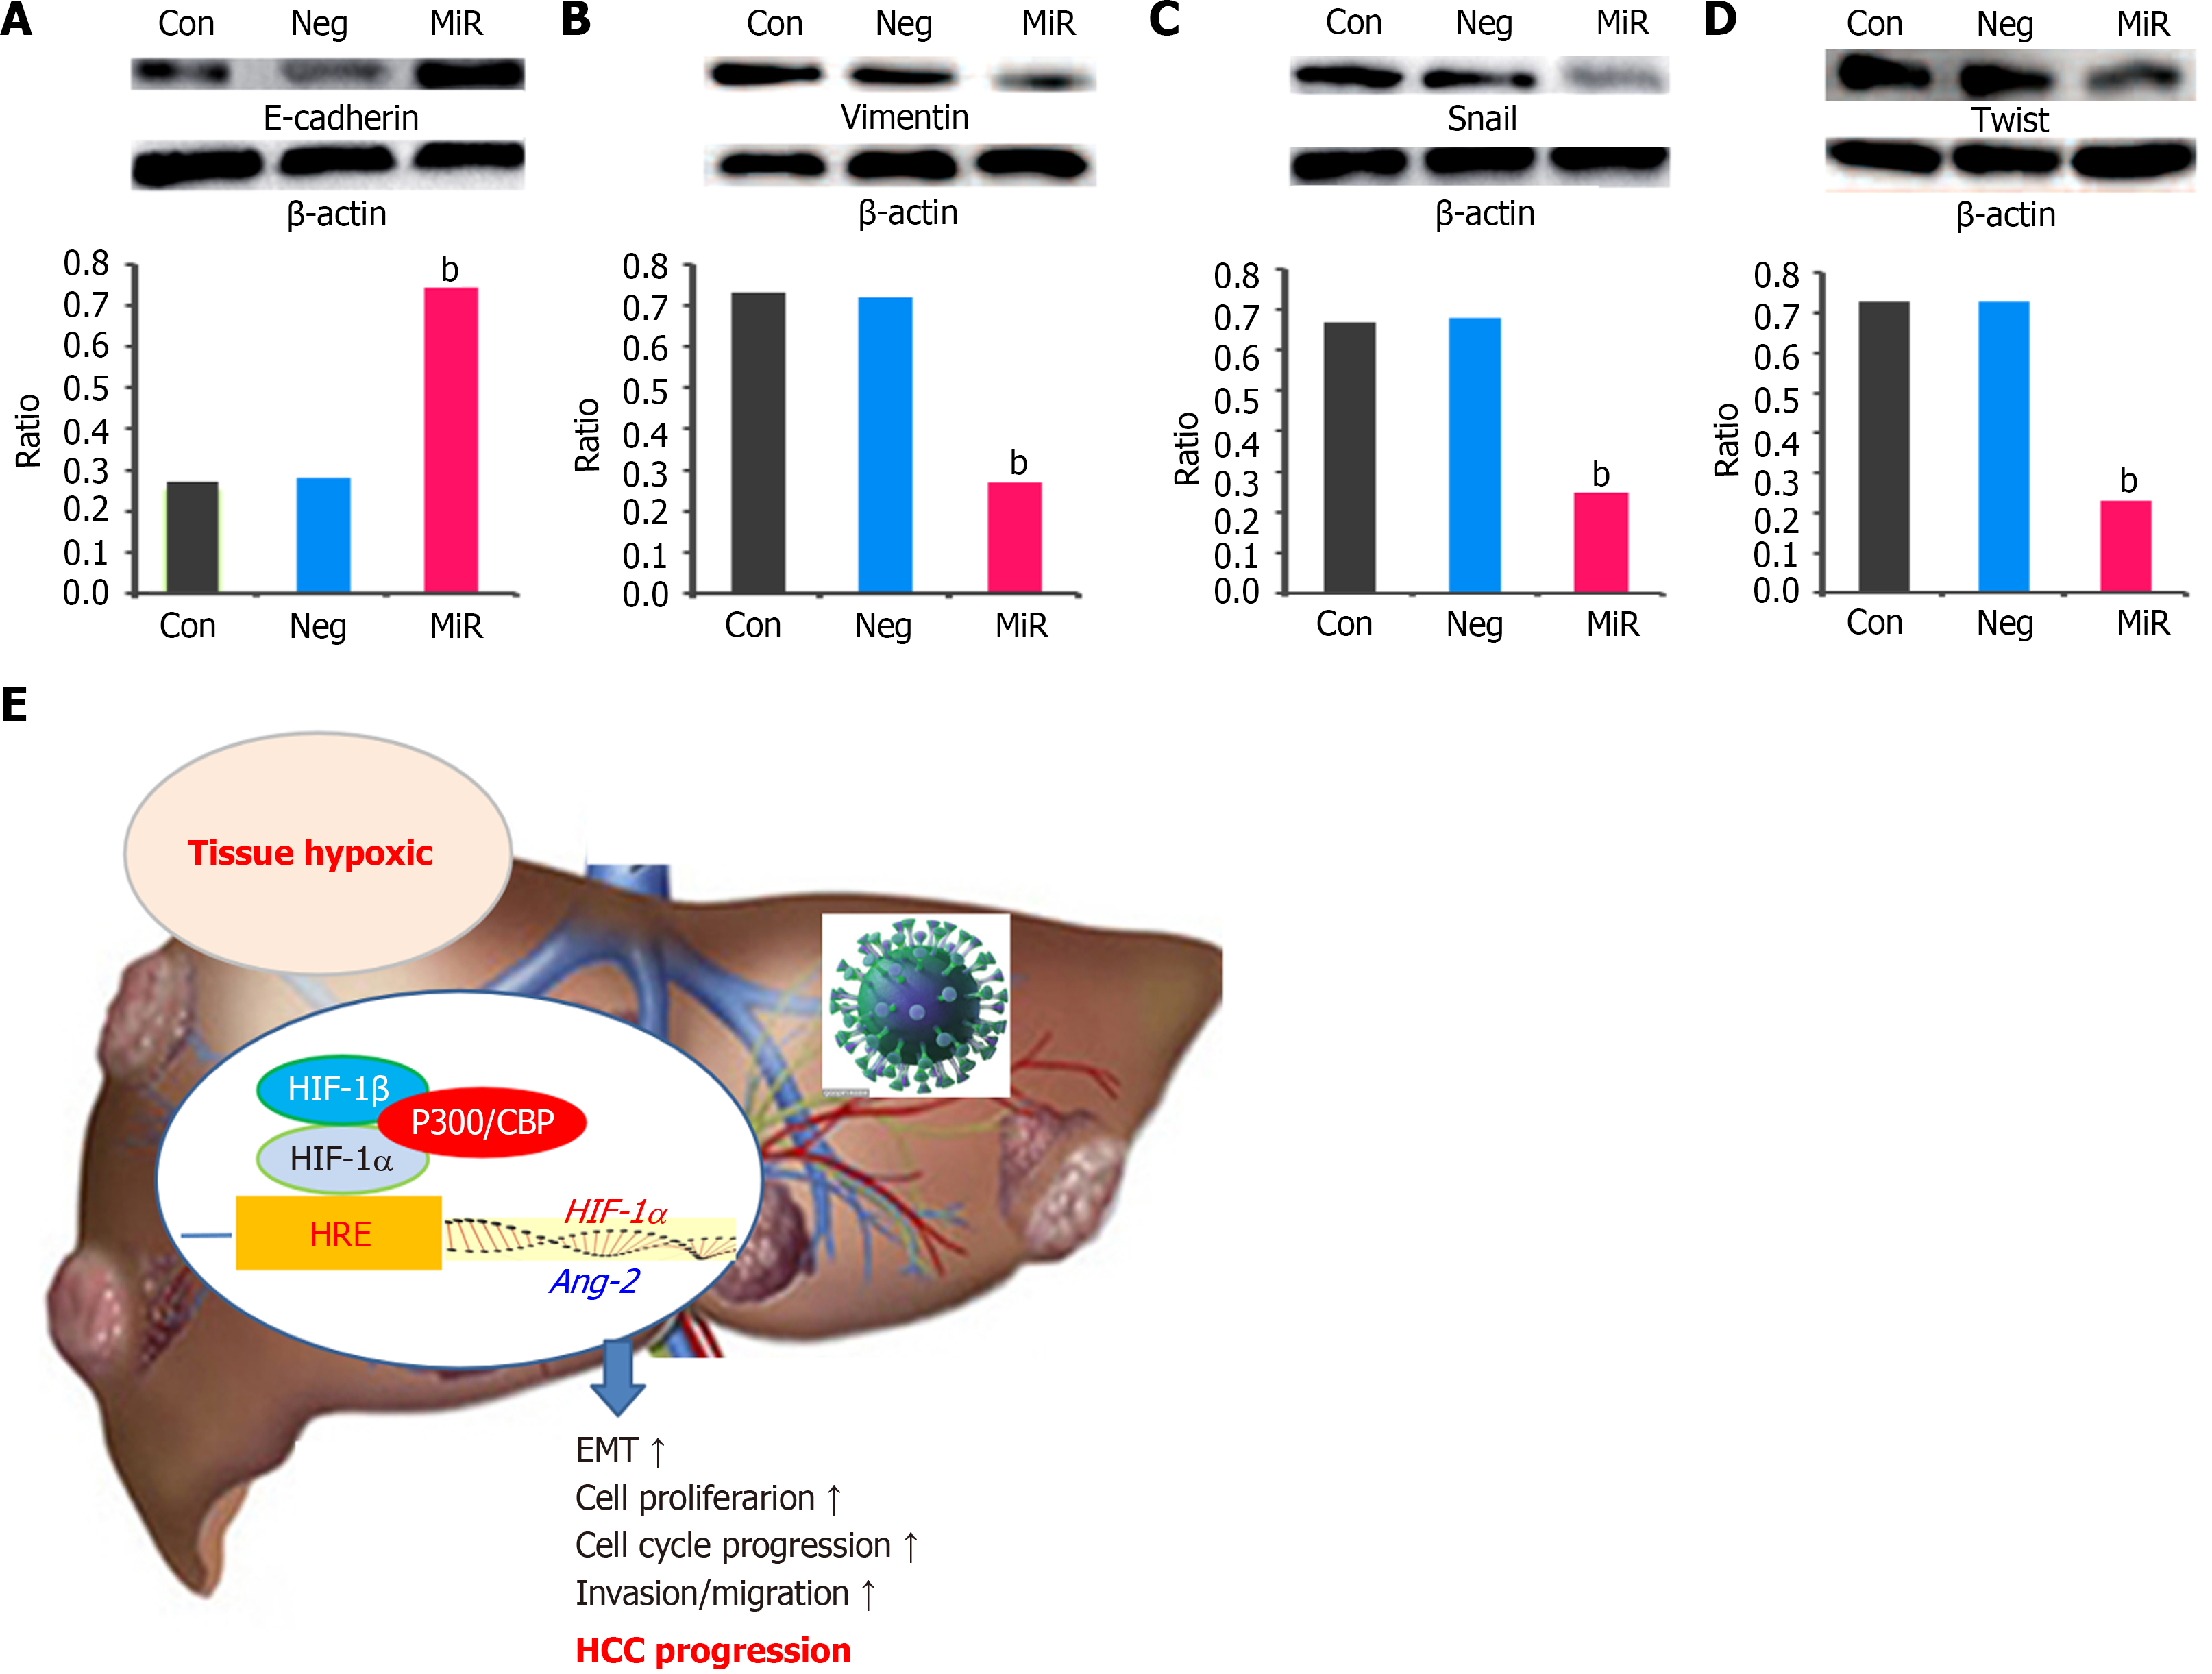
Figure 4 Silencing of hypoxia-inducible factor-1α affected epithelial-mesenchymal transition in HepG2 cells (n = 6).
A: E-cadherin and the relative ratio; B: Vimentin and the relative ratio; C: Snail and the relative ratio; D: Twist and the relative ratio; E: Hypoxia upregulated angiopoietin-2, promoting hepatocellular carcinoma progression. Ang-2: Angiopoietin-2; Con: Control group; Neg: Negative microRNA group; MiR: MicroRNA group; HRE: Hypoxia response element; EMT: Epithelial-mesenchymal transition; HBV: Hepatitis B virus; HIF-1α: Hypoxia-inducible factor-1α; HCC: Hepatocellular carcinoma. bP < 0.01, compared with the control group.
- Citation: Yang JL, Yang J, Fang RF, Sai WL, Yao DF, Yao M. Hypoxia upregulates hepatic angiopoietin-2 transcription to promote the progression of hepatocellular carcinoma. World J Hepatol 2024; 16(12): 1480-1492
- URL: https://www.wjgnet.com/1948-5182/full/v16/i12/1480.htm
- DOI: https://dx.doi.org/10.4254/wjh.v16.i12.1480


