Copyright
©The Author(s) 2025.
World J Stem Cells. Nov 26, 2025; 17(11): 112484
Published online Nov 26, 2025. doi: 10.4252/wjsc.v17.i11.112484
Published online Nov 26, 2025. doi: 10.4252/wjsc.v17.i11.112484
Figure 1 Characterization of peripheral blood mesenchymal stem cells.
A: Representative images of primary cultured rat peripheral blood mesenchymal stem cells (PBMSCs) from both healthy rats at day 14 and injured rats at day 14 and day 21, along with PBMSCs at the fourth passage; B: Flow cytometry analysis revealed positive expression of mesenchymal stem cell markers (CD105, CD90, CD71, CD73, and CD44), and negative expression of hematopoietic stem cell markers (CD34 and CD45), along with endothelial progenitor cell markers (CD31 and CD133); C: Multilineage differentiation potential of PBMSCs. Adipogenic differentiation was verified via Oil Red O (red) staining. Chondrogenic differentiation was demonstrated by Alcian Blue (blue) staining. Osteogenic differentiation was illustrated via Alizarin Red (red) staining. Staining following standard culture with a dye-free solution was also presented. Scale bars = 50 μm. P4: Fourth passage.
Figure 2 Hypoxia-inducible factor-1α promotes stem cell proliferation and inhibits the senescence of peripheral blood mesenchymal stem cells.
The experiments were categorized into the following groups: Transfection of vehicle in normoxia, transfection of vehicle in hypoxia, hypoxia-inducible factor-1α (HIF-1α) overexpression, HIF-1α knockdown, and HIF-1α overexpression plus HIF-1α knockdown in hypoxia. A: Cell proliferative capacity of peripheral blood mesenchymal stem cells was assessed by cell colony formation assays and crystal violet staining; B: Quantitative analysis of the number of cell clones in each group; C: Β-galactosidase staining was employed to examine cellular senescence of peripheral blood mesenchymal stem cells; D: Quantitative analysis of percentage of β-galactosidase positive cells (scale bars = 50 μm). All graphical data are presented as the means ± SEMs. aP < 0.05; bP < 0.01; cP < 0.001. n = 3 in each group. Normoxia-Con: Transfection of vehicle in normoxia; Hypoxia-Con: Transfection of vehicle in hypoxia; oeHIF-1α: Hypoxia-inducible factor-1α overexpression; shHIF-1α: Hypoxia-inducible factor-1α knockdown; oe + shHIF-1α: Hypoxia-inducible factor-1α overexpression plus hypoxia-inducible factor-1α knockdown in hypoxia.
Figure 3 β-catenin promotes stem cell proliferation and inhibits the senescence of peripheral blood mesenchymal stem cells.
The experiments were categorized into the following groups: Transfection of vehicle in normoxia, transfection of vehicle in hypoxia, β-catenin overexpression, β-catenin knockdown, and β-catenin overexpression plus β-catenin knockdown in hypoxia. A: Cell proliferative capacity of peripheral blood mesenchymal stem cells was assessed by cell colony formation assays and crystal violet staining; B: Quantitative analysis of the number of cell clones in each group; C: Β-galactosidase staining was employed to examine cellular senescence of peripheral blood mesenchymal stem cells; D: Quantitative analysis of the percentage of β-galactosidase positive cells (scale bars = 50 μm). All graphical data are presented as the means ± SEMs. aP < 0.05; bP < 0.01; cP < 0.001. n = 3 in each group. Normoxia-Con: Transfection of vehicle in normoxia; Hypoxia-Con: Transfection of vehicle in hypoxia; oeβ-catenin: Β-catenin overexpression; shβ-catenin: Β-catenin knockdown; oe + shβ-catenin: Β-catenin overexpression plus β-catenin knockdown in hypoxia.
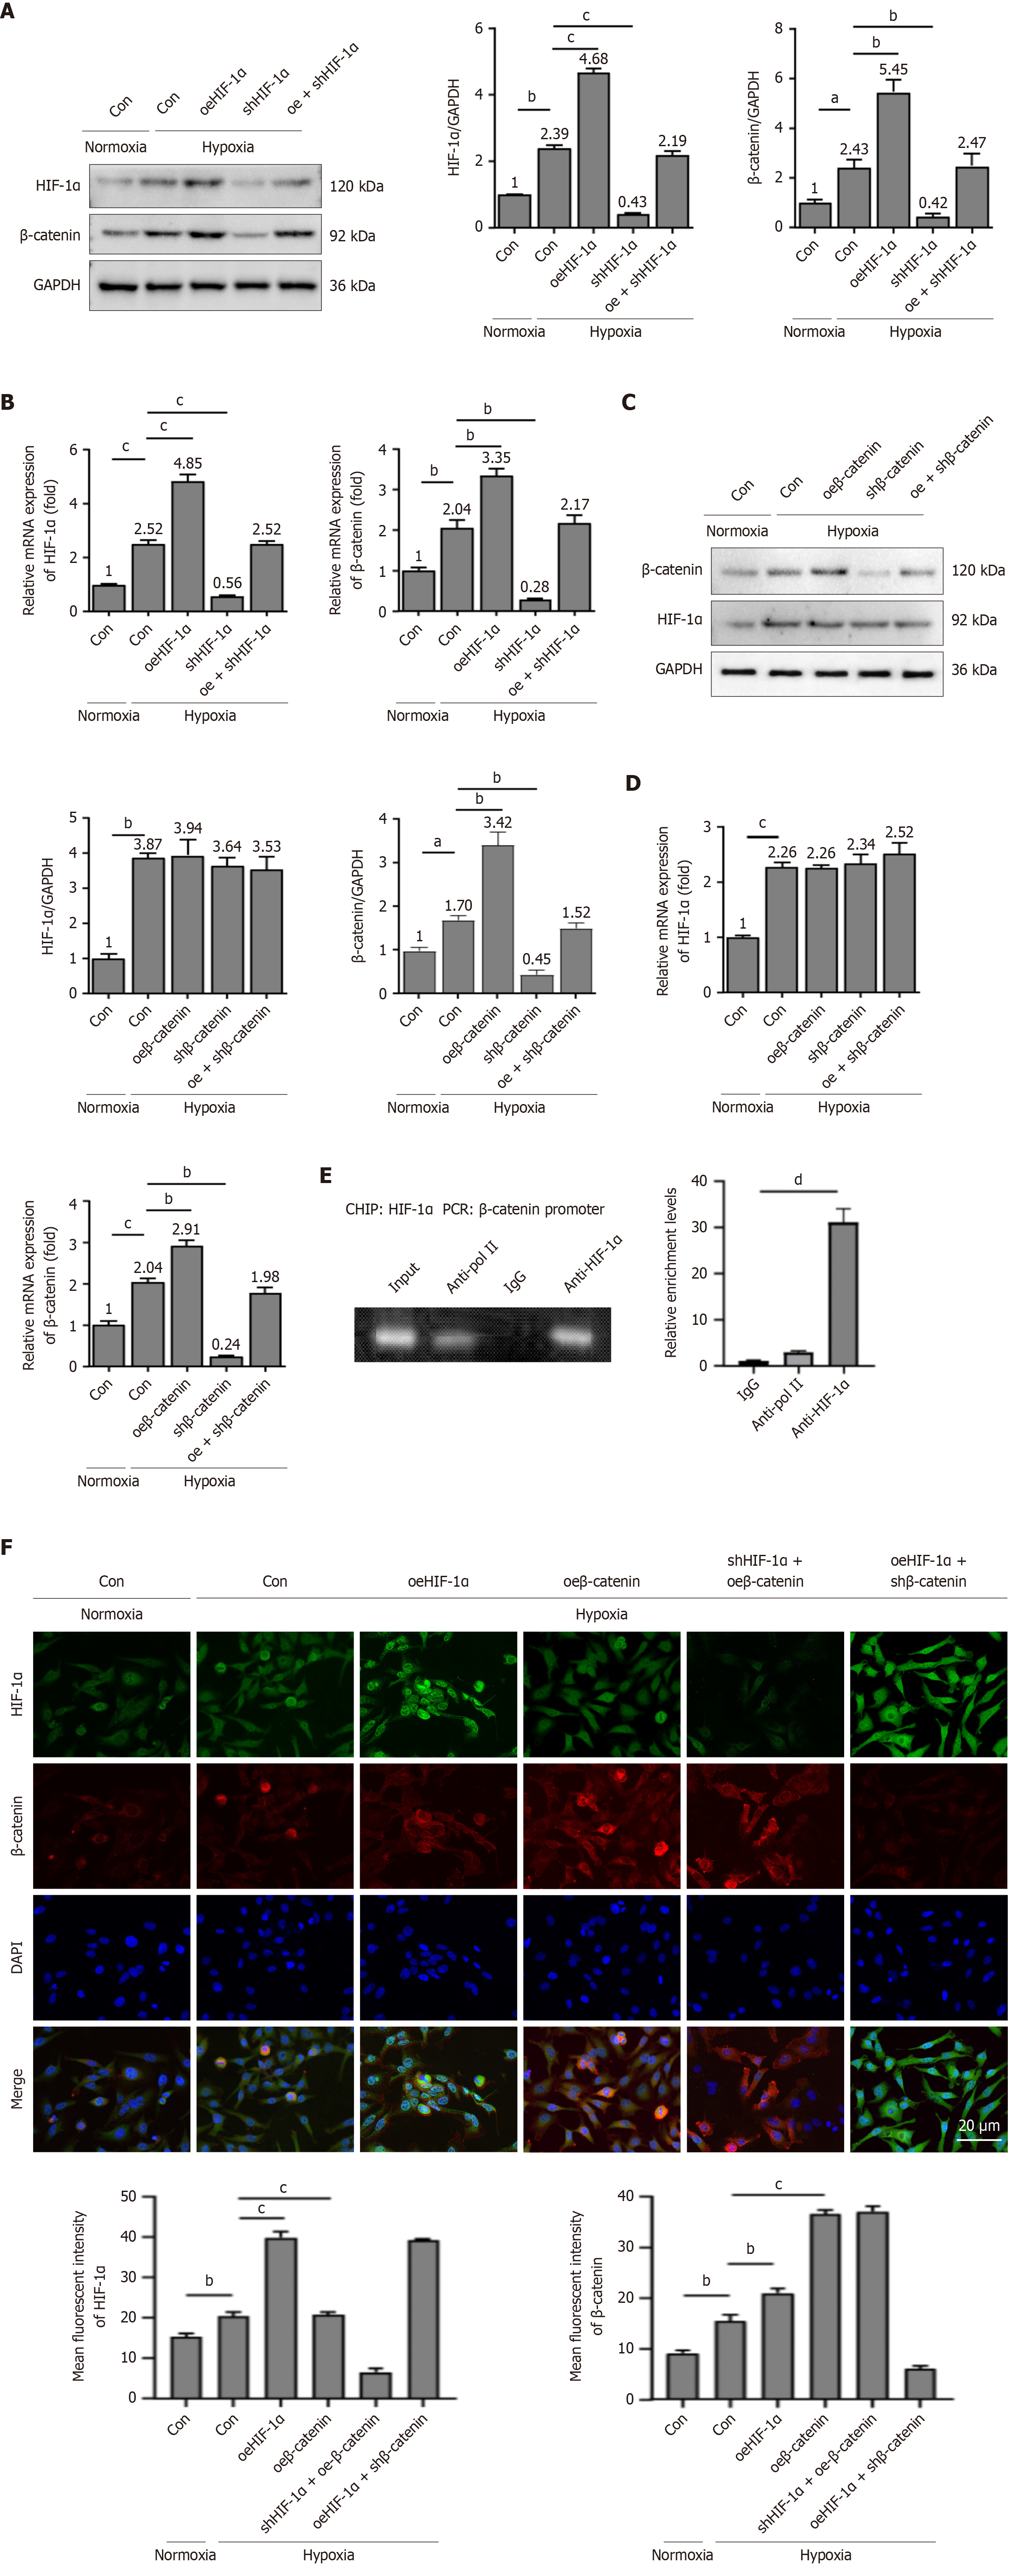
Figure 4 Hypoxia-inducible factor-1α regulates β-catenin transcription.
A-D: The experiments were categorized into the following groups: Transfection of vehicle in normoxia, transfection of vehicle in hypoxia, hypoxia-inducible factor-1α (HIF-1α) overexpression (oeHIF-1α), HIF-1α knockdown (shHIF-1α), oeHIF-1α plus shHIF-1α (oe + shHIF-1α) [or β-catenin overexpression (oeβ-catenin), β-catenin knockdown (shβ-catenin), and β-catenin overexpression plus β-catenin knockdown (oe + shβ-catenin)] in hypoxia. Hypoxia enhanced the expression of HIF-1α and β-catenin, with oeHIF-1α increasing the expressions of HIF-1α and β-catenin in peripheral blood mesenchymal stem cells (PBMSCs) under hypoxic conditions (A and B). Hypoxia enhanced the expression of HIF-1α; shβ-catenin and oeβ-catenin did not increase the expression of HIF-1α under hypoxic conditions (C and D); E: Chromatin immunoprecipitation assay for the binding of HIF-1α to the β-catenin promoter. Anti-immunoglobulin G was employed as a negative control, and anti-RNA-polymerase II was utilized as a positive control; F: Representative immunofluorescence results of the HIF-1α and β-catenin in PBMSCs treated with normoxia (vehicle) or hypoxia (vehicle, oeHIF-1α, oeβ-catenin, shHIF-1α + oeβ-catenin, and oeHIF-1α + shβ-catenin). HIF-1α and β-catenin were stained green and red, respectively. The nuclei of PBMSCs were counterstained blue using 4,6-diamino-2-phenylindole. Scale bars = 20 μm. HIF-1α was predominantly localized in the nucleus. β-catenin was mainly expressed in the cytoplasm and partially in the cell nucleus. All graphical data are presented as the means ± SEMs. aP < 0.05; bP < 0.01; cP < 0.001; dP < 0.0001. n = 3 in each group. HIF-1α: Hypoxia-inducible factor-1α; Normoxia-Con: Transfection of vehicle in normoxia; Hypoxia-Con: Transfection of vehicle in hypoxia; oeHIF-1α: Hypoxia-inducible factor-1α overexpression; shHIF-1α: Hypoxia-inducible factor-1α knockdown; oe + shHIF-1α: Hypoxia-inducible factor-1α overexpression plus hypoxia-inducible factor-1α knockdown in hypoxia; oeβ-catenin: Β-catenin overexpression; shβ-catenin: Β-catenin knockdown; oe + shβ-catenin: Β-catenin overexpression plus β-catenin knockdown in hypoxia; PCR: Polymerase chain reaction; IgG: Immunoglobulin G; DAPI: 4,6-diamino-2-phenylindole.
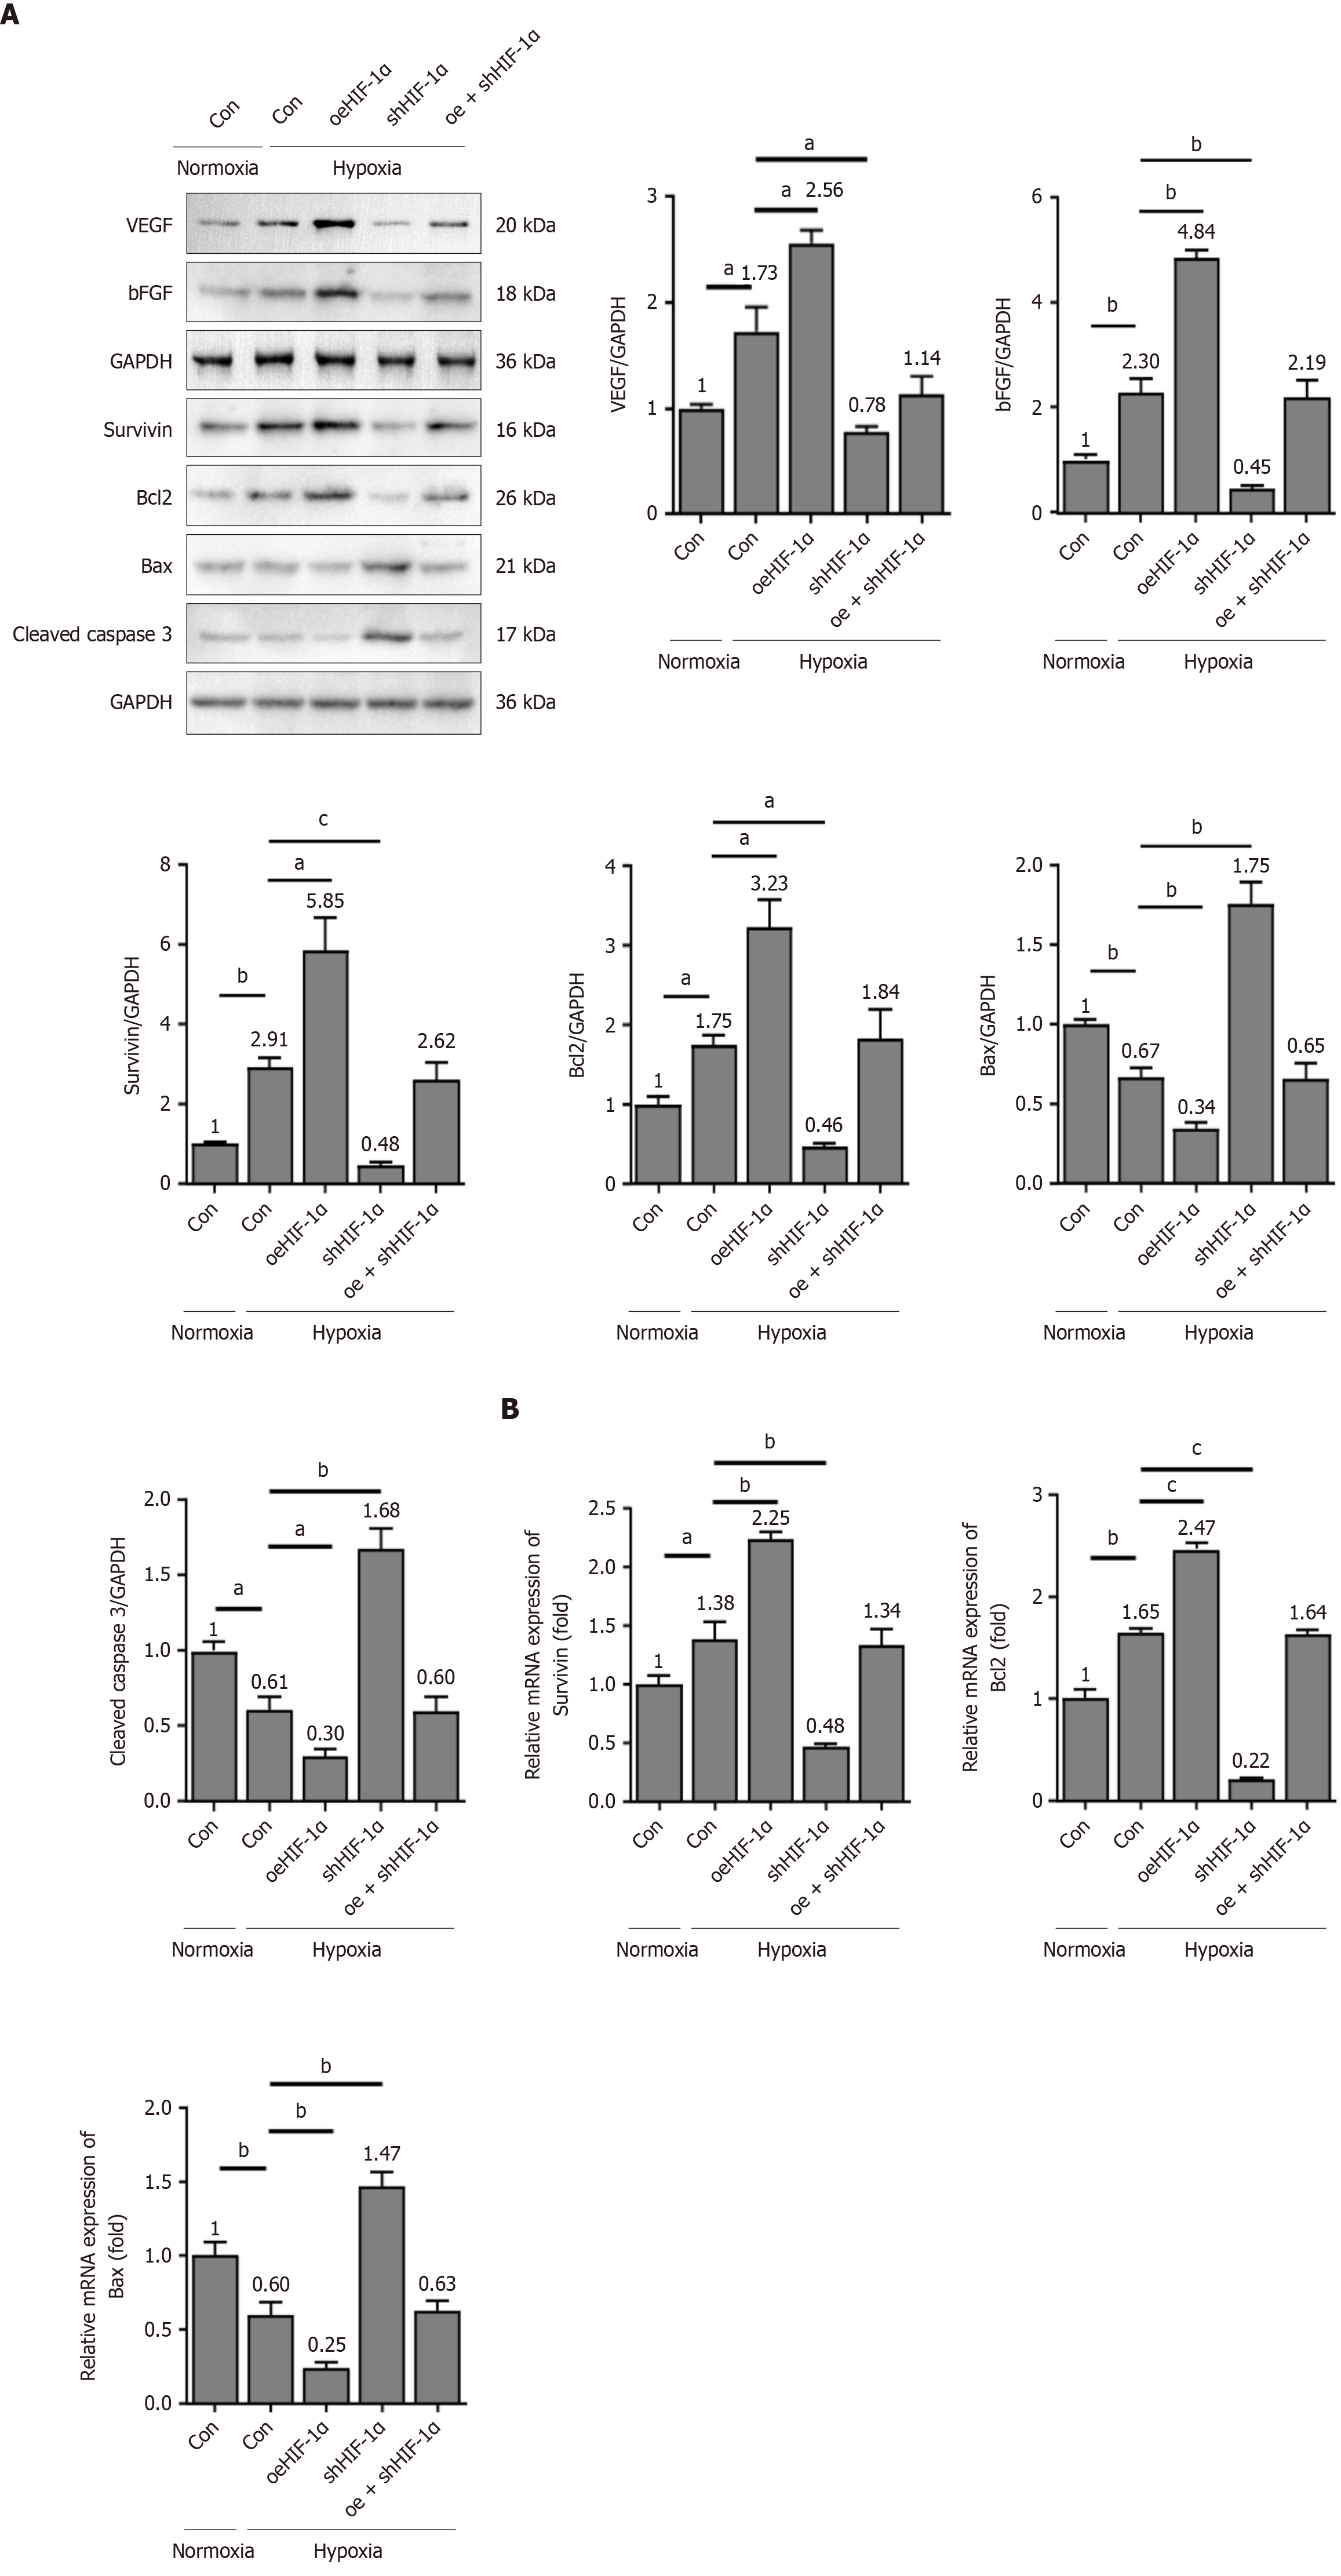
Figure 5 Hypoxia-inducible factor-1α regulates expressions of antiapoptotic and proangiogenic molecules.
The experiments were categorized into the following groups: Transfection of vehicle in normoxia, transfection of vehicle in hypoxia, hypoxia-inducible factor-1α (HIF-1α) overexpression, HIF-1α knockdown, and HIF-1α overexpression plus HIF-1α knockdown in hypoxia. A: The protein levels of vascular endothelial growth factor, basic fibroblast growth factor, survivin, Bcl2, Bax, and cleaved caspase 3 in the peripheral blood mesenchymal stem cells were evaluated using western blotting; B: The mRNA levels of survivin, Bcl2, and Bax were detected using quantitative real-time polymerase chain reaction. All graphical data are presented as the means ± SEMs. aP < 0.05; bP < 0.01; cP < 0.001. n = 3 in each group. Normoxia-Con: Transfection of vehicle in normoxia; Hypoxia-Con: Transfection of vehicle in hypoxia; oeHIF-1α: Hypoxia-inducible factor-1α overexpression; shHIF-1α: Hypoxia-inducible factor-1α knockdown; oe + shHIF-1α: Hypoxia-inducible factor-1α overexpression plus hypoxia-inducible factor-1α knockdown in hypoxia; VEGF: Vascular endothelial growth factor; bFGF: Basic fibroblast growth factor.
Figure 6 β-catenin regulates expressions of antiapoptotic and proangiogenic molecules.
The experiments were categorized into the following groups: Transfection of vehicle in normoxia (normoxia-Con), transfection of vehicle in hypoxia (hypoxia-Con), β-catenin overexpression, β-catenin knockdown, and β-catenin overexpression plus β-catenin knockdown in hypoxia. A: The protein levels of vascular endothelial growth factor, basic fibroblast growth factor, survivin, Bcl2, Bax, and cleaved caspase 3 in peripheral blood mesenchymal stem cells were measured by western blot; B: The mRNA levels of survivin, Bcl2, and Bax in peripheral blood mesenchymal stem cells were measured by quantitative real-time polymerase chain reaction. All graphical data are presented as the means ± SEMs. aP < 0.05; bP < 0.01; cP < 0.001. n = 3 in each group. Normoxia-Con: Transfection of vehicle in normoxia; Hypoxia-Con: Transfection of vehicle in hypoxia; oeβ-catenin: Β-catenin overexpression; shβ-catenin: Β-catenin knockdown; oe + shβ-catenin: Β-catenin overexpression plus β-catenin knockdown in hypoxia; VEGF: Vascular endothelial growth factor; bFGF: Basic fibroblast growth factor.
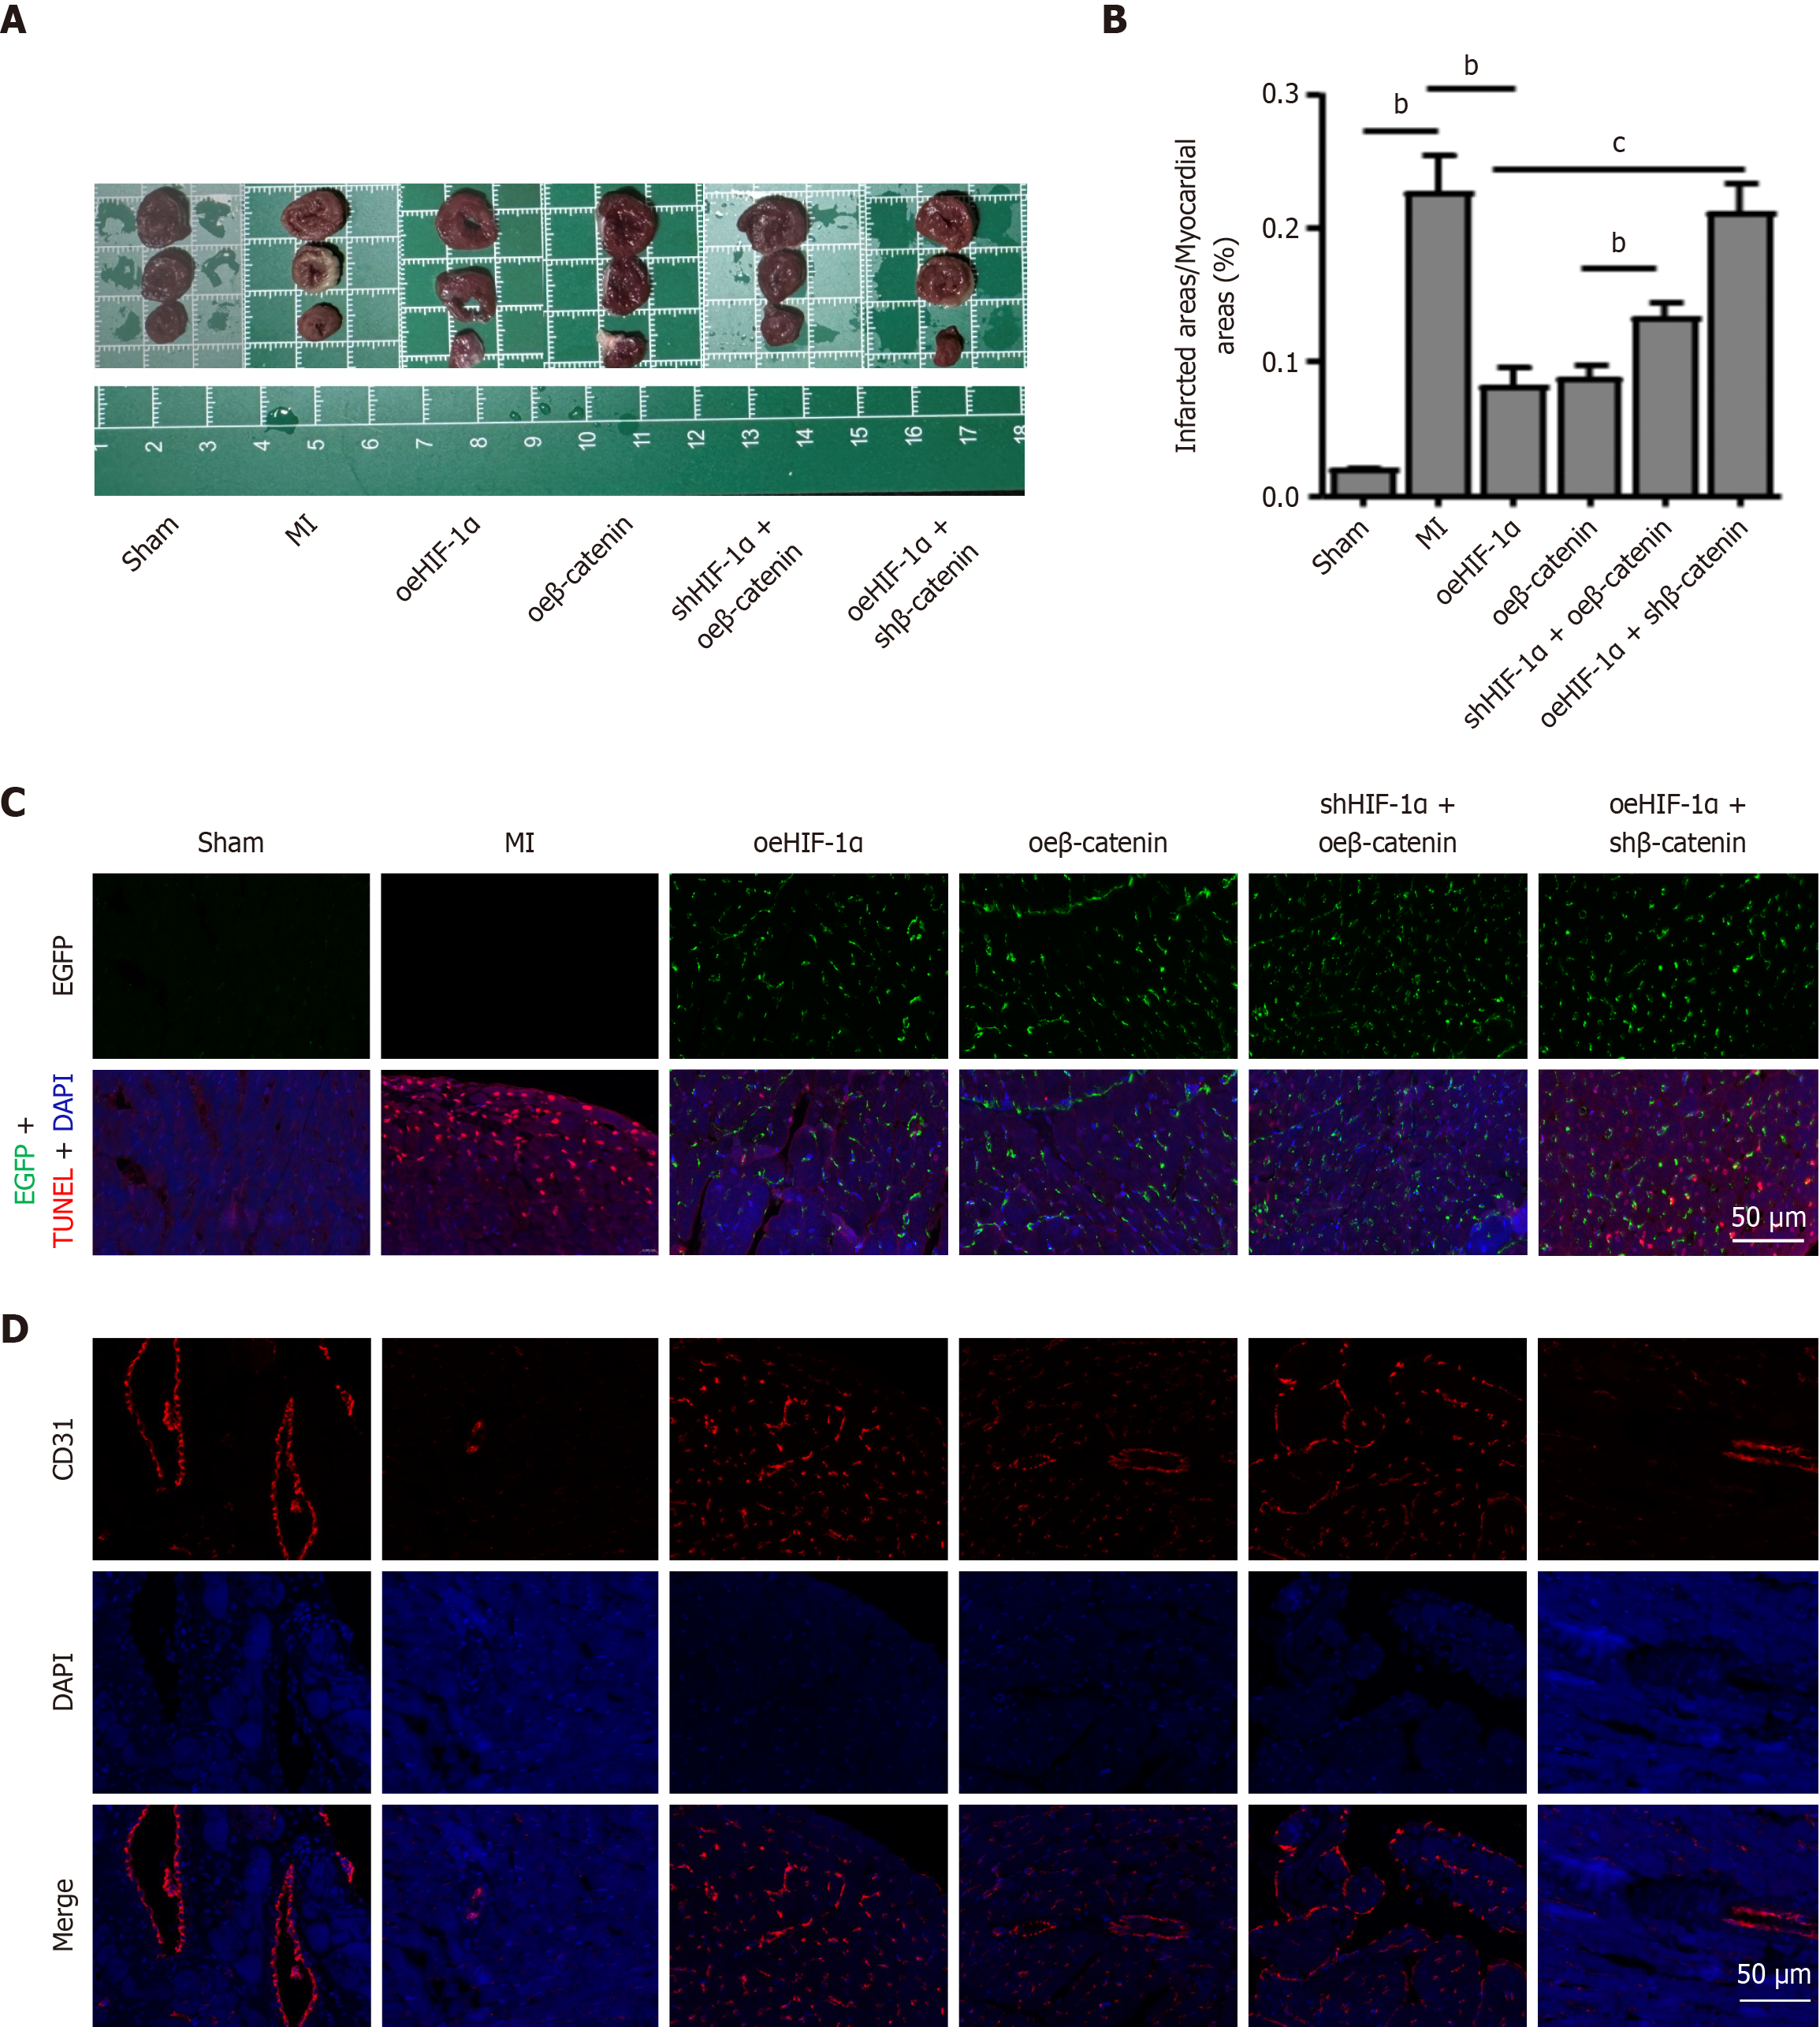
Figure 7 Hypoxia-inducible factor-1α/β-catenin signaling promotes myocardial repair induced by peripheral blood mesenchymal stem cells therapy.
A: Representative triphenyltetrazolium chloride staining of left ventricular basal, middle, and apex cross-sections in the sham, myocardial infarction, hypoxia-inducible factor-1α (HIF-1α) overexpression, β-catenin overexpression, HIF-1α knockdown plus β-catenin overexpression, or HIF-1α overexpression plus β-catenin knockdown-transfected peripheral blood mesenchymal stem cell (PBMSC) groups; B: Triphenyltetrazolium chloride-stained images were sectioned into transverse sections to assess the infarct size; C: Representative fluorescence microscopy images of tissue sections demonstrated the retention of enhanced green fluorescent protein (green)-labeled PBMSCs at the injection site at 90 days after transplantation. Representative double TUNEL staining for apoptotic PBMSCs in the infarcted tissues. 4’,6-diamidino-2-phenylindole was employed as a nuclear marker; D: Myocardial vessels were detected by immunofluorescence staining with an anti-CD31 antibody at 90 days after transplantation. Scale bar = 20 μm. All graphical data are presented as the means ± SEMs. bP < 0.01; cP < 0.001. n = 5 in each group. MI: Myocardial infarction; oeHIF-1α: Hypoxia-inducible factor-1α overexpression; shHIF-1α: Hypoxia-inducible factor-1α knockdown; oeβ-catenin: Β-catenin overexpression; shβ-catenin: Β-catenin knockdown; EGFP: Enhanced green fluorescent protein; DAPI: 4,6-diamino-2-phenylindole.
Figure 8 Hypoxia-inducible factor-1α/β-catenin signaling enhances angiogenesis and inhibits apoptosis of peripheral blood mesenchymal stem cells in infarcted hearts.
The experiment was categorized into 6 groups, including sham, myocardial infarction, hypoxia-inducible factor-1α (HIF-1α) overexpression, β-catenin overexpression, HIF-1α knockdown plus β-catenin overexpression, or HIF-1α overexpression plus β-catenin knockdown-transfected peripheral blood mesenchymal stem cell groups. A: The collagen density of each group was determined by trichrome staining. Hematoxylin and eosin staining revealed varying degrees of fibrocyte infiltration and inflammation (scale bar = 50 μm); B and C: Representative immunoblots and analysis of the protein expression of hypoxia-inducible factor-1α, β-catenin, basic fibroblast growth factor, vascular endothelial growth factor, survivin, Bax, Bcl2, and cleaved caspase 3. All graphical data are presented as the means ± SEMs. aP < 0.05; bP < 0.01; cP < 0.001. n = 5 in each group. H&E: Hematoxylin and eosin; MI: Myocardial infarction; oeHIF-1α: Hypoxia-inducible factor-1α overexpression; shHIF-1α: Hypoxia-inducible factor-1α knockdown; oeβ-catenin: Β-catenin overexpression; shβ-catenin: Β-catenin knockdown; HIF-1α: Hypoxia-inducible factor-1α; VEGF: Vascular endothelial growth factor; bFGF: Basic fibroblast growth factor.
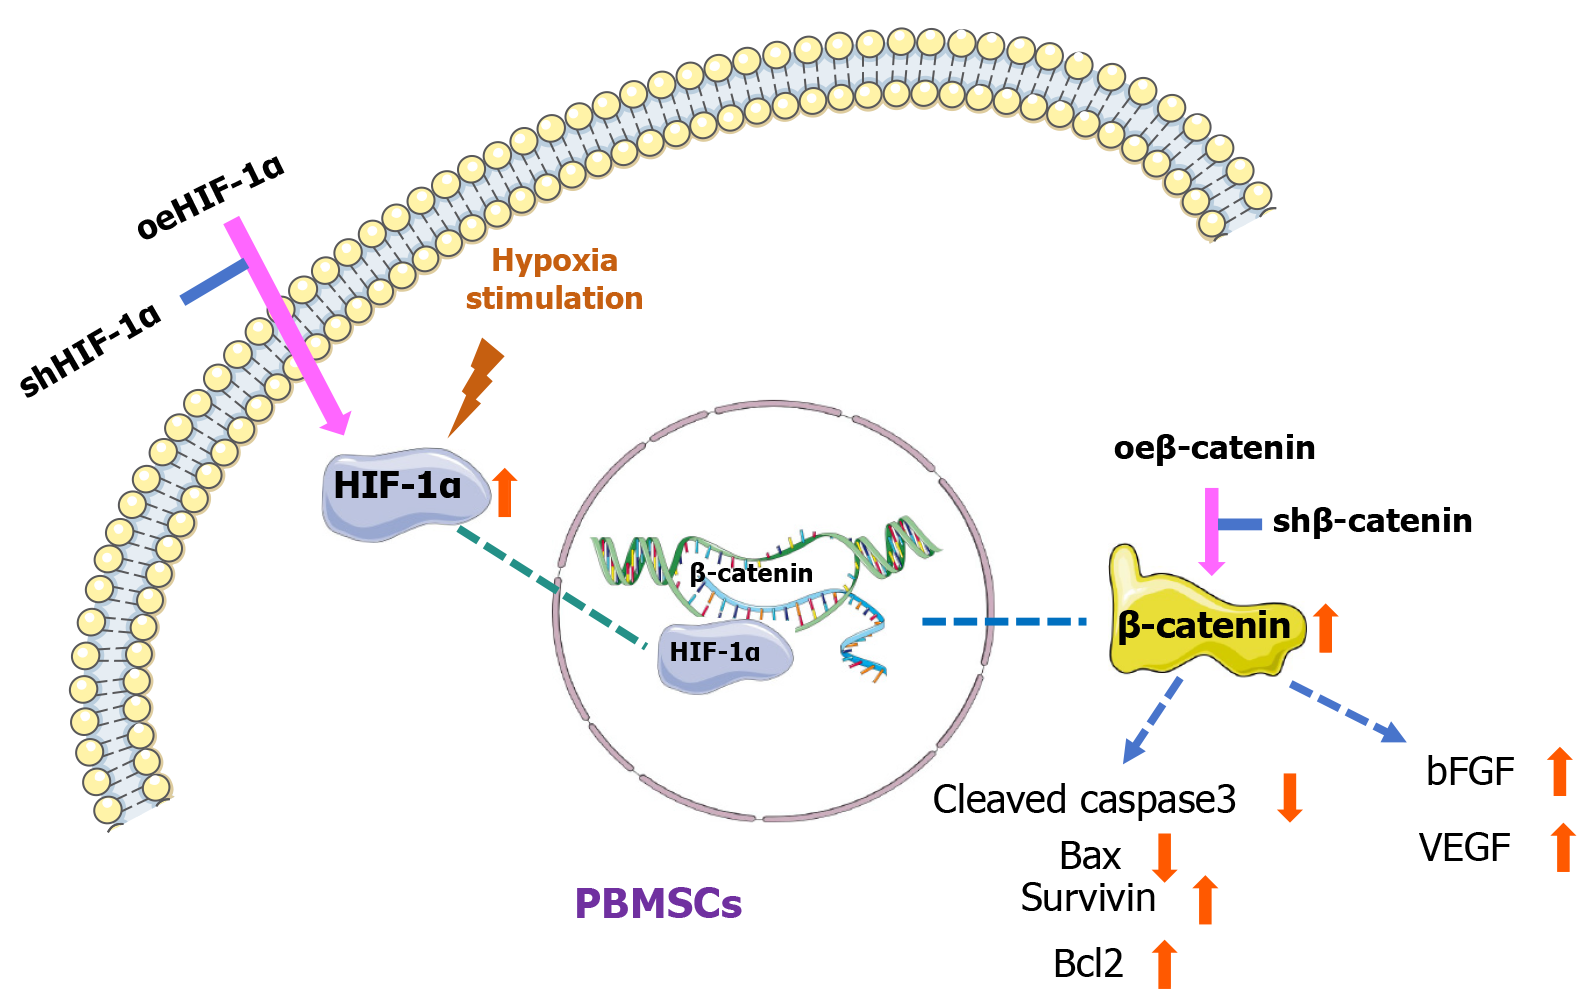
Figure 9 Graphical abstract.
oeHIF-1α: Hypoxia-inducible factor-1α overexpression; shHIF-1α: Hypoxia-inducible factor-1α knockdown; HIF-1α: Hypoxia-inducible factor-1α; oeβ-catenin: Β-catenin overexpression; shβ-catenin: Β-catenin knockdown; PBMSCs: Peripheral blood mesenchymal stem cells; bFGF: Basic fibroblast growth factor; VEGF: Vascular endothelial growth factor.
- Citation: Wang PZ, Wang AQ, Tian PG, Zhu PP, Yuan W, Wu J, Zhang R. HIF-1α modulates β-catenin pathway to enhance the survival and angiogenesis of PBMSCs under hypoxia environment. World J Stem Cells 2025; 17(11): 112484
- URL: https://www.wjgnet.com/1948-0210/full/v17/i11/112484.htm
- DOI: https://dx.doi.org/10.4252/wjsc.v17.i11.112484


