Copyright
©The Author(s) 2025.
World J Stem Cells. Oct 26, 2025; 17(10): 111978
Published online Oct 26, 2025. doi: 10.4252/wjsc.v17.i10.111978
Published online Oct 26, 2025. doi: 10.4252/wjsc.v17.i10.111978
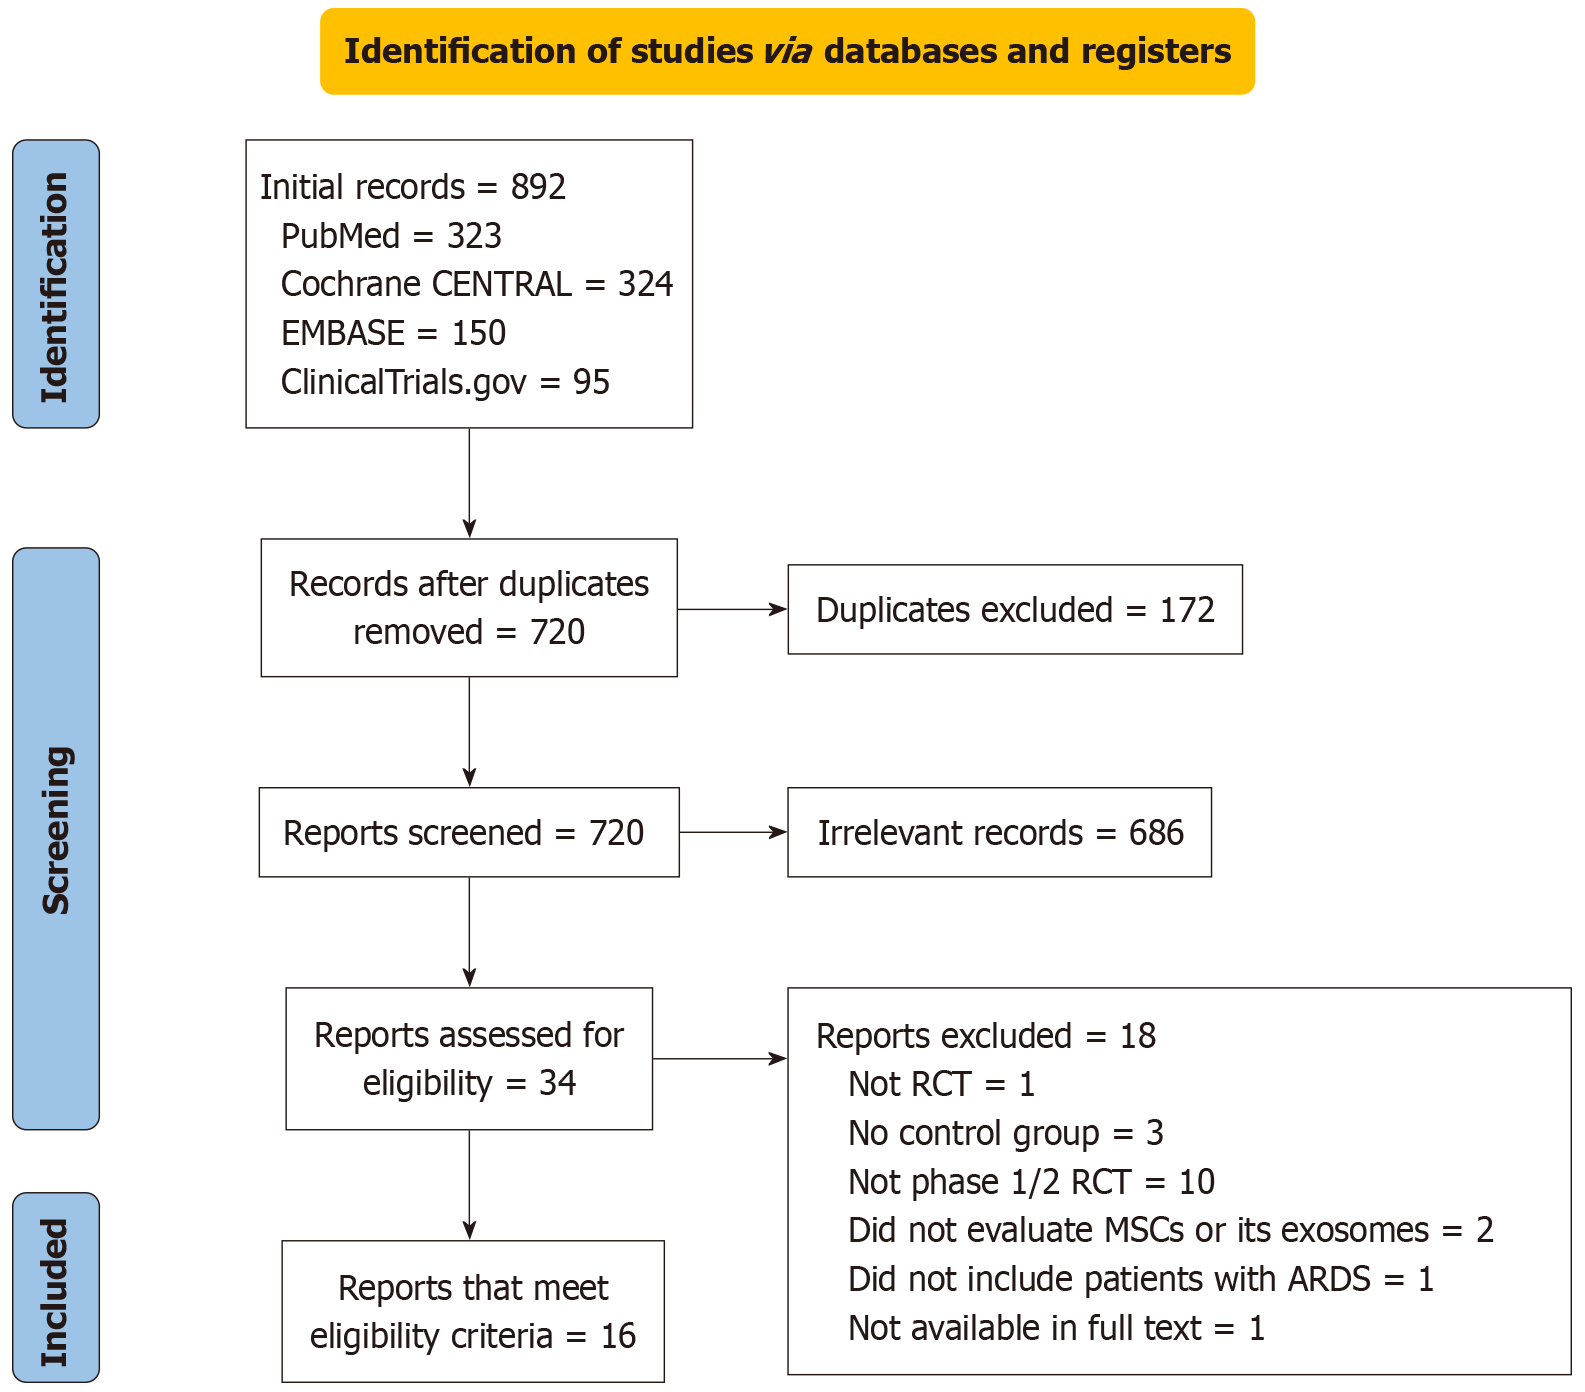
Figure 1 Study selection flow diagram (PRISMA chart).
RCT: Randomized controlled trial; MSCs: Mesenchymal stem cells; ARDS: Acute respiratory distress syndrome.
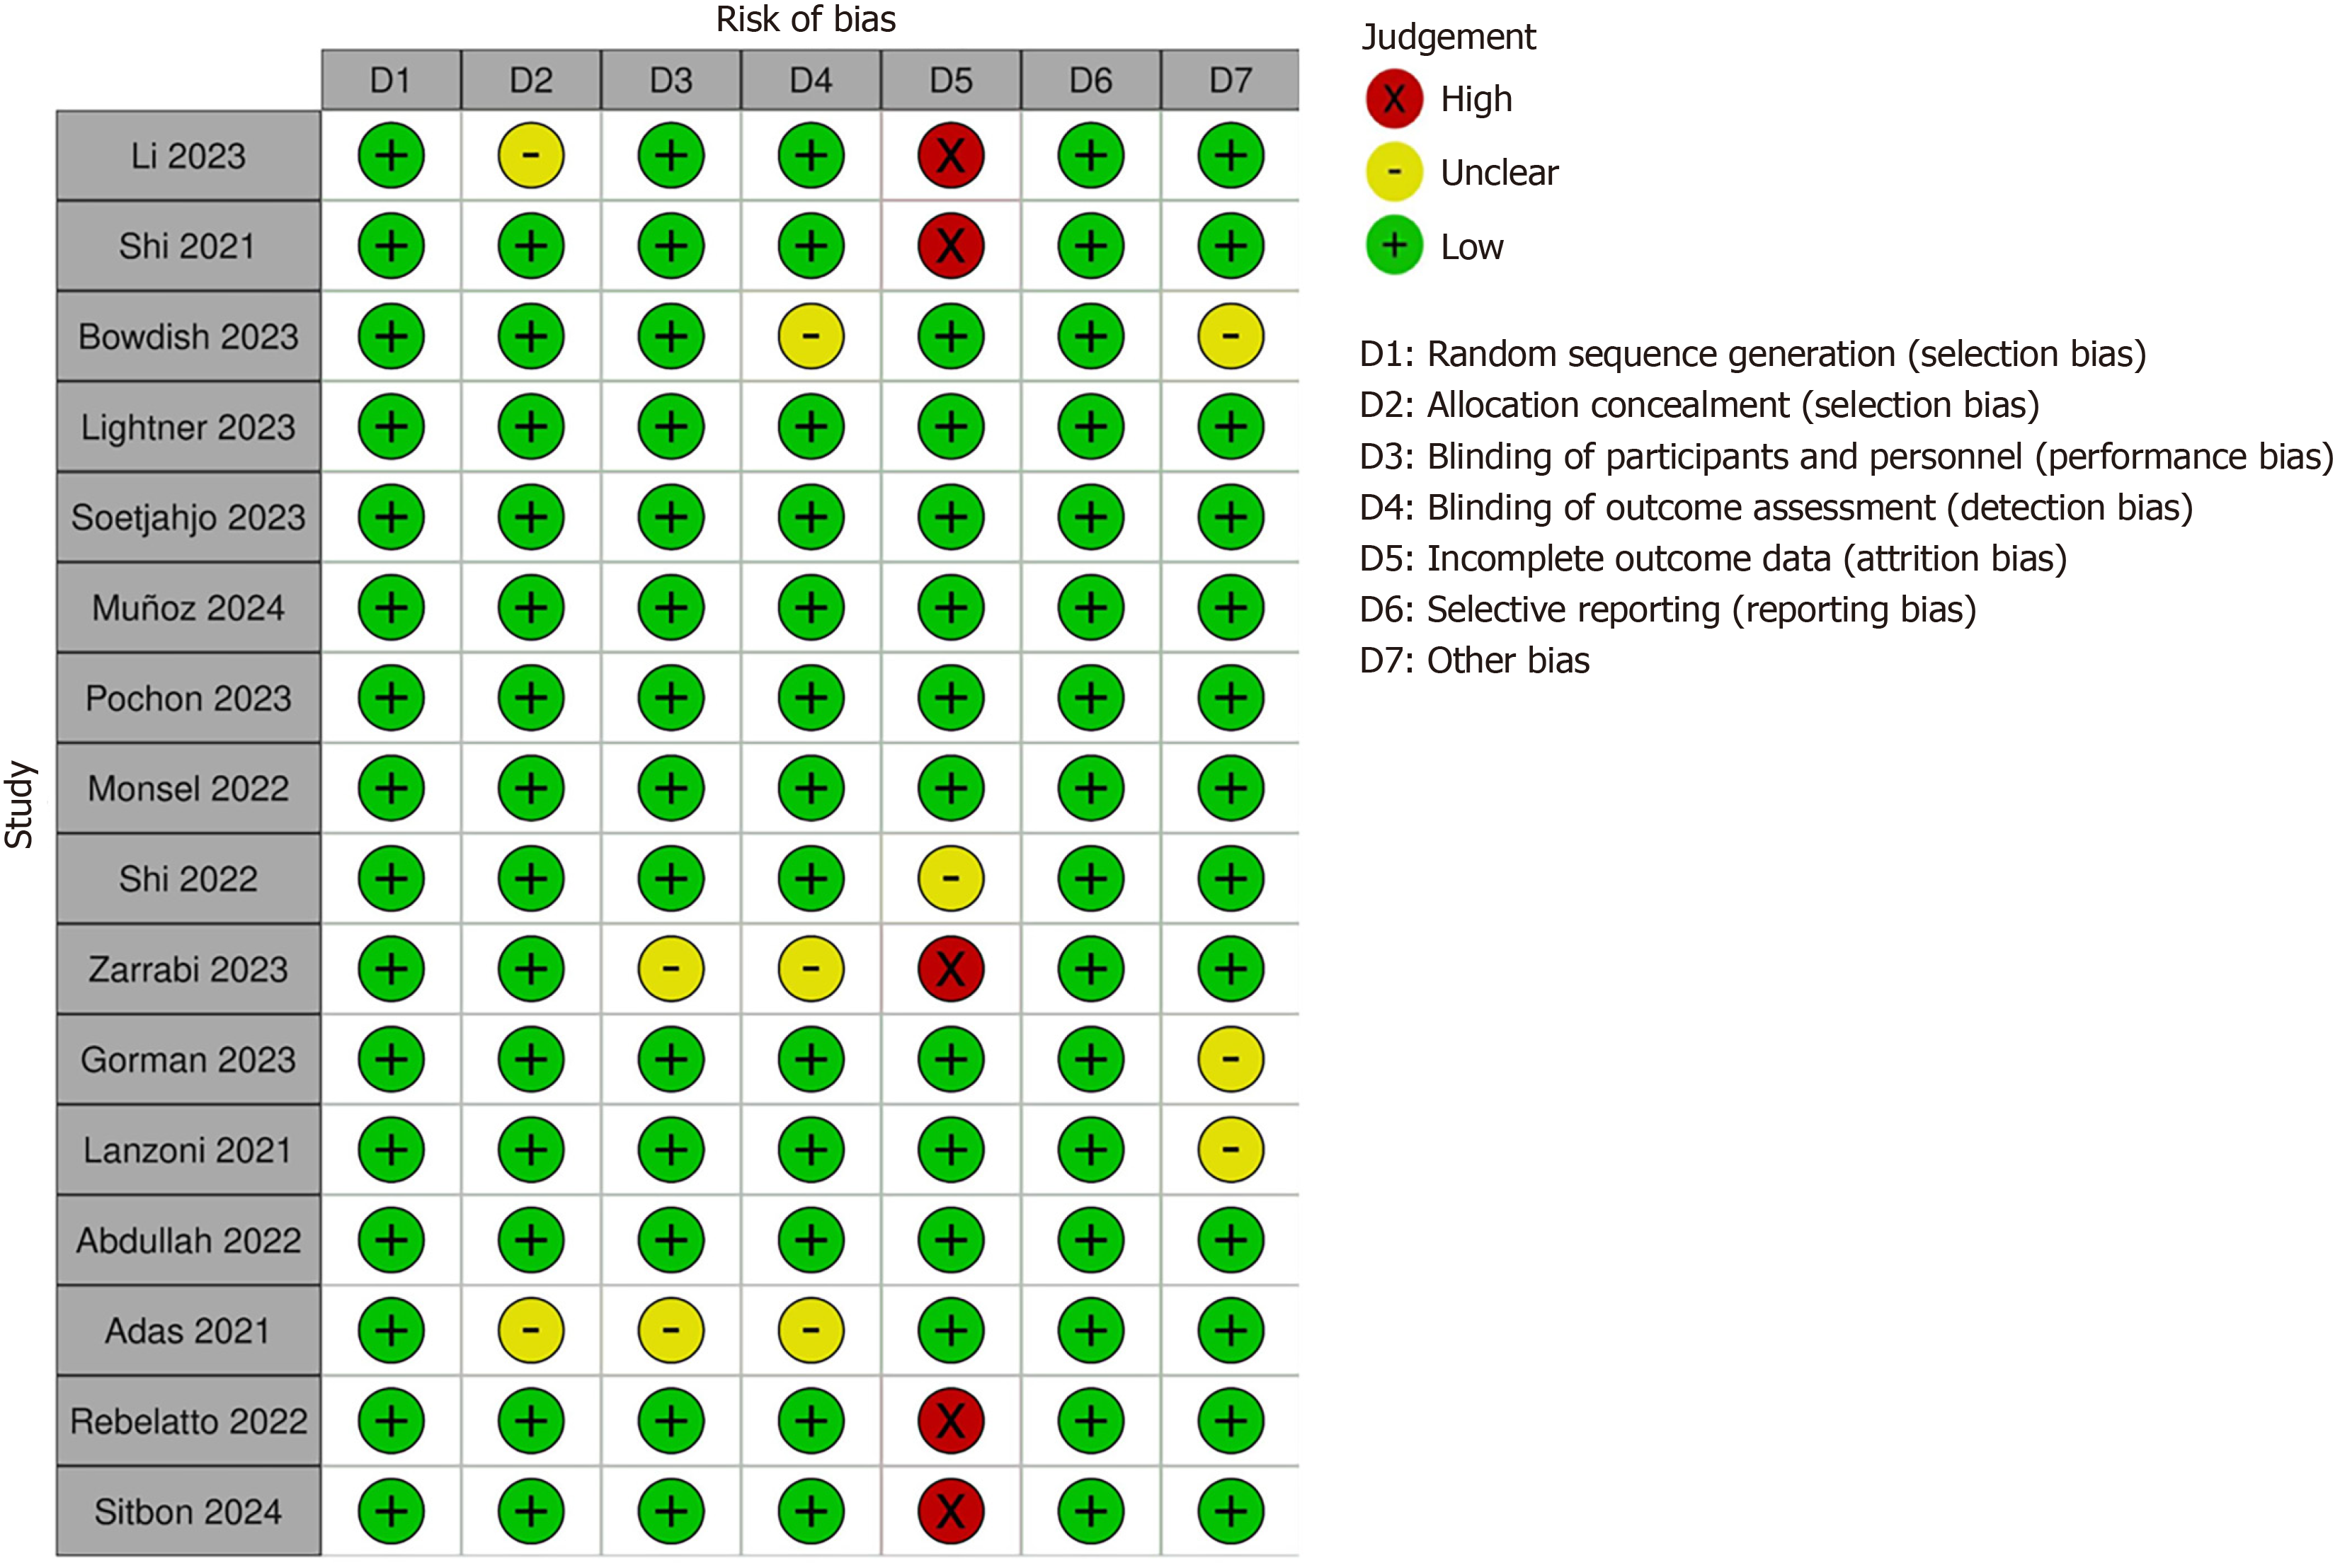
Figure 2 The quality assessment of the included trials based on the Cochrane risk of bias tool 1.
D: Domain.
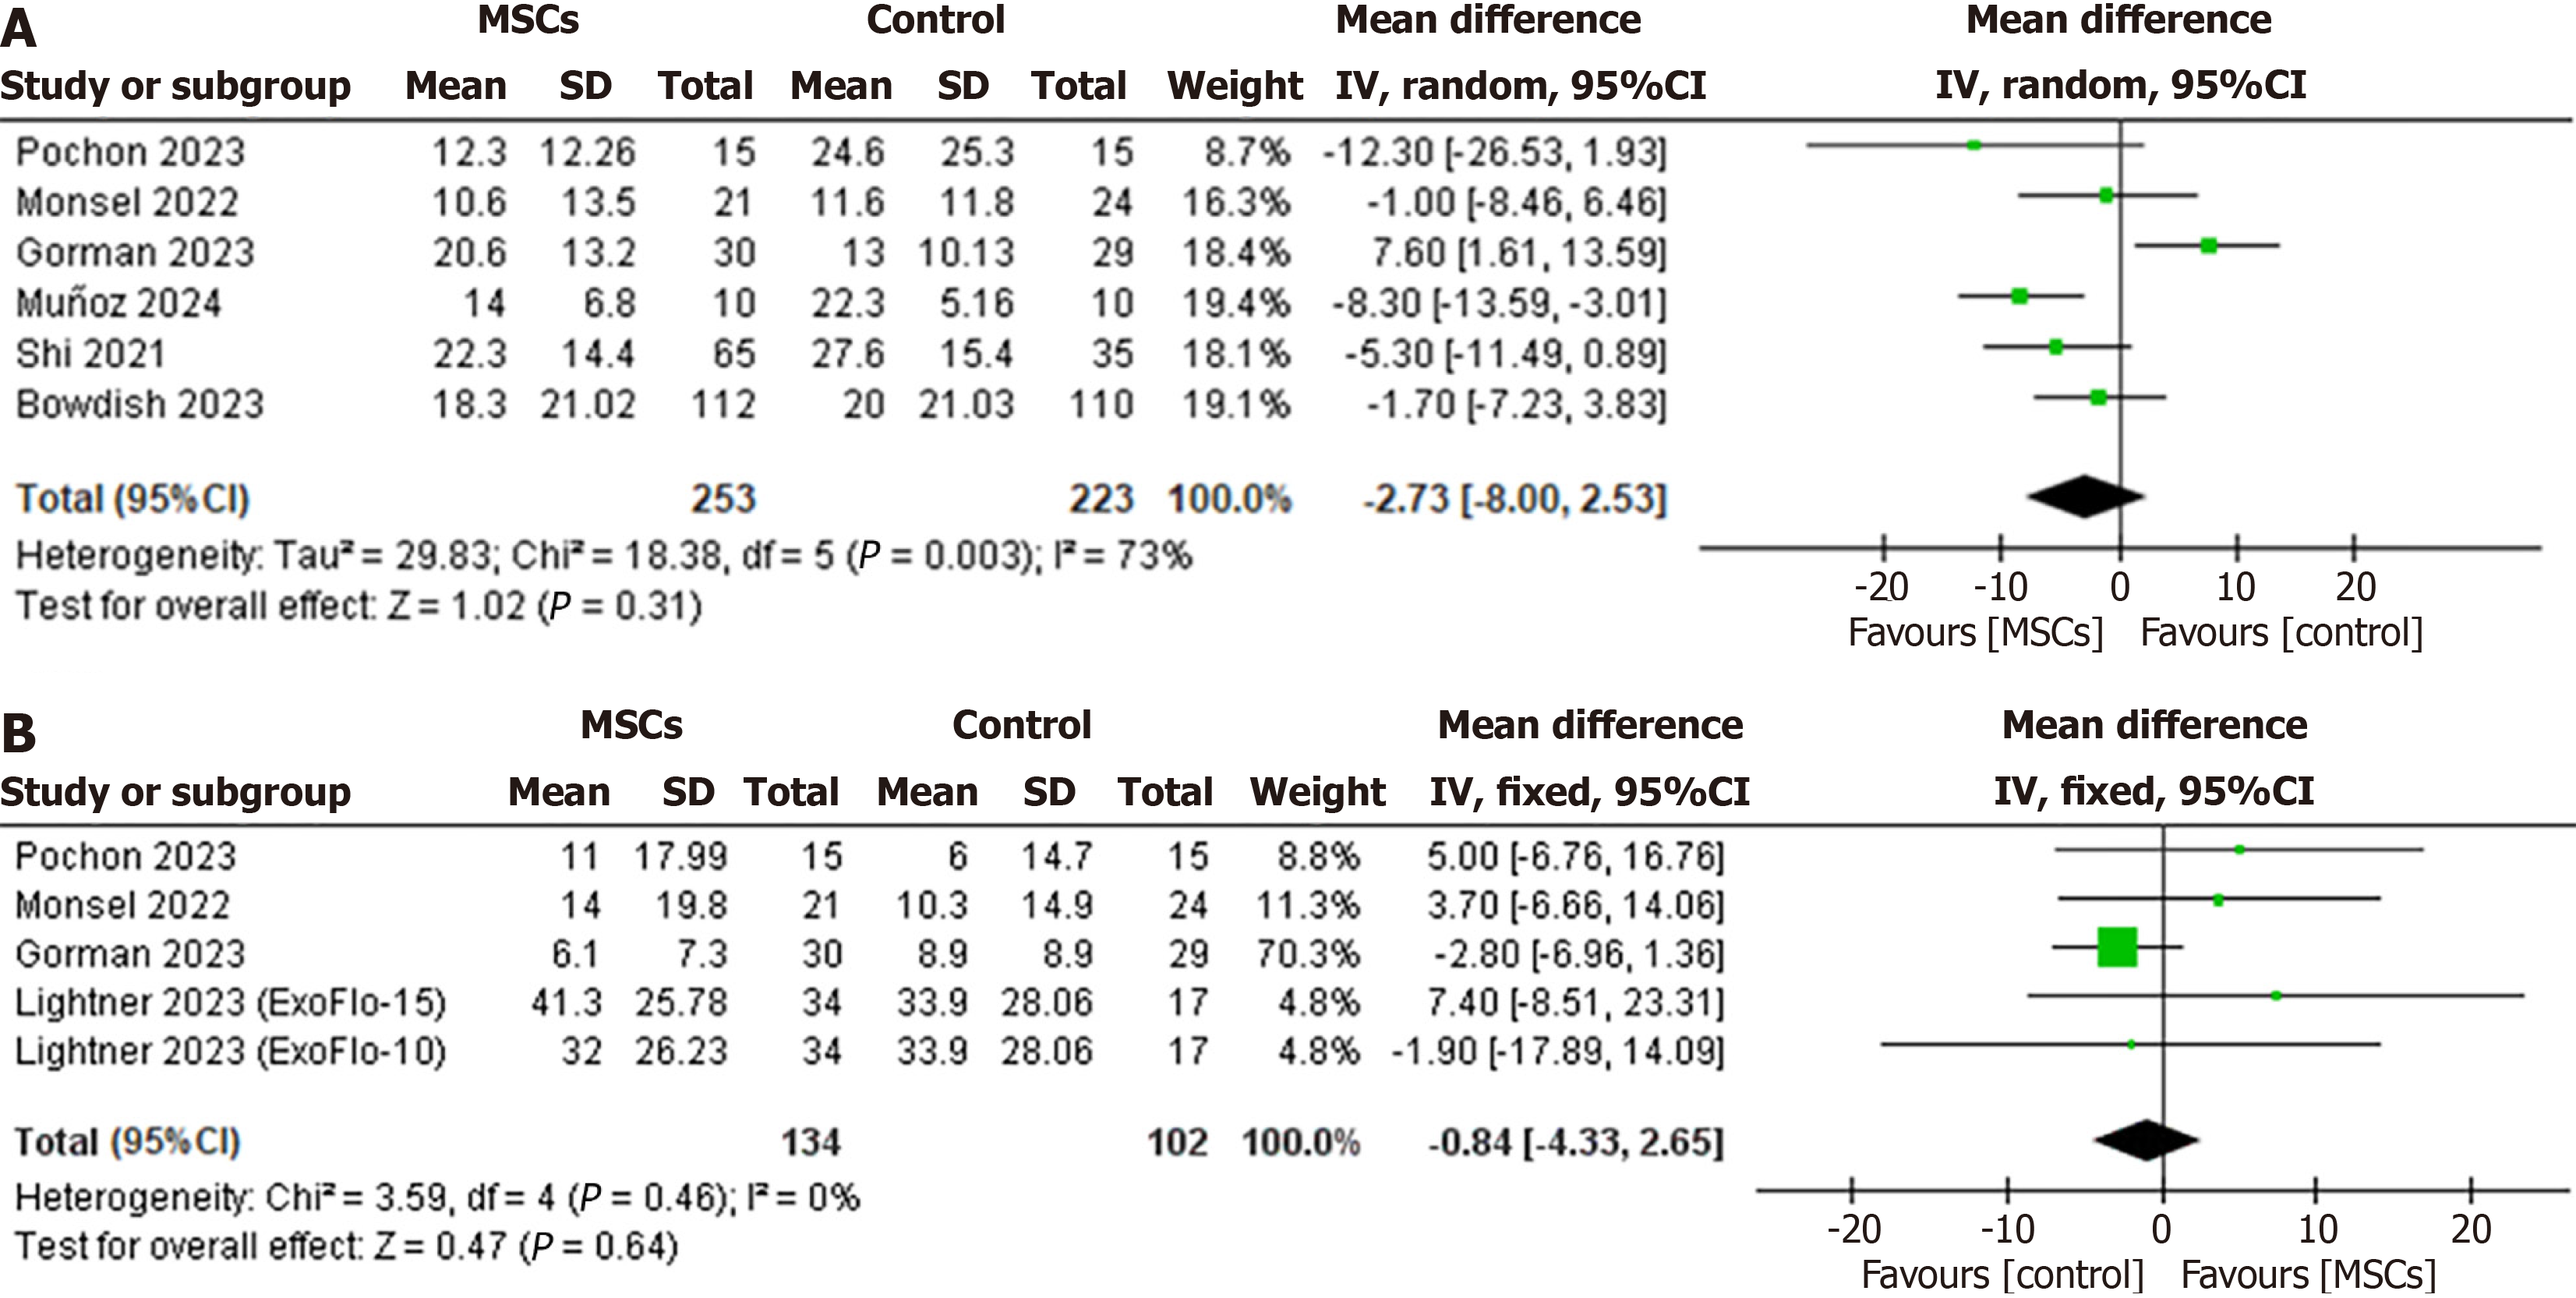
Figure 3 Forest plots showing duration of mechanical ventilation and ventilation-free days in patients treated with mesenchymal stem cells vs control.
A: Forest plots showing duration of mechanical ventilation in patients treated with mesenchymal stem cells vs control; B: Forest plots showing ventilation-free days in patients treated with mesenchymal stem cells vs control. The pooled weighted mean difference, along with its 95% confidence interval, is presented. Each square represents the effect estimate of an individual study, with the size proportional to its weight in the meta-analysis; horizontal lines denote the 95% confidence interval. The diamond indicates the overall pooled effect. MSC: Mesenchymal stem cell; CI: Confidence interval.
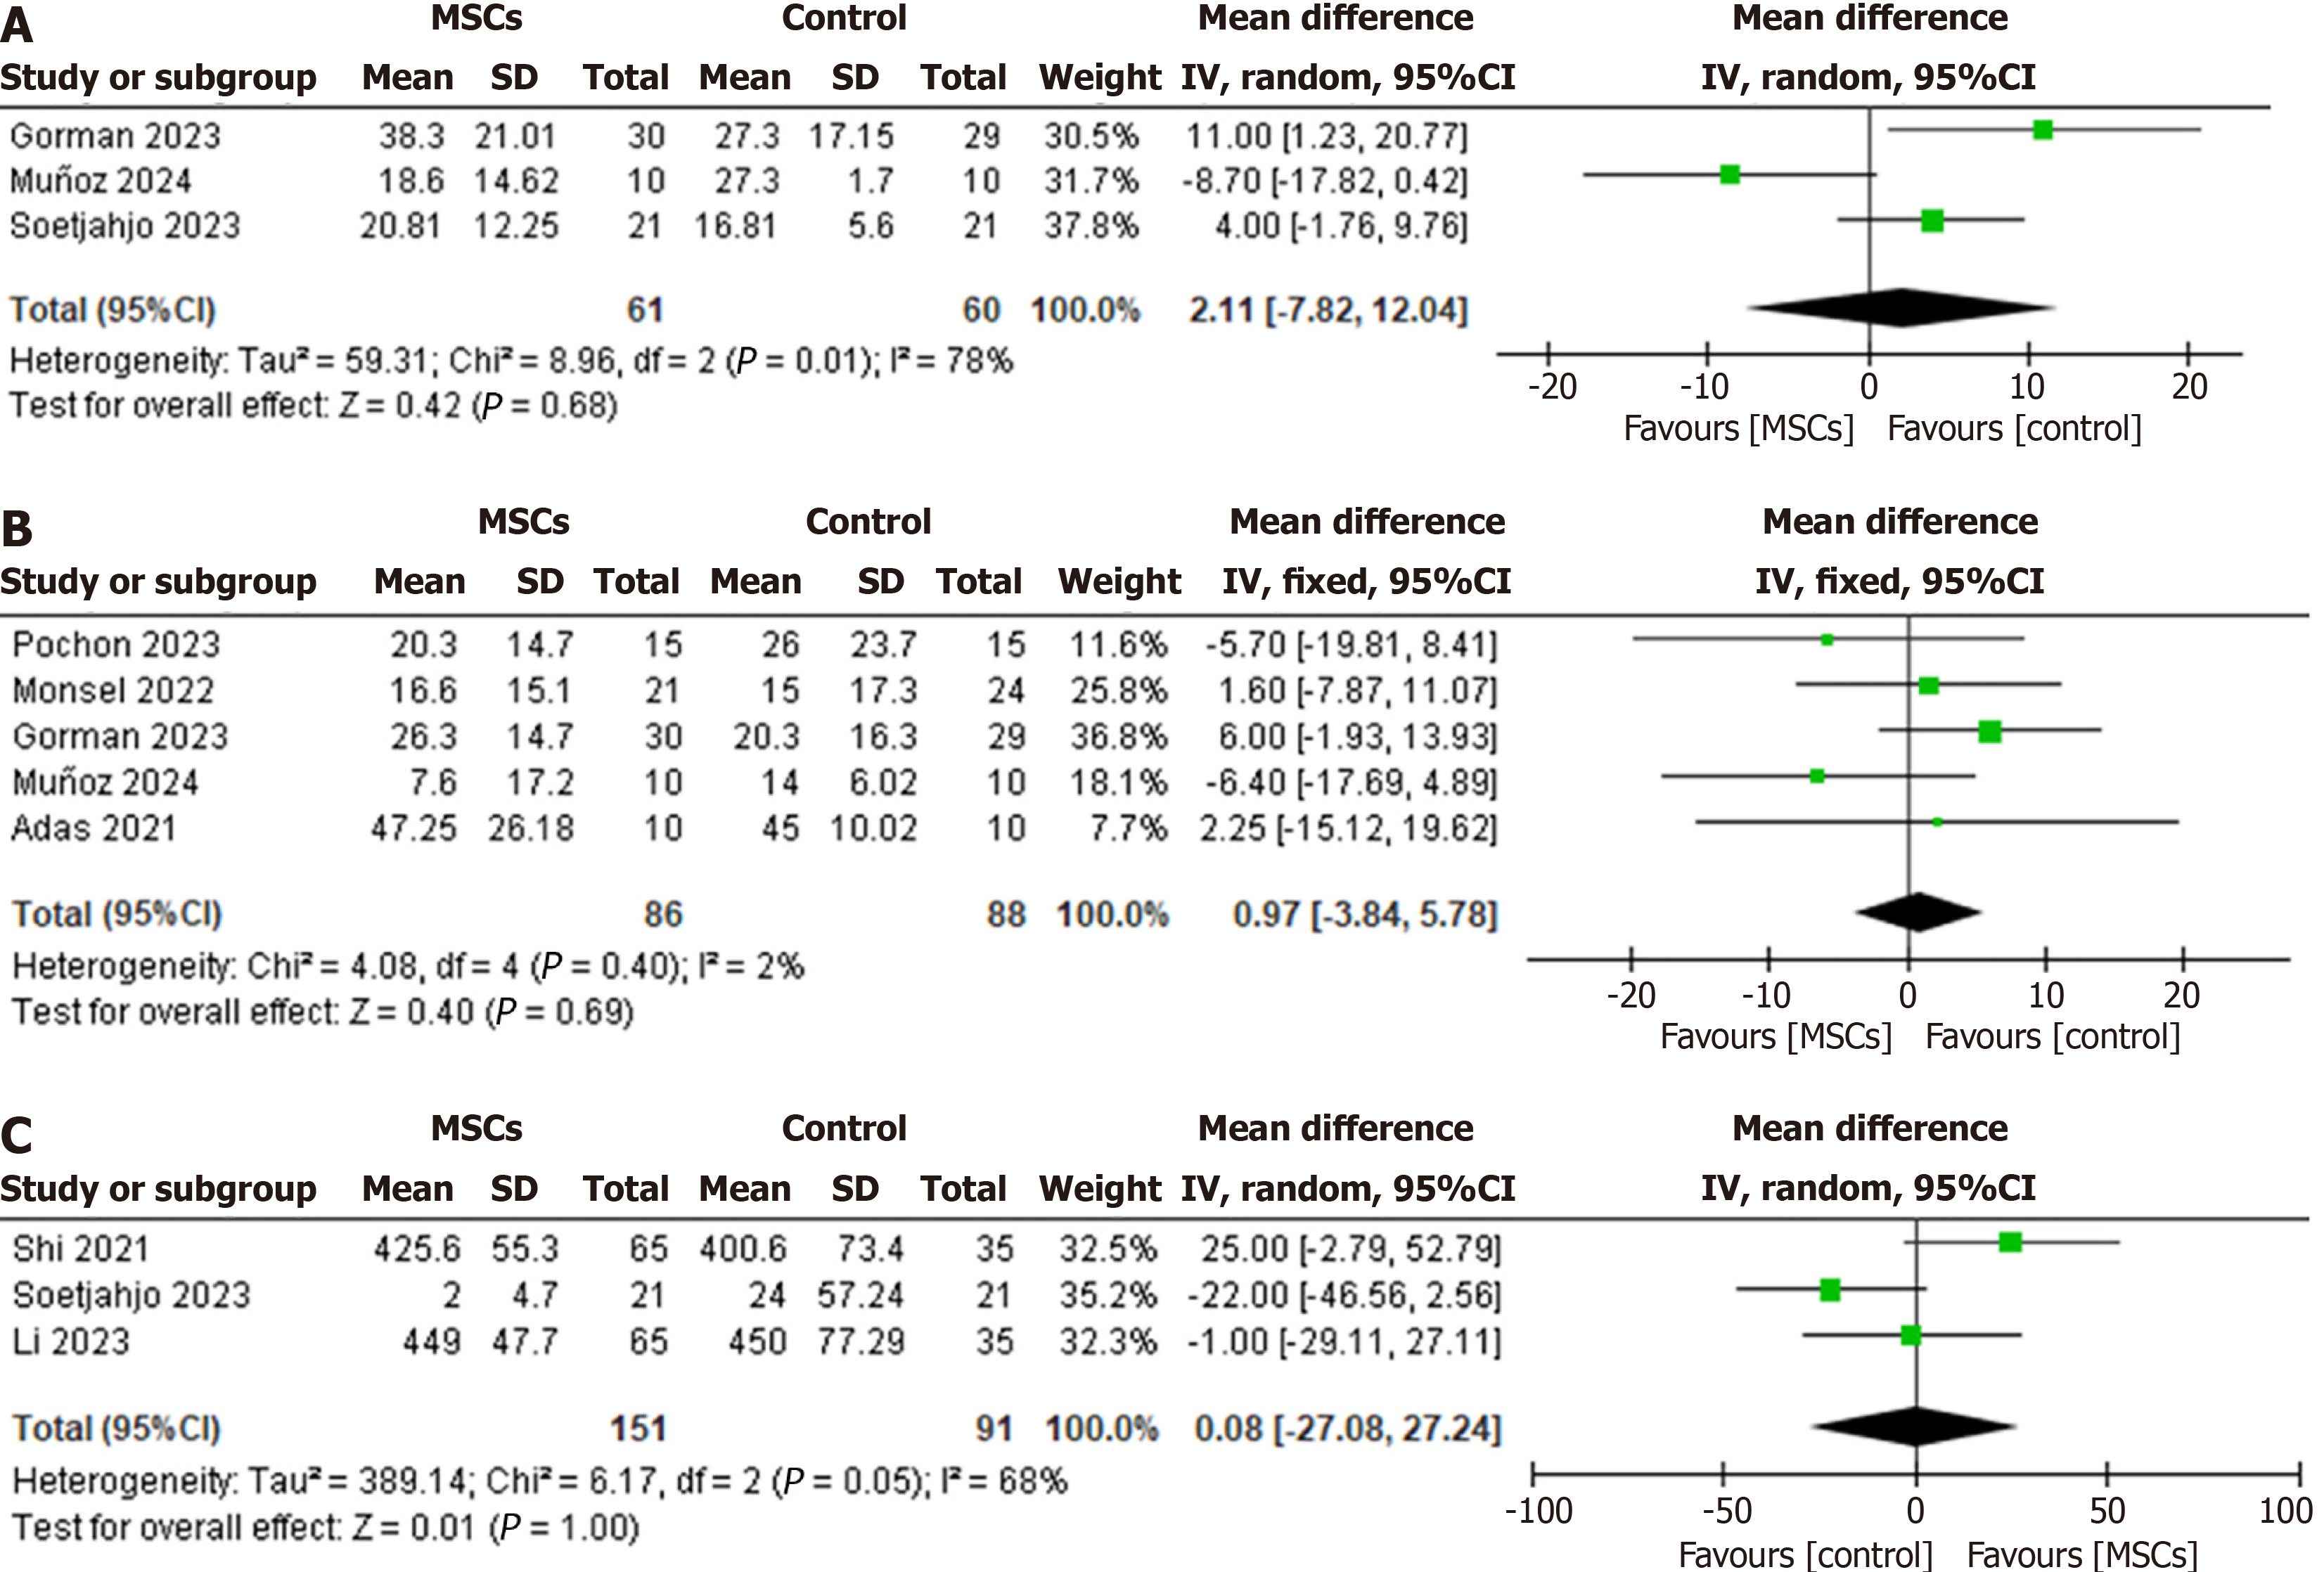
Figure 4 Forest plot showing length of hospital stay, length of intensive care unit stay, and 6-minute walk distance test to determine the change in patients treated with mesenchymal stem cells vs the control.
A: Forest plot showing length of hospital stay to determine the change in patients treated with mesenchymal stem cells (MSCs) vs the control; B: Forest plot showing length of intensive care unit stay to determine the change in patients treated with MSCs vs the control; C: Forest plot showing 6-minute walk distance test to determine the change in patients treated with MSCs vs the control. The pooled weighted mean difference, along with its 95% confidence interval, is presented. Each square represents the effect estimate of an individual study, with the size proportional to its weight in the meta-analysis; horizontal lines denote the 95% confidence interval. The diamond indicates the overall pooled effect. MSC: Mesenchymal stem cell; CI: Confidence interval.
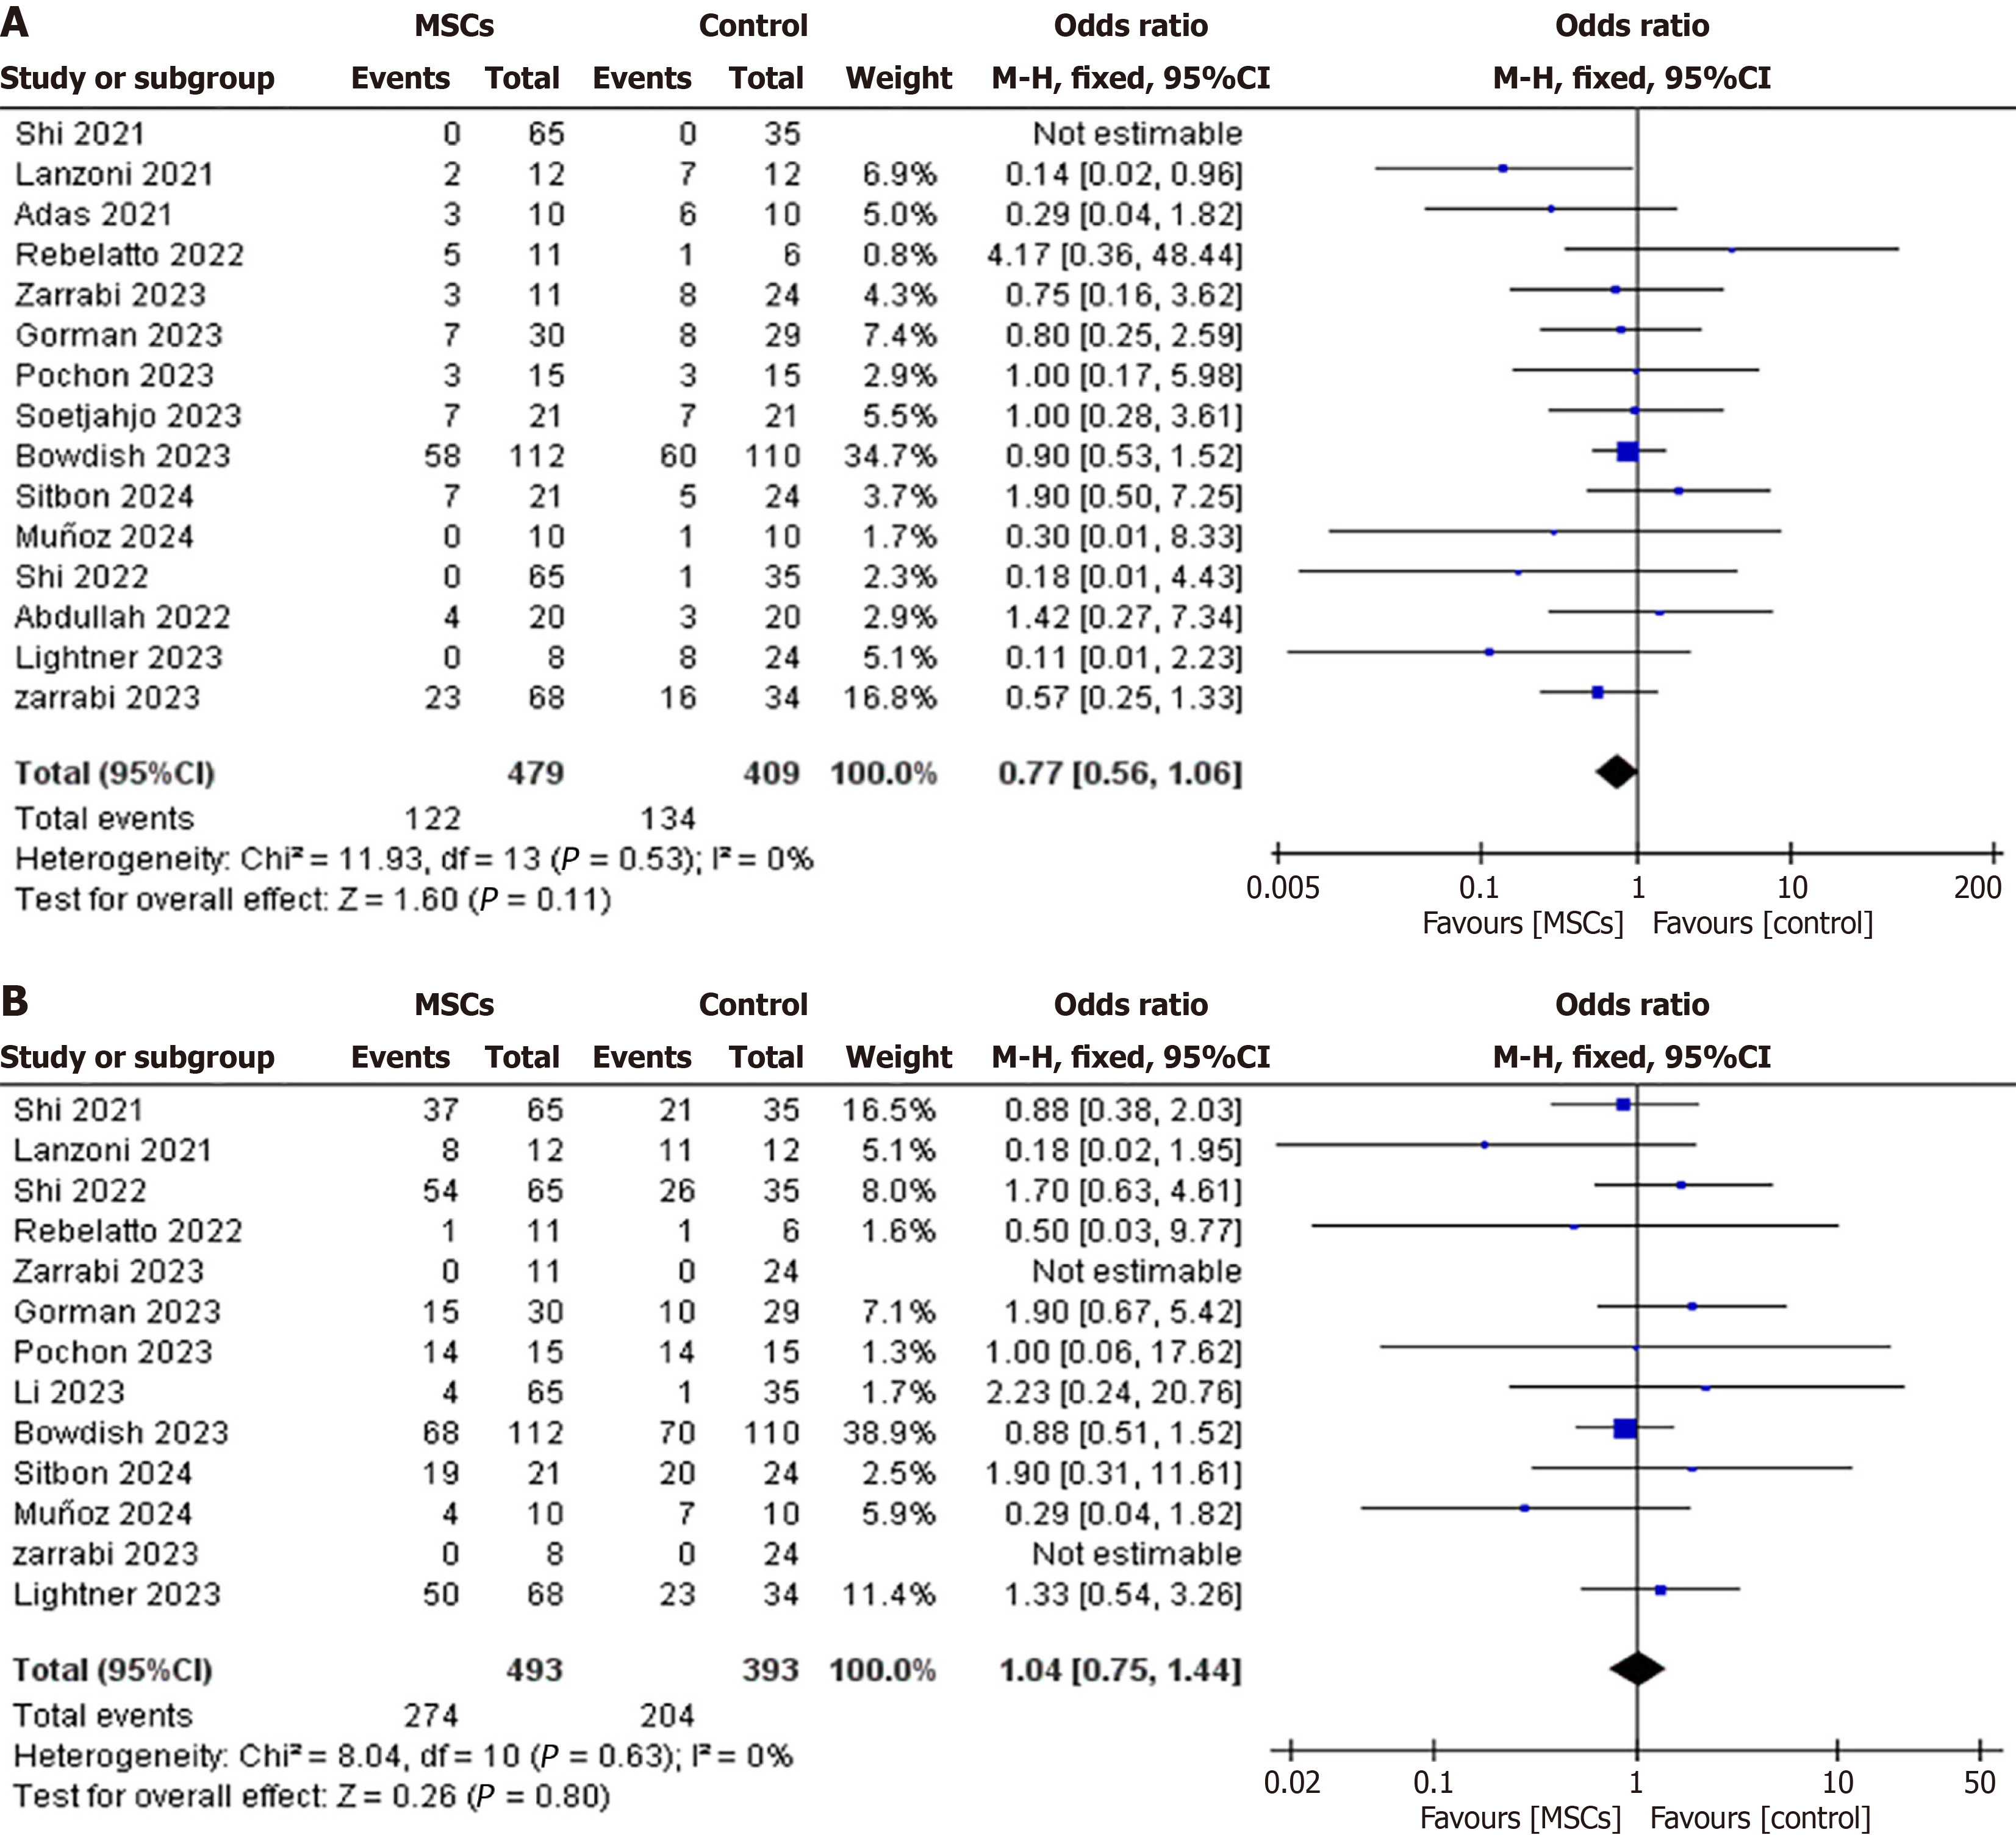
Figure 5 Forest plot showing the effect of mesenchymal stem cells and exosomes on mortality and odds ratio of adverse events.
A: Forest plot showing the effect of mesenchymal stem cells and exosomes on mortality rates; B: Forest plot showing the effect of mesenchymal stem cells and exosomes on the odds ratio of adverse events. The pooled odds ratio, along with its 95% confidence interval, is presented. Each square represents the effect estimate of an individual study, with the size proportional to its weight in the meta-analysis; horizontal lines denote the 95% confidence interval. The diamond indicates the overall pooled effect. MSC: Mesenchymal stem cell; CI: Confidence interval.
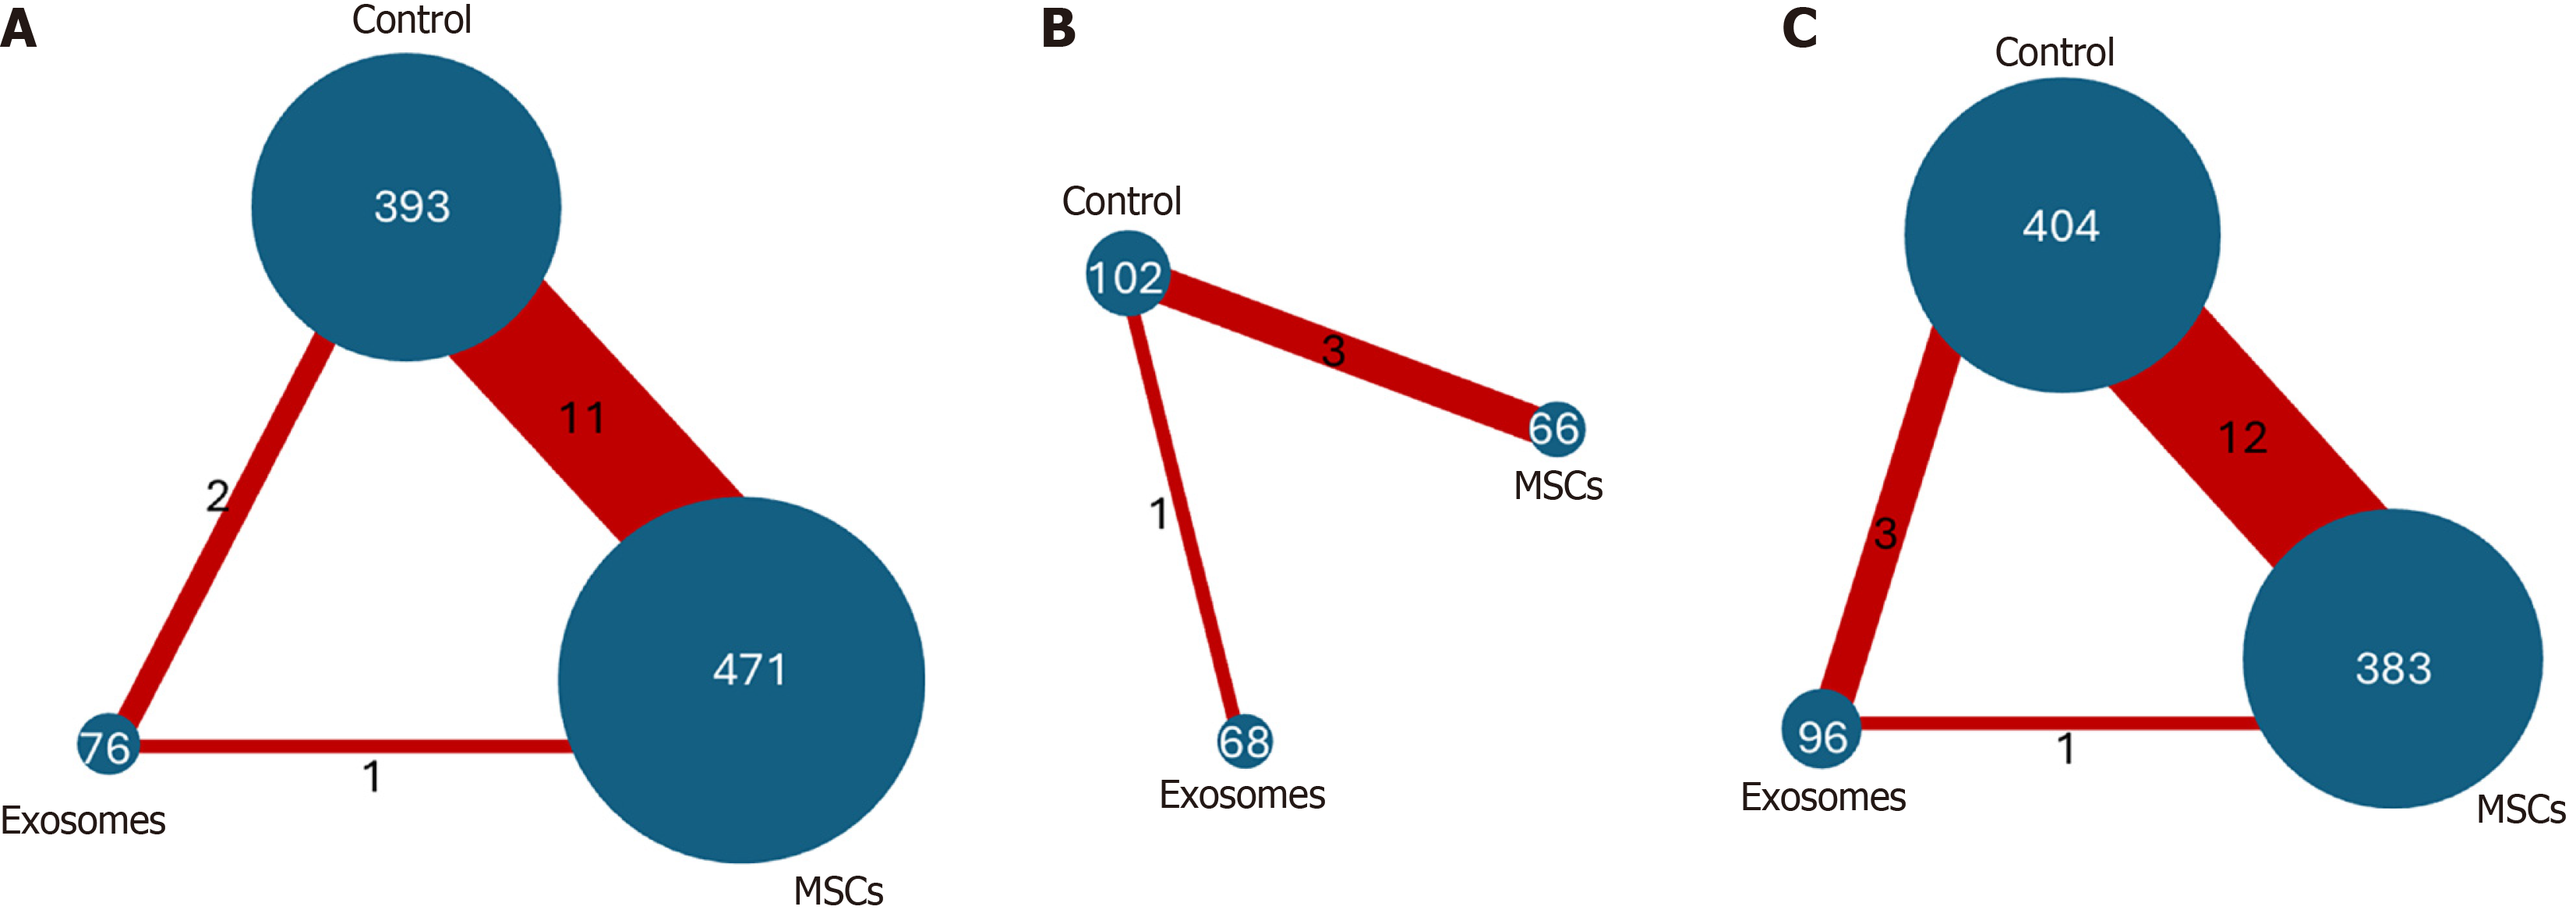
Figure 6 Network graphs of the effect of different treatment arms on mechanical ventilation-free days, mortality, and adverse events.
A: Network graphs of the effect of different treatment arms on adverse events; B: Network graphs of the effect of different treatment arms on mechanical ventilation-free days; C: Network graphs of the effect of different treatment arms on mortality. MSC: Mesenchymal stem cell.
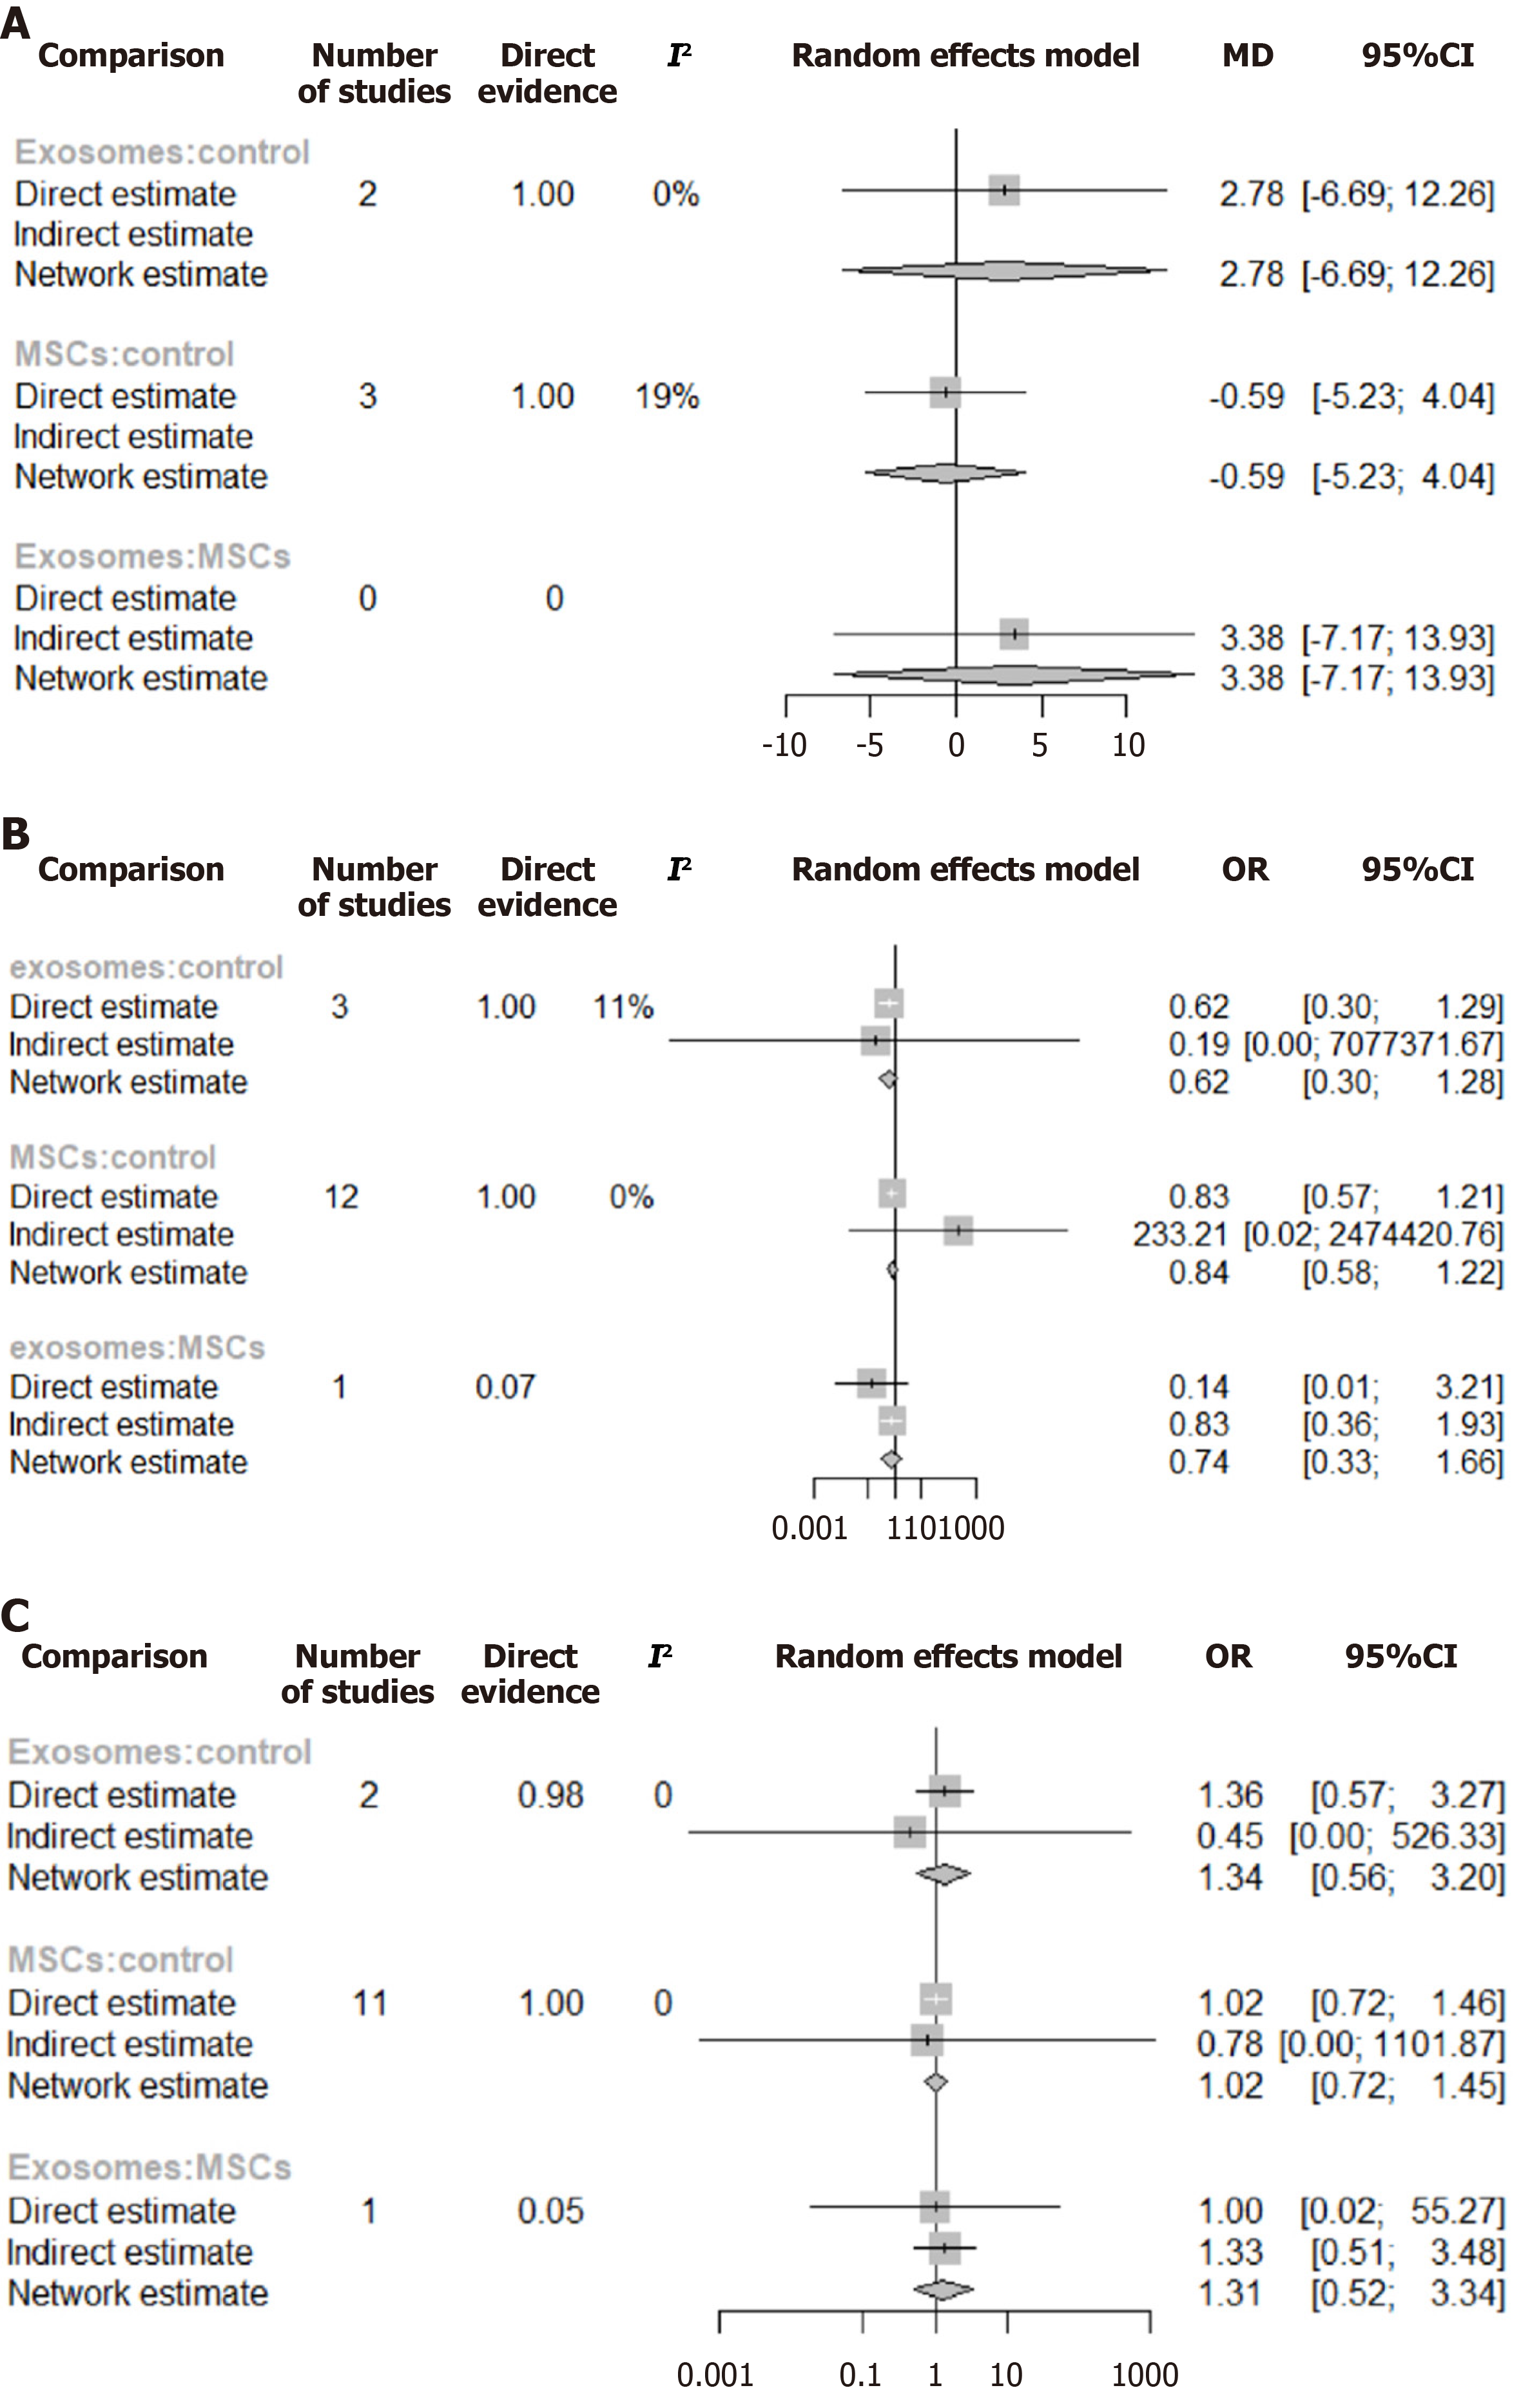
Figure 7 Network meta-analysis comparing exosomes and mesenchymal stem cells vs control interventions.
A-C: Forest plots showing mechanical ventilation-free days (mean difference) (A), mortality (odds ratio) (B), and adverse events (odds ratio) (C). Each panel displays direct estimates, indirect estimates, and network estimates, along with 95% confidence intervals. The analysis includes three treatment comparisons: Exosomes vs control, mesenchymal stem cells vs control, and exosomes vs mesenchymal stem cells. Numbers indicate the number of studies contributing to each comparison, with I2 values representing the level of heterogeneity. MD: Mean difference; OR: Odds ratio; CI: Confidence interval.
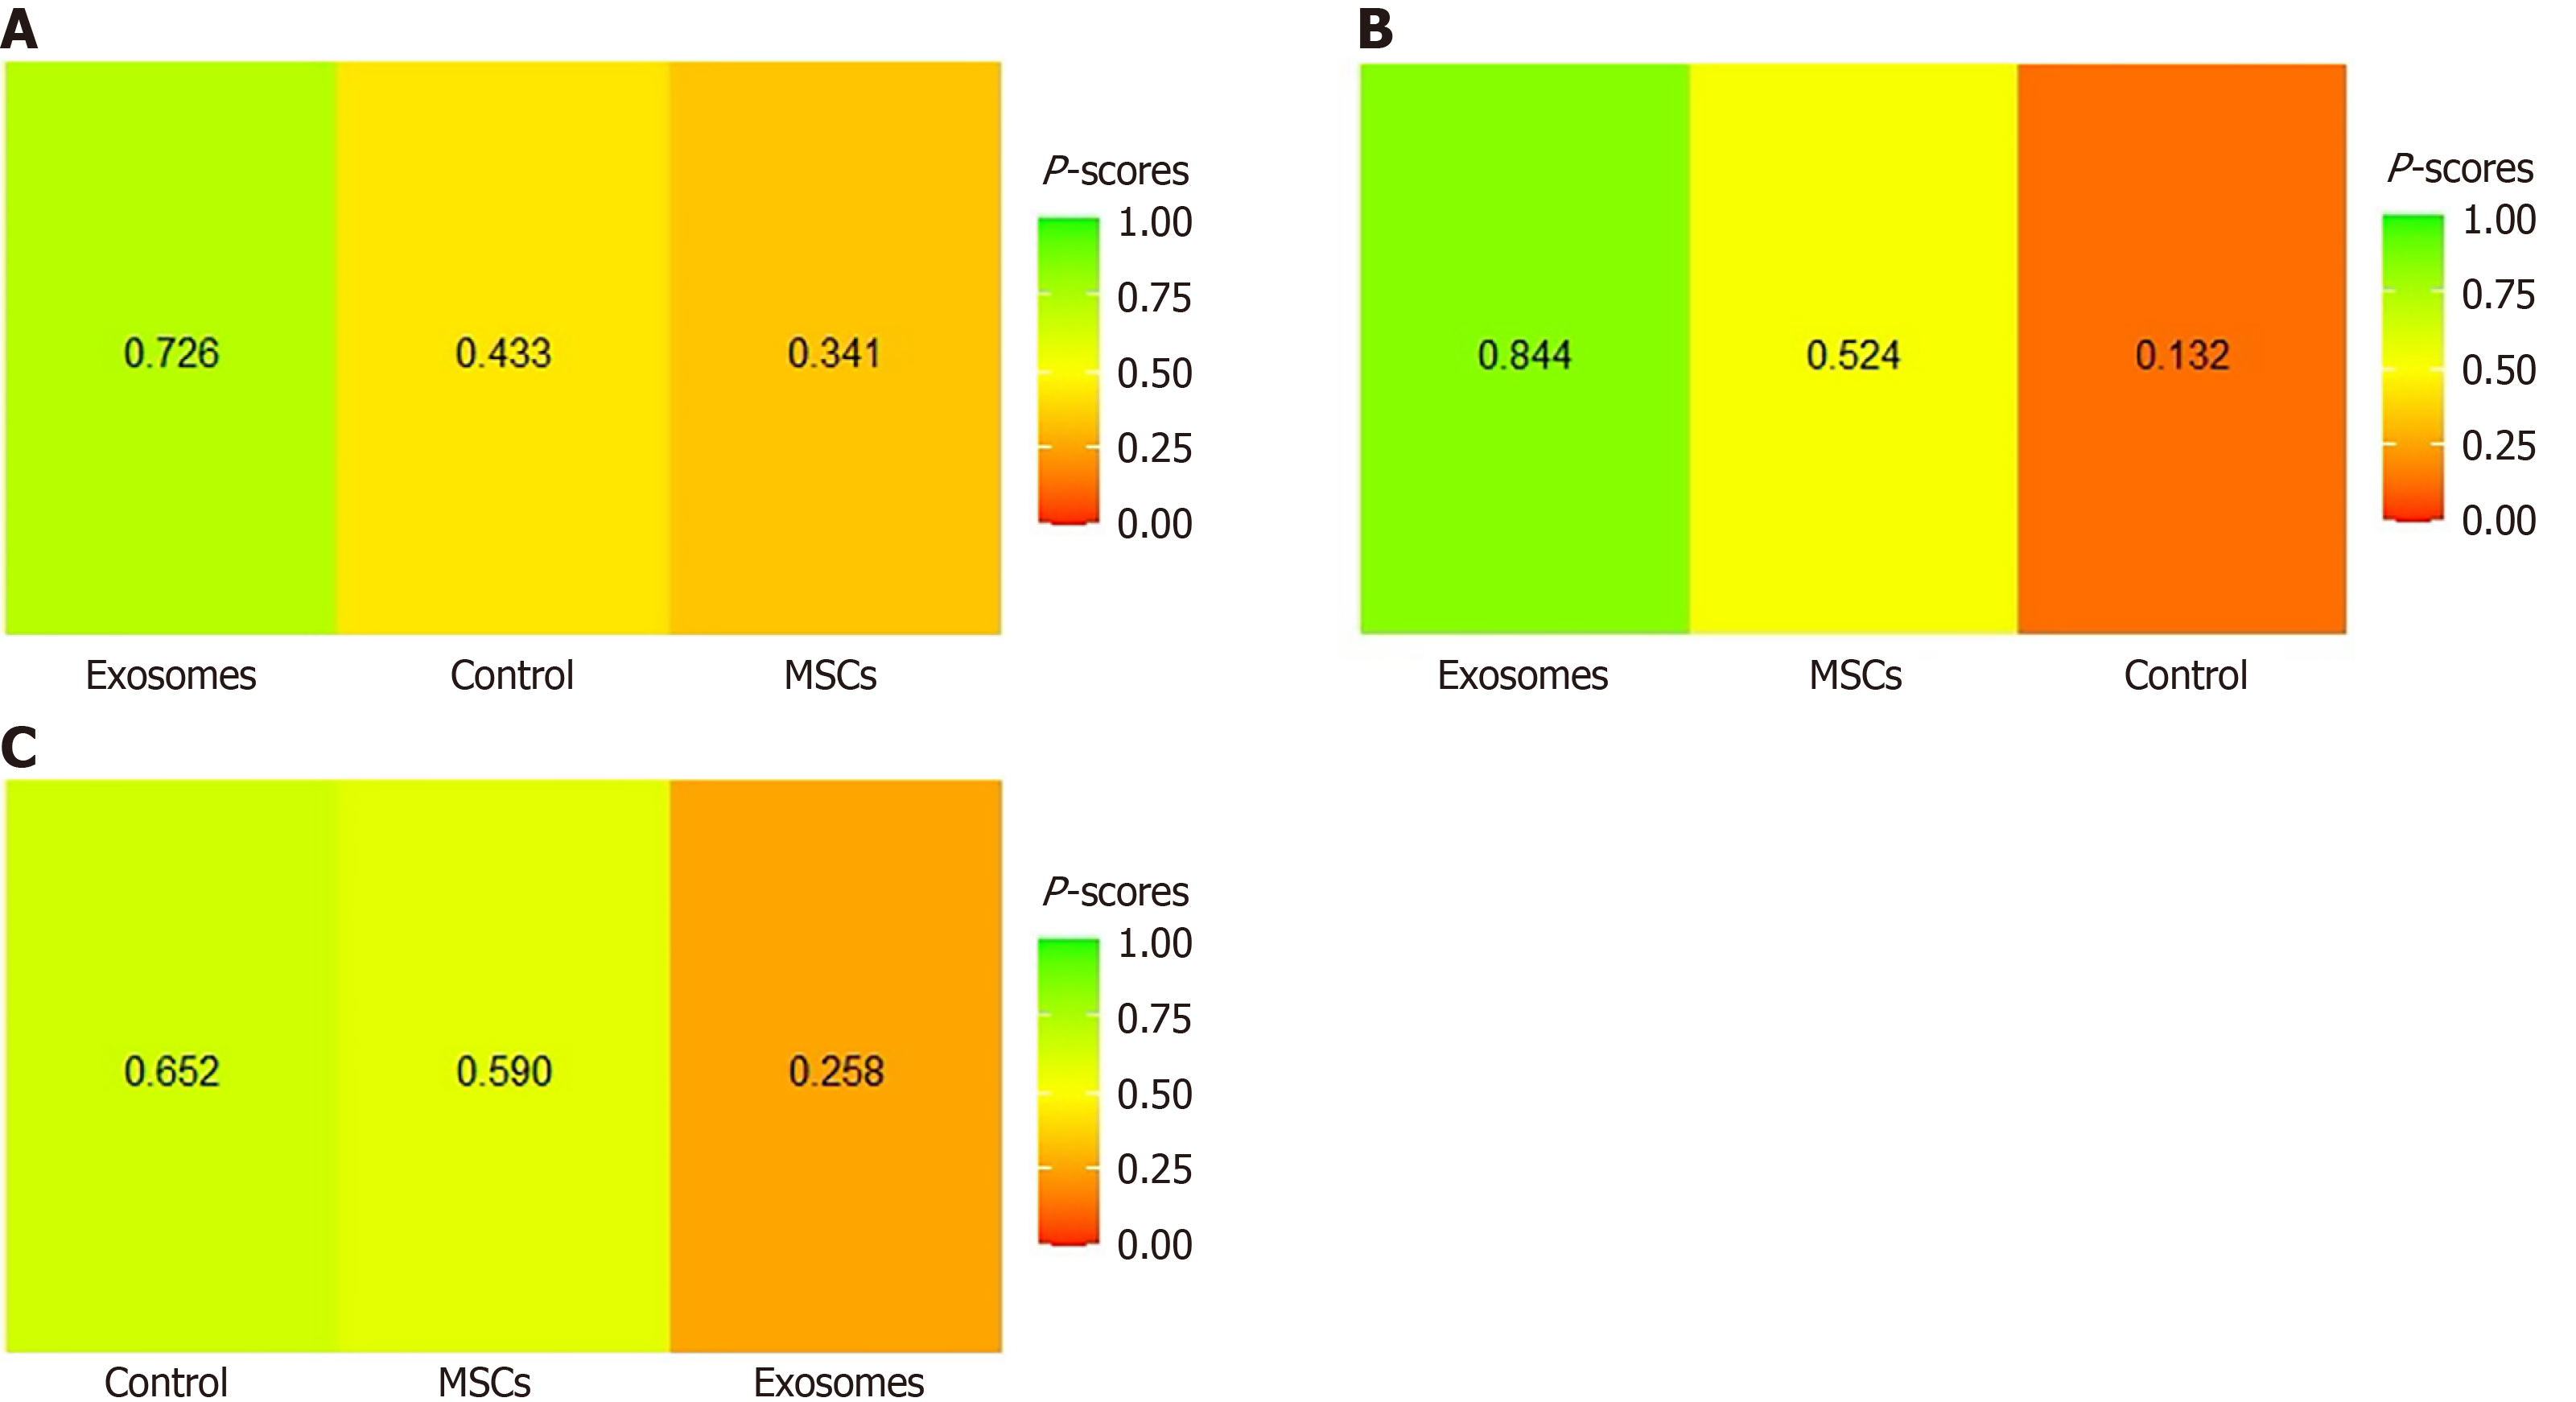
Figure 8 The surface under the cumulative ranking curve probability of the ranking plot for the effect of different treatment arms on mechanical ventilation free days, mortality, and adverse events.
A: The surface under the cumulative ranking curve probability of the ranking plot for the effect of different treatment arms on mechanical ventilation free days; B: The surface under the cumulative ranking curve probability of the ranking plot for the effect of different treatment arms on mortality; C: The surface under the cumulative ranking curve probability of the ranking plot for the effect of different treatment arms on adverse events. MSC: Mesenchymal stem cell.
- Citation: Safwan M, Bourgleh MS, Al-Ruqi A, Shrebaty O, Almujaydil F, AlOthaim B, AlRashidi N, Haider KH. Living bio-drug therapies using mesenchymal stem cells and exosomes for mechanically ventilated patients with acute respiratory distress syndrome: A systematic review and meta-analysis. World J Stem Cells 2025; 17(10): 111978
- URL: https://www.wjgnet.com/1948-0210/full/v17/i10/111978.htm
- DOI: https://dx.doi.org/10.4252/wjsc.v17.i10.111978


