Copyright
©The Author(s) 2025.
World J Stem Cells. Oct 26, 2025; 17(10): 109369
Published online Oct 26, 2025. doi: 10.4252/wjsc.v17.i10.109369
Published online Oct 26, 2025. doi: 10.4252/wjsc.v17.i10.109369
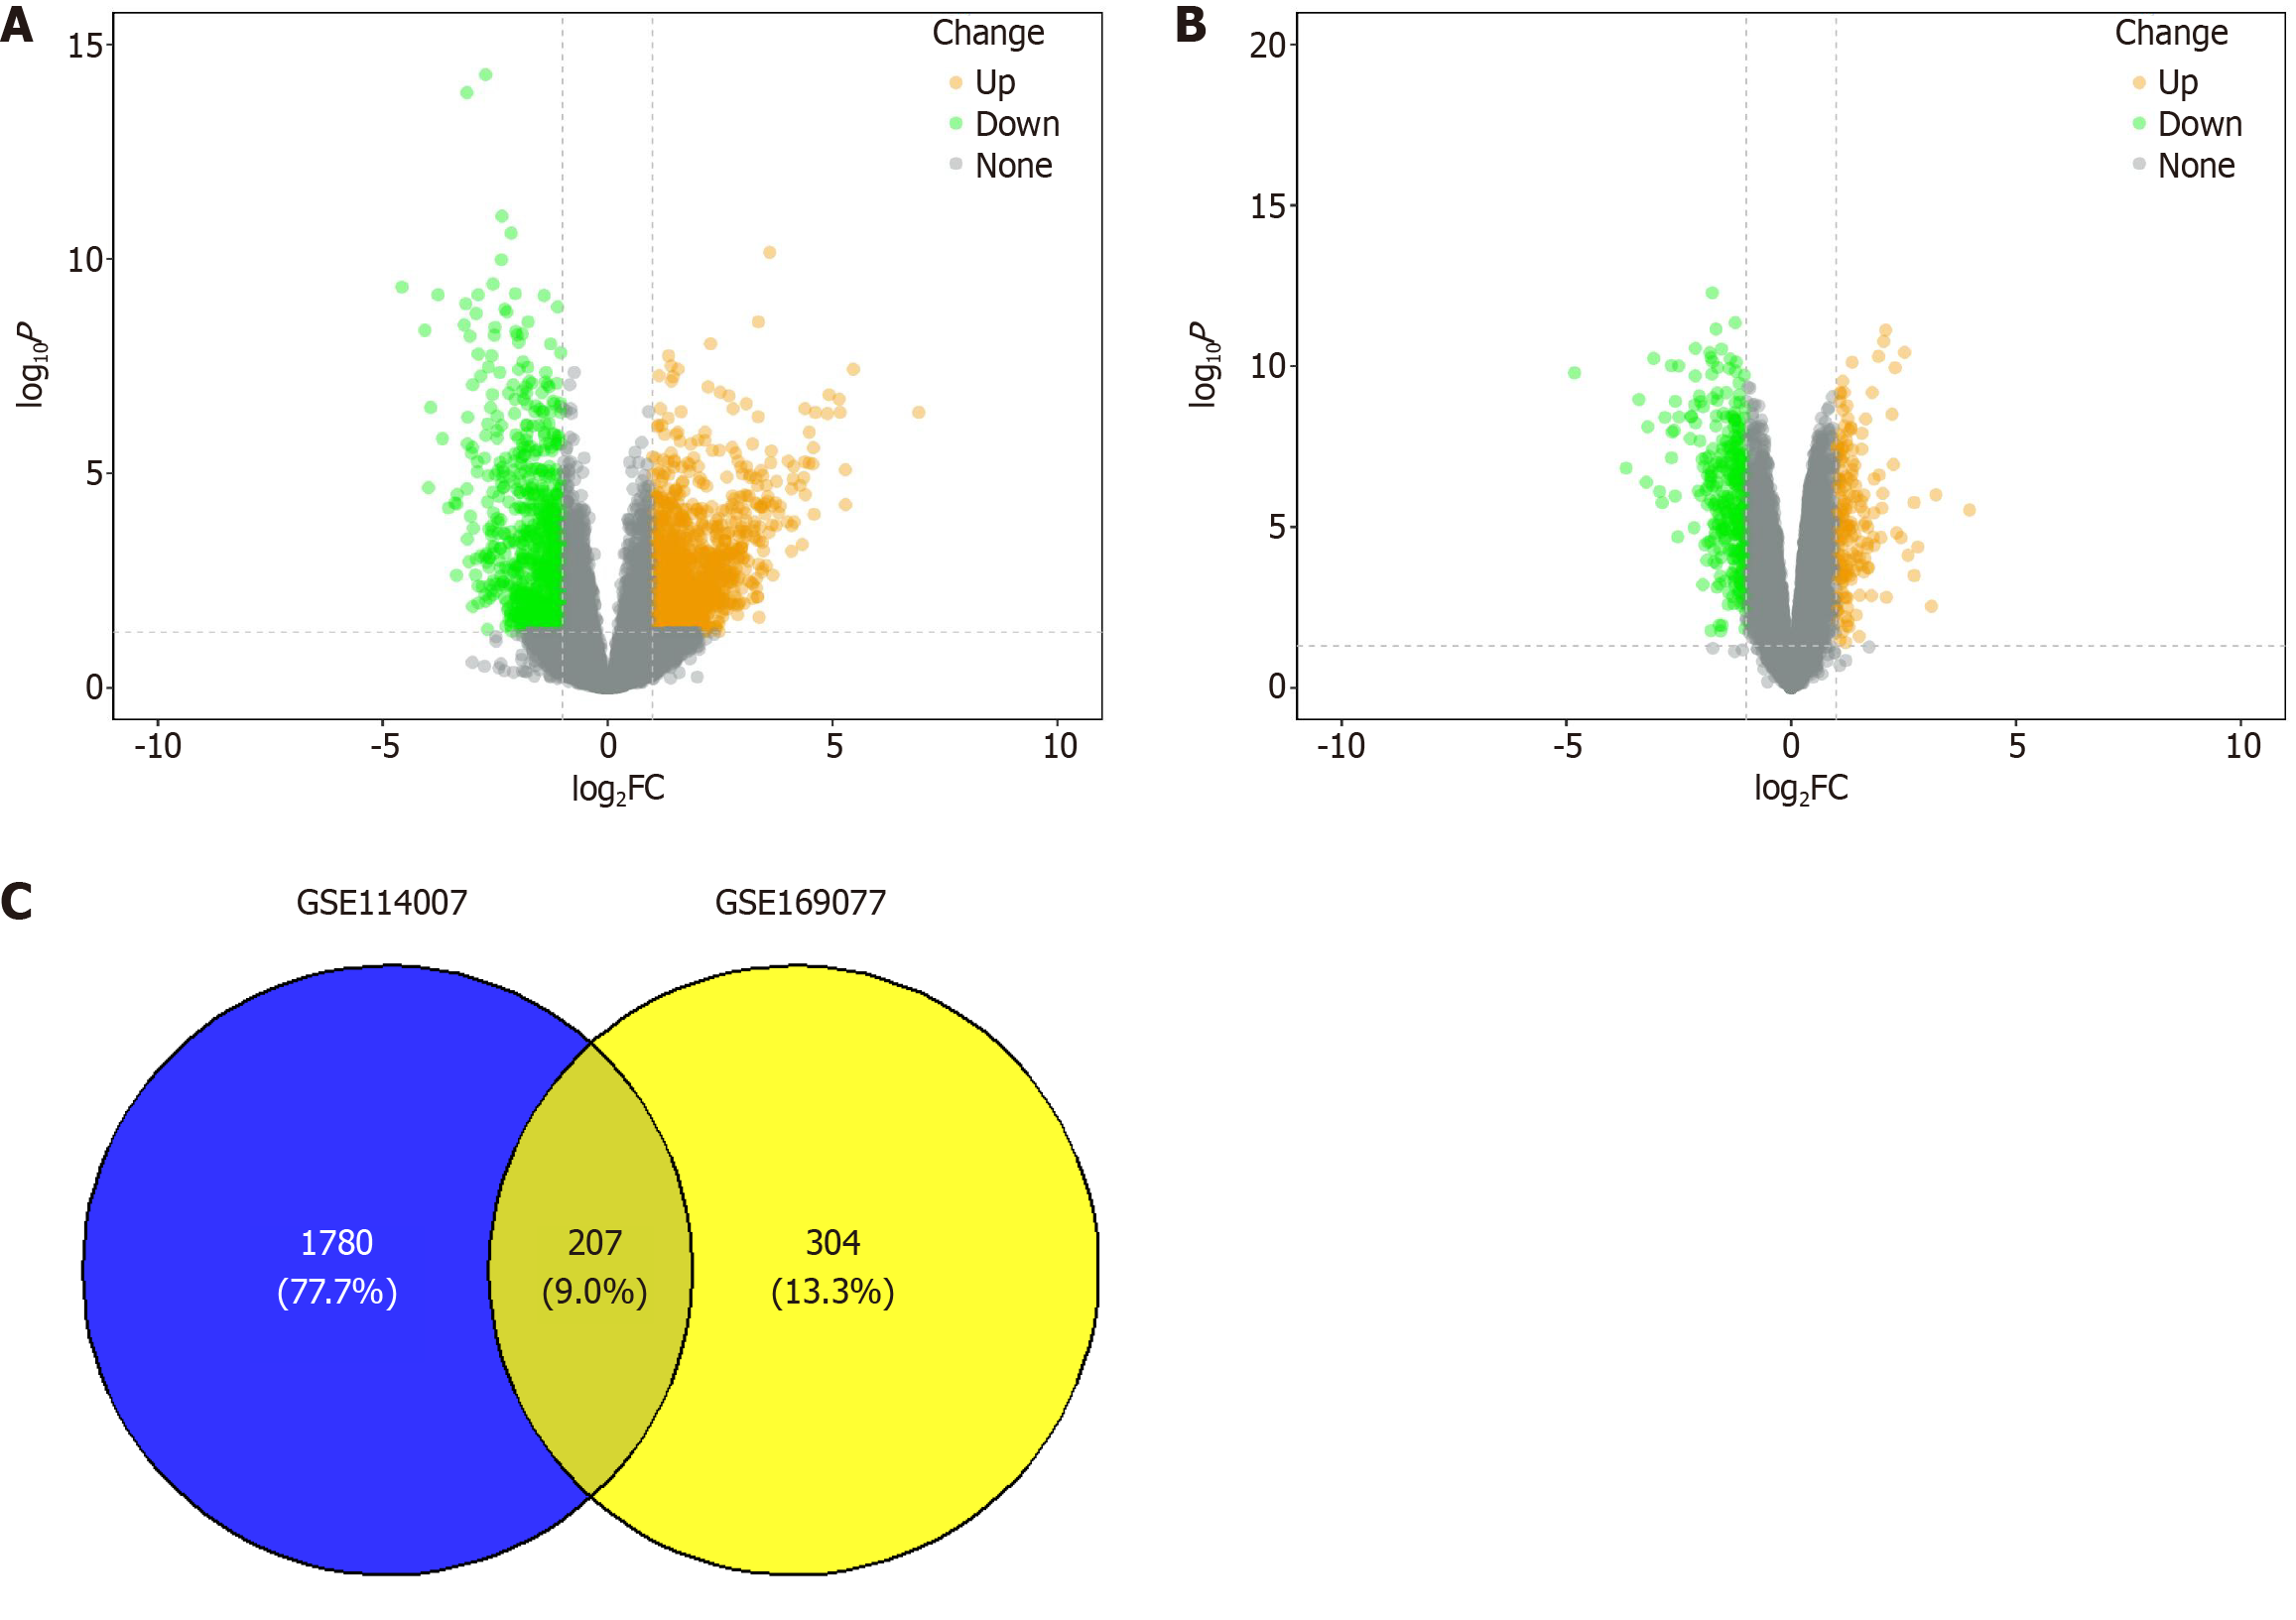
Figure 1 Identification of differentially expressed genes in osteoarthritis cartilage tissue.
A: Volcano plot illustrating differentially expressed genes (DEGs) from the GSE169077 dataset, highlighting the significance and fold change of gene expression; B: Volcano plot depicting DEGs from the GSE114007 dataset, providing a visual summary of the statistical significance and magnitude of changes in gene expression; C: Venn diagram showing the intersection of DEGs identified in both the GSE169077 and GSE114007 datasets, indicating the common genes that are differentially expressed across the two studies. FC: Fold change.
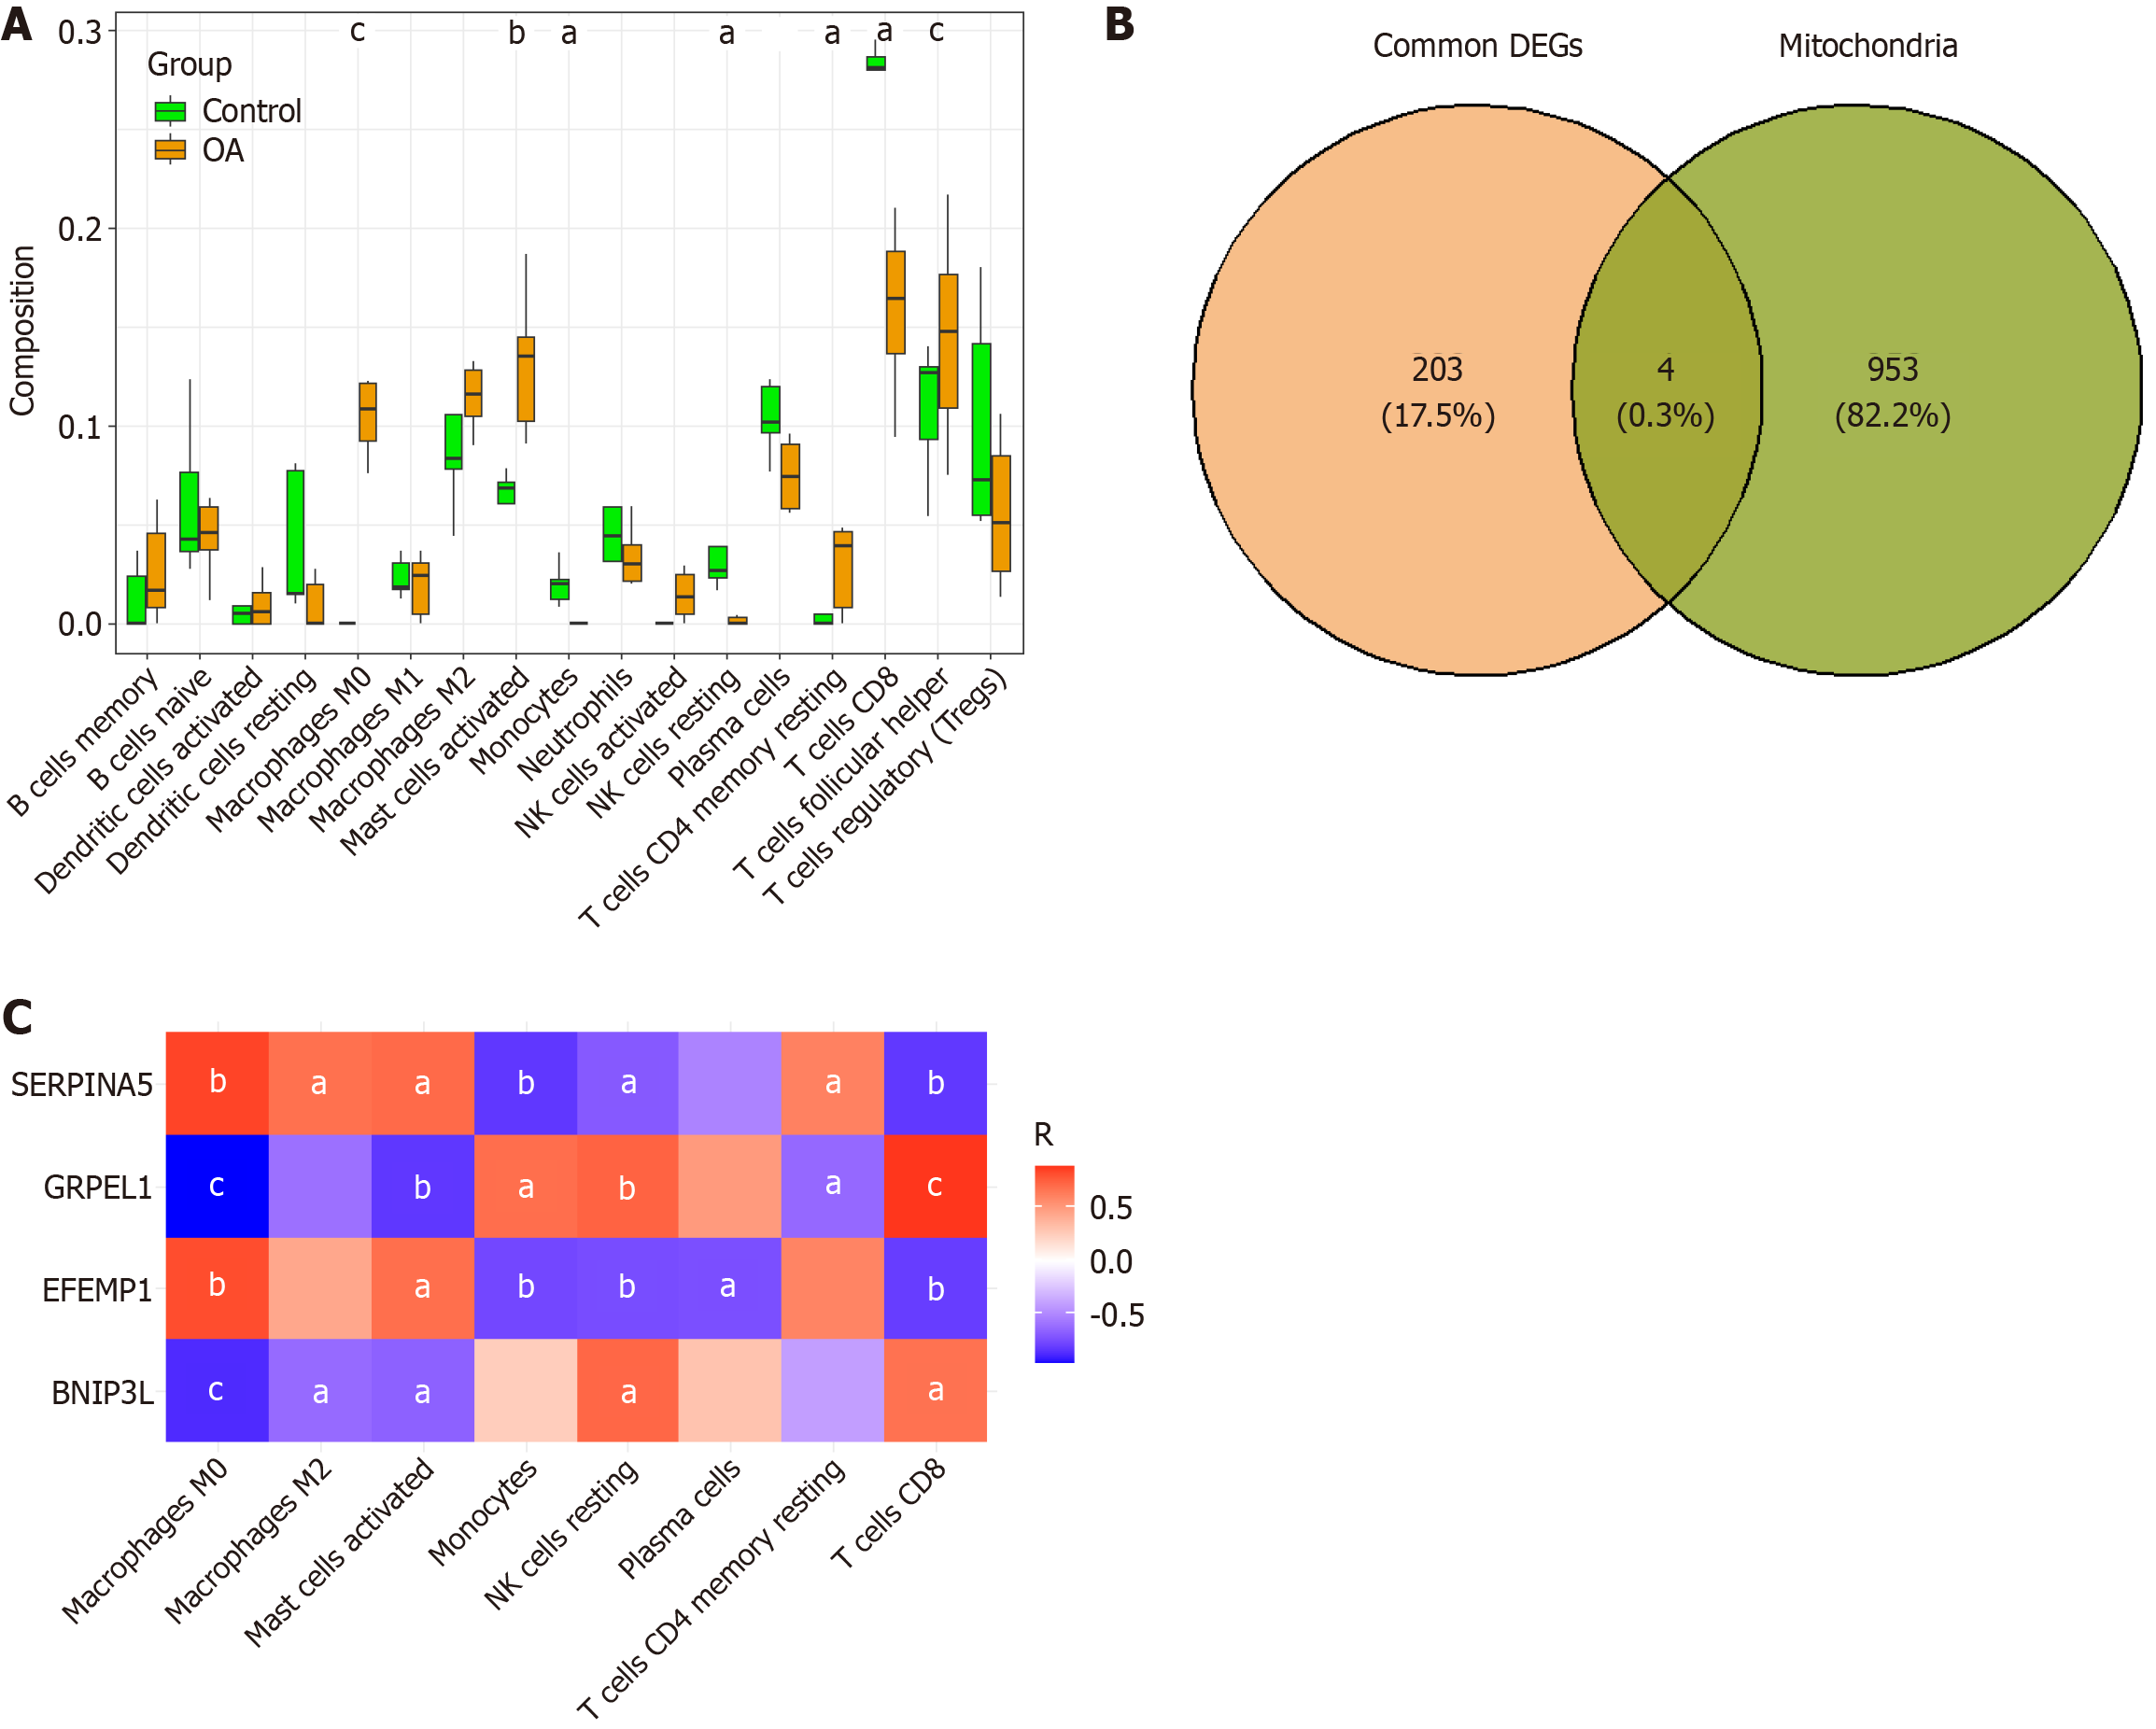
Figure 2 Immune infiltration analysis and identification of mitochondria-related differentially expressed gene.
A: Correlation between gene expression levels and 22 types of immune cells in the GSE169077 dataset; B: Venn diagram showing the overlap between shared differentially expressed genes (DEGs) and mitochondrial gene sets; C: Correlation analysis between mitochondria-related overlapping DEGs and significantly altered immune cell populations. aP < 0.05; bP < 0.01; cP < 0.001. OA: Osteoarthritis; DEGs: Differentially expressed genes; SERPINA5: Serine protease inhibitor 5; GRPEL1: GrpE-like 1; EFEMP1: Epidermal growth factor-containing fibulin extracellular matrix protein 1; BNIP3 L: Bcl2 interacting protein 3 Like; NK: Natural killer.
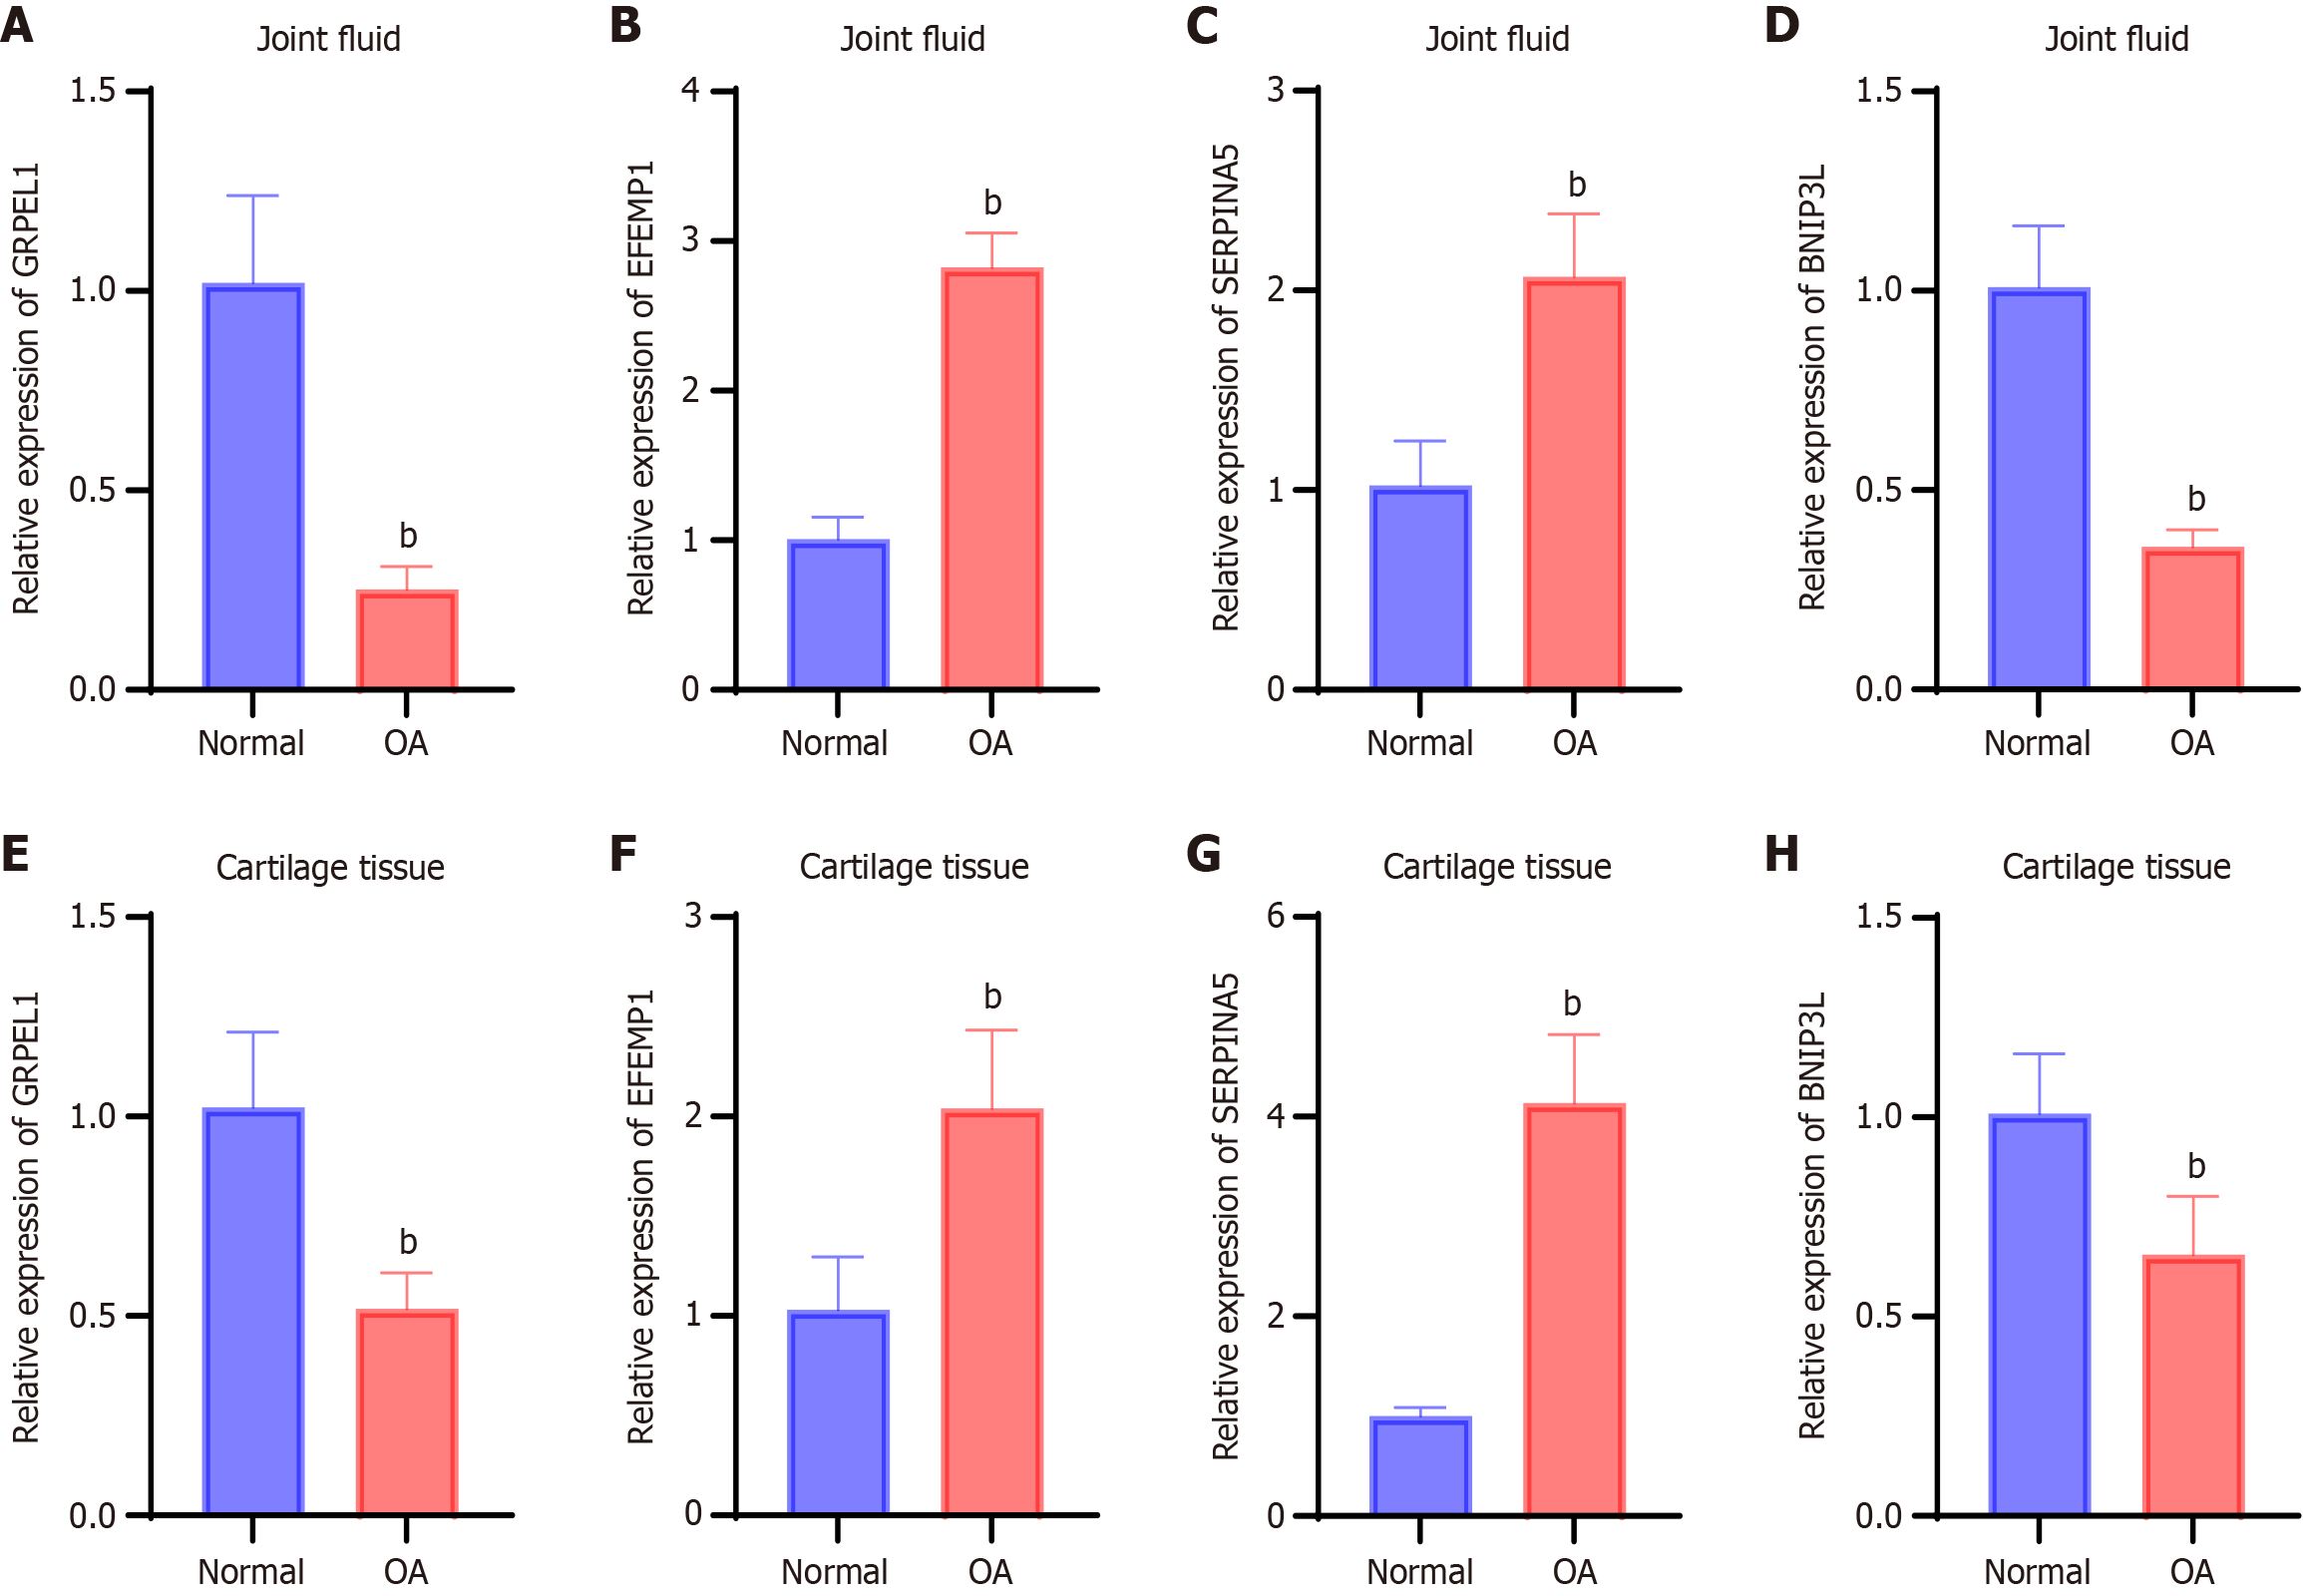
Figure 3 Expression levels of key genes in synovial fluid and cartilage tissue from osteoarthritis patients.
A-D: Expression levels of GrpE-like 1 (A), epidermal growth factor-containing fibulin extracellular matrix protein 1 (B), serine protease inhibitor 5 (C), and Bcl2 interacting protein 3 Like (D) in synovial fluid from the normal and osteoarthritis groups, measured by quantitative real-time polymerase chain reaction; E-H: Expression levels of GrpE-like 1 (E), epidermal growth factor-containing fibulin extracellular matrix protein 1 (F), serine protease inhibitor 5 (G), and Bcl2 interacting protein 3 Like (H) in cartilage tissue from the normal and osteoarthritis groups, measured by quantitative real-time polymerase chain reaction. bP < 0.01. OA: Osteoarthritis; GRPEL1: GrpE-like 1; EFEMP1: Epidermal growth factor-containing fibulin extracellular matrix protein 1; SERPINA5: Serine protease inhibitor 5; BNIP3 L: Bcl2 interacting protein 3 like.
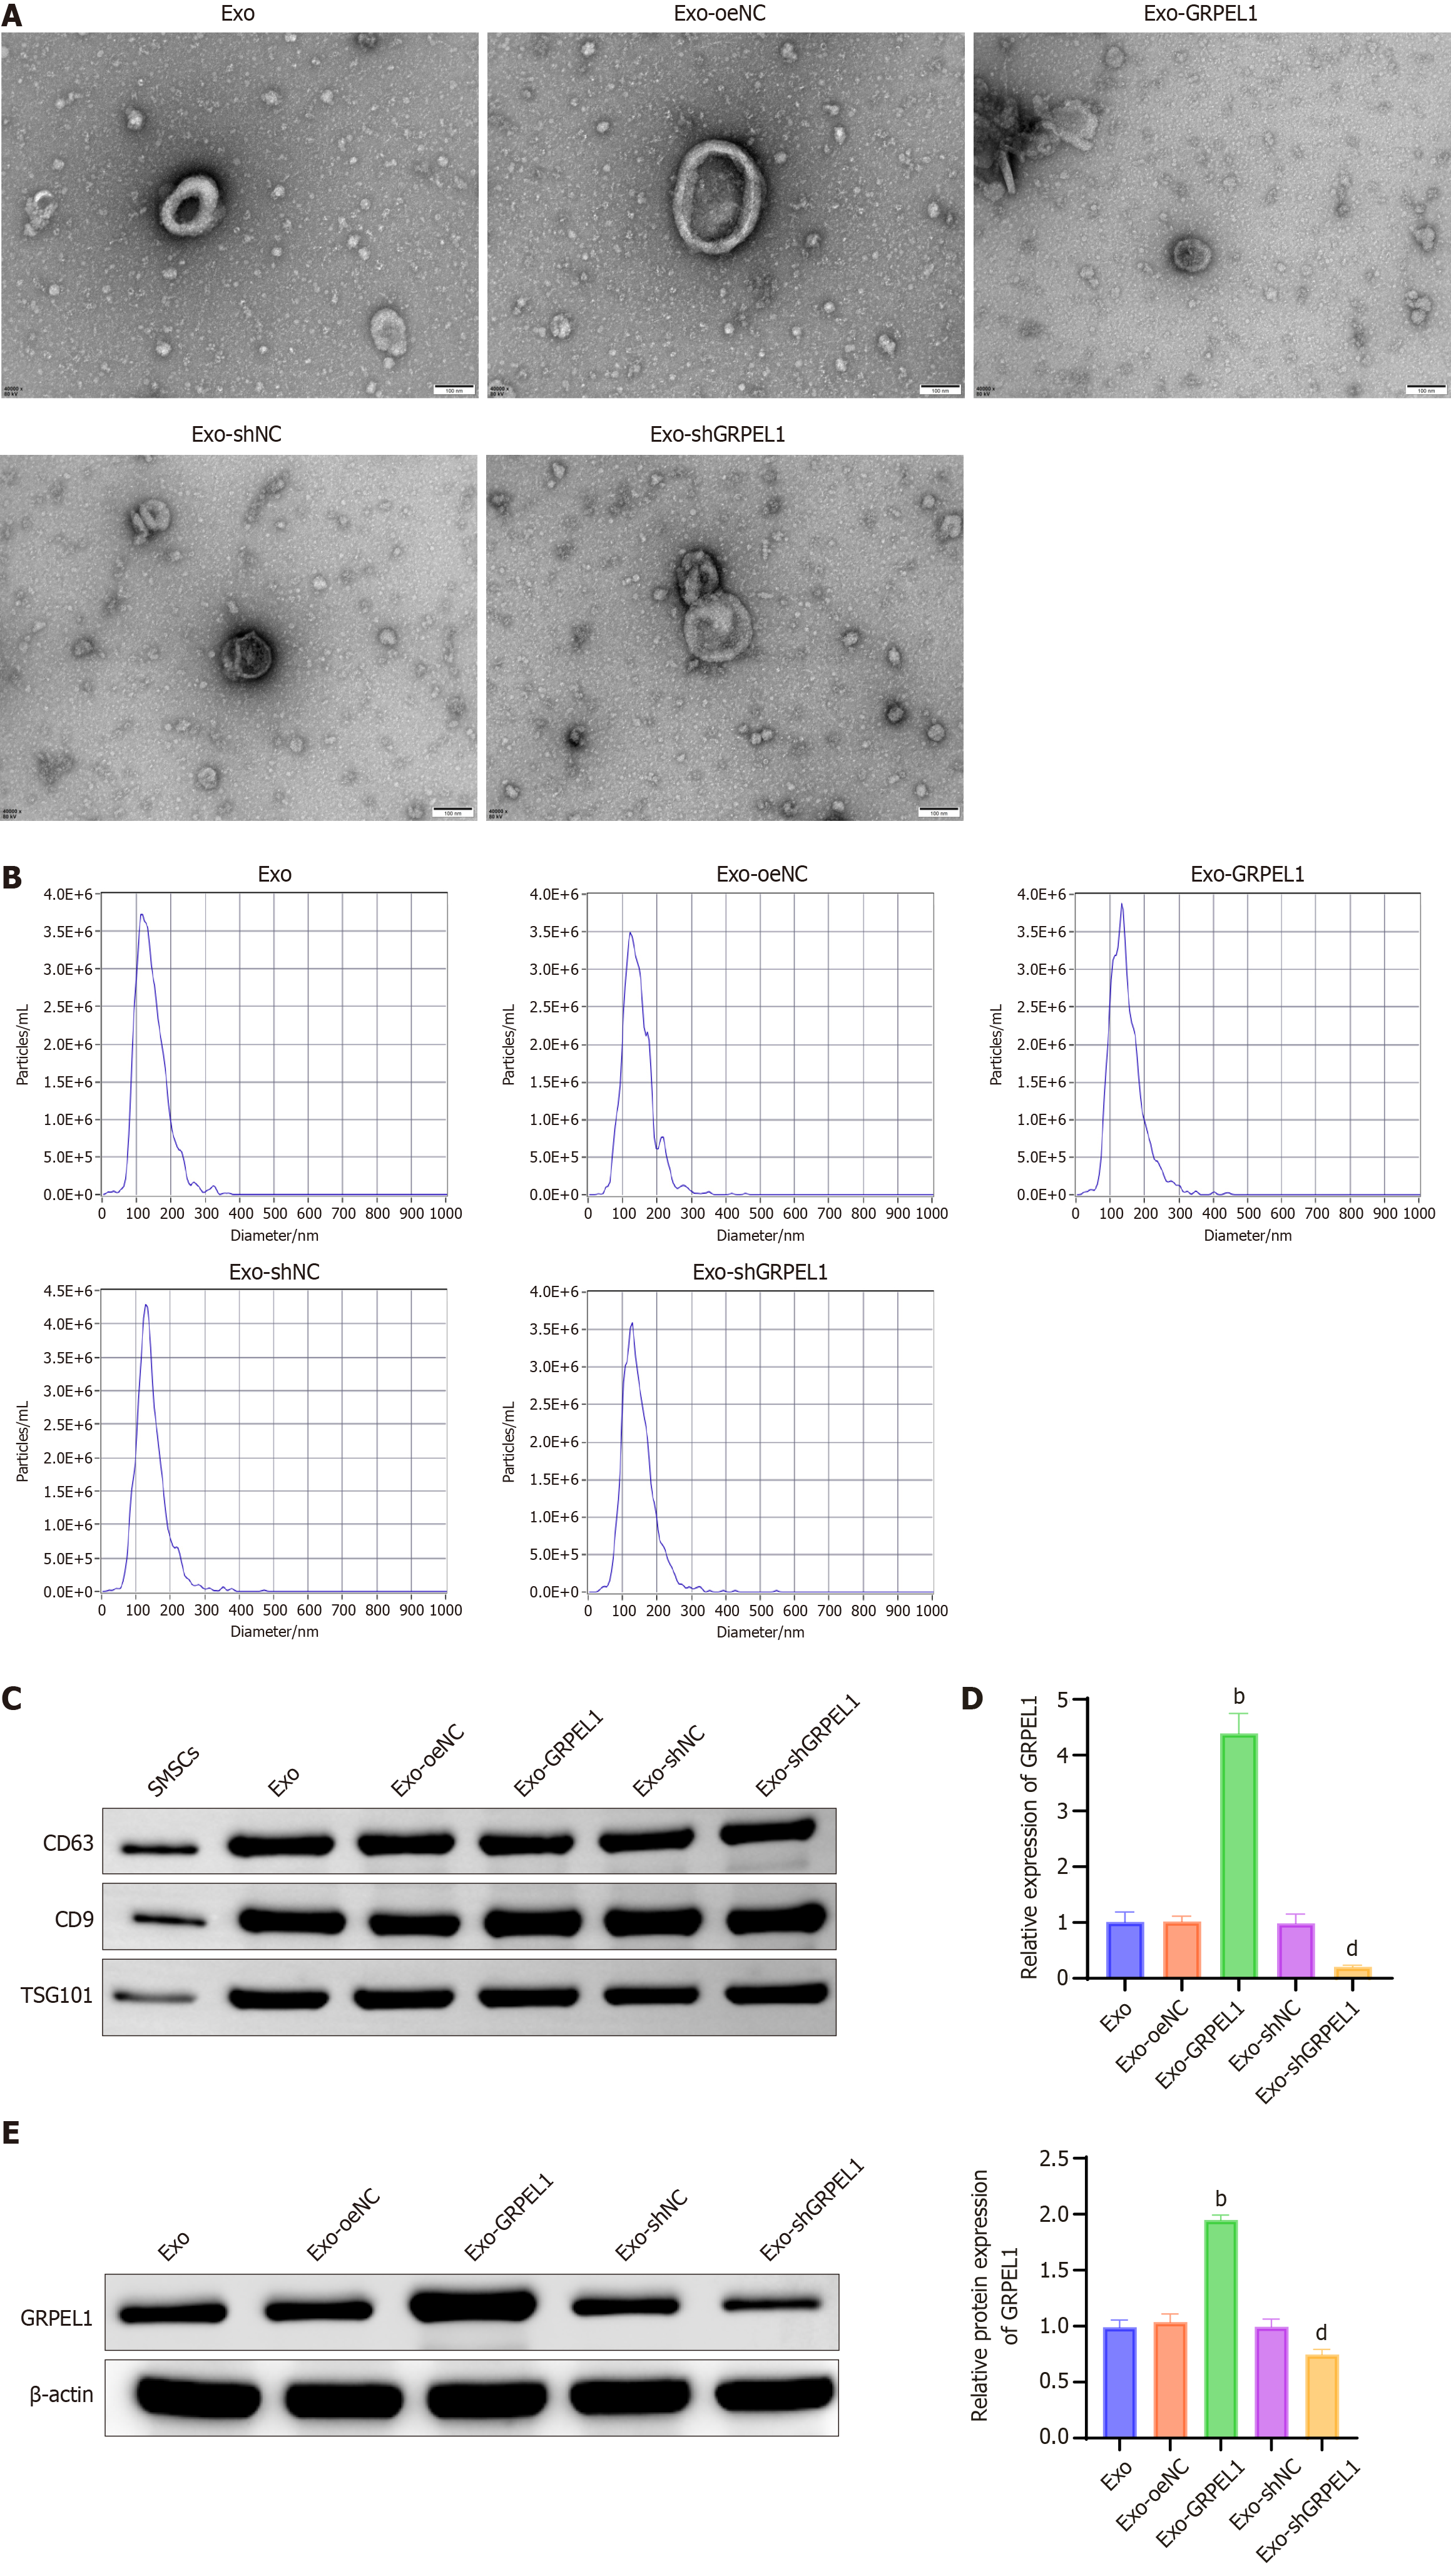
Figure 4 GrpE-like 1 was upregulated in human synovial mesenchymal stem cells-derived exosomes.
A: Transmission electron microscopy with uranyl acetate negative staining reveals the morphological characteristics of exosomes (Exos) across different groups, displaying their typical cup-shaped or spherical structure; B: Nanoparticle tracking analysis using a nanoparticle tracking analyzer and dedicated software precisely determines the diameter distribution of Exos in each experimental condition, providing insights into their size homogeneity; C: Western blot analysis confirms Exo identity by demonstrating the protein levels of canonical exosomal markers CD63, CD9, and tumor susceptibility gene 101 across the different experimental groups, validating Exo purity and integrity; D: Quantitative real-time polymerase chain reaction analysis of GrpE-like 1 mRNA expression levels in Exos from each experimental group, revealing potential genetic cargo variations; E: Western blot evaluation of GrpE-like 1 protein expression in Exos, complementing the mRNA analysis and providing a comprehensive molecular characterization of the exosomal GrpE-like 1 content. bP < 0.01 vs Exo-oeNC; dP < 0.01 vs Exo-siNC. Exo: Exosome; SMSC: Synovial mesenchymal stem cells; TSG101: Tumor susceptibility gene 101; GRPEL1: GrpE-like 1.
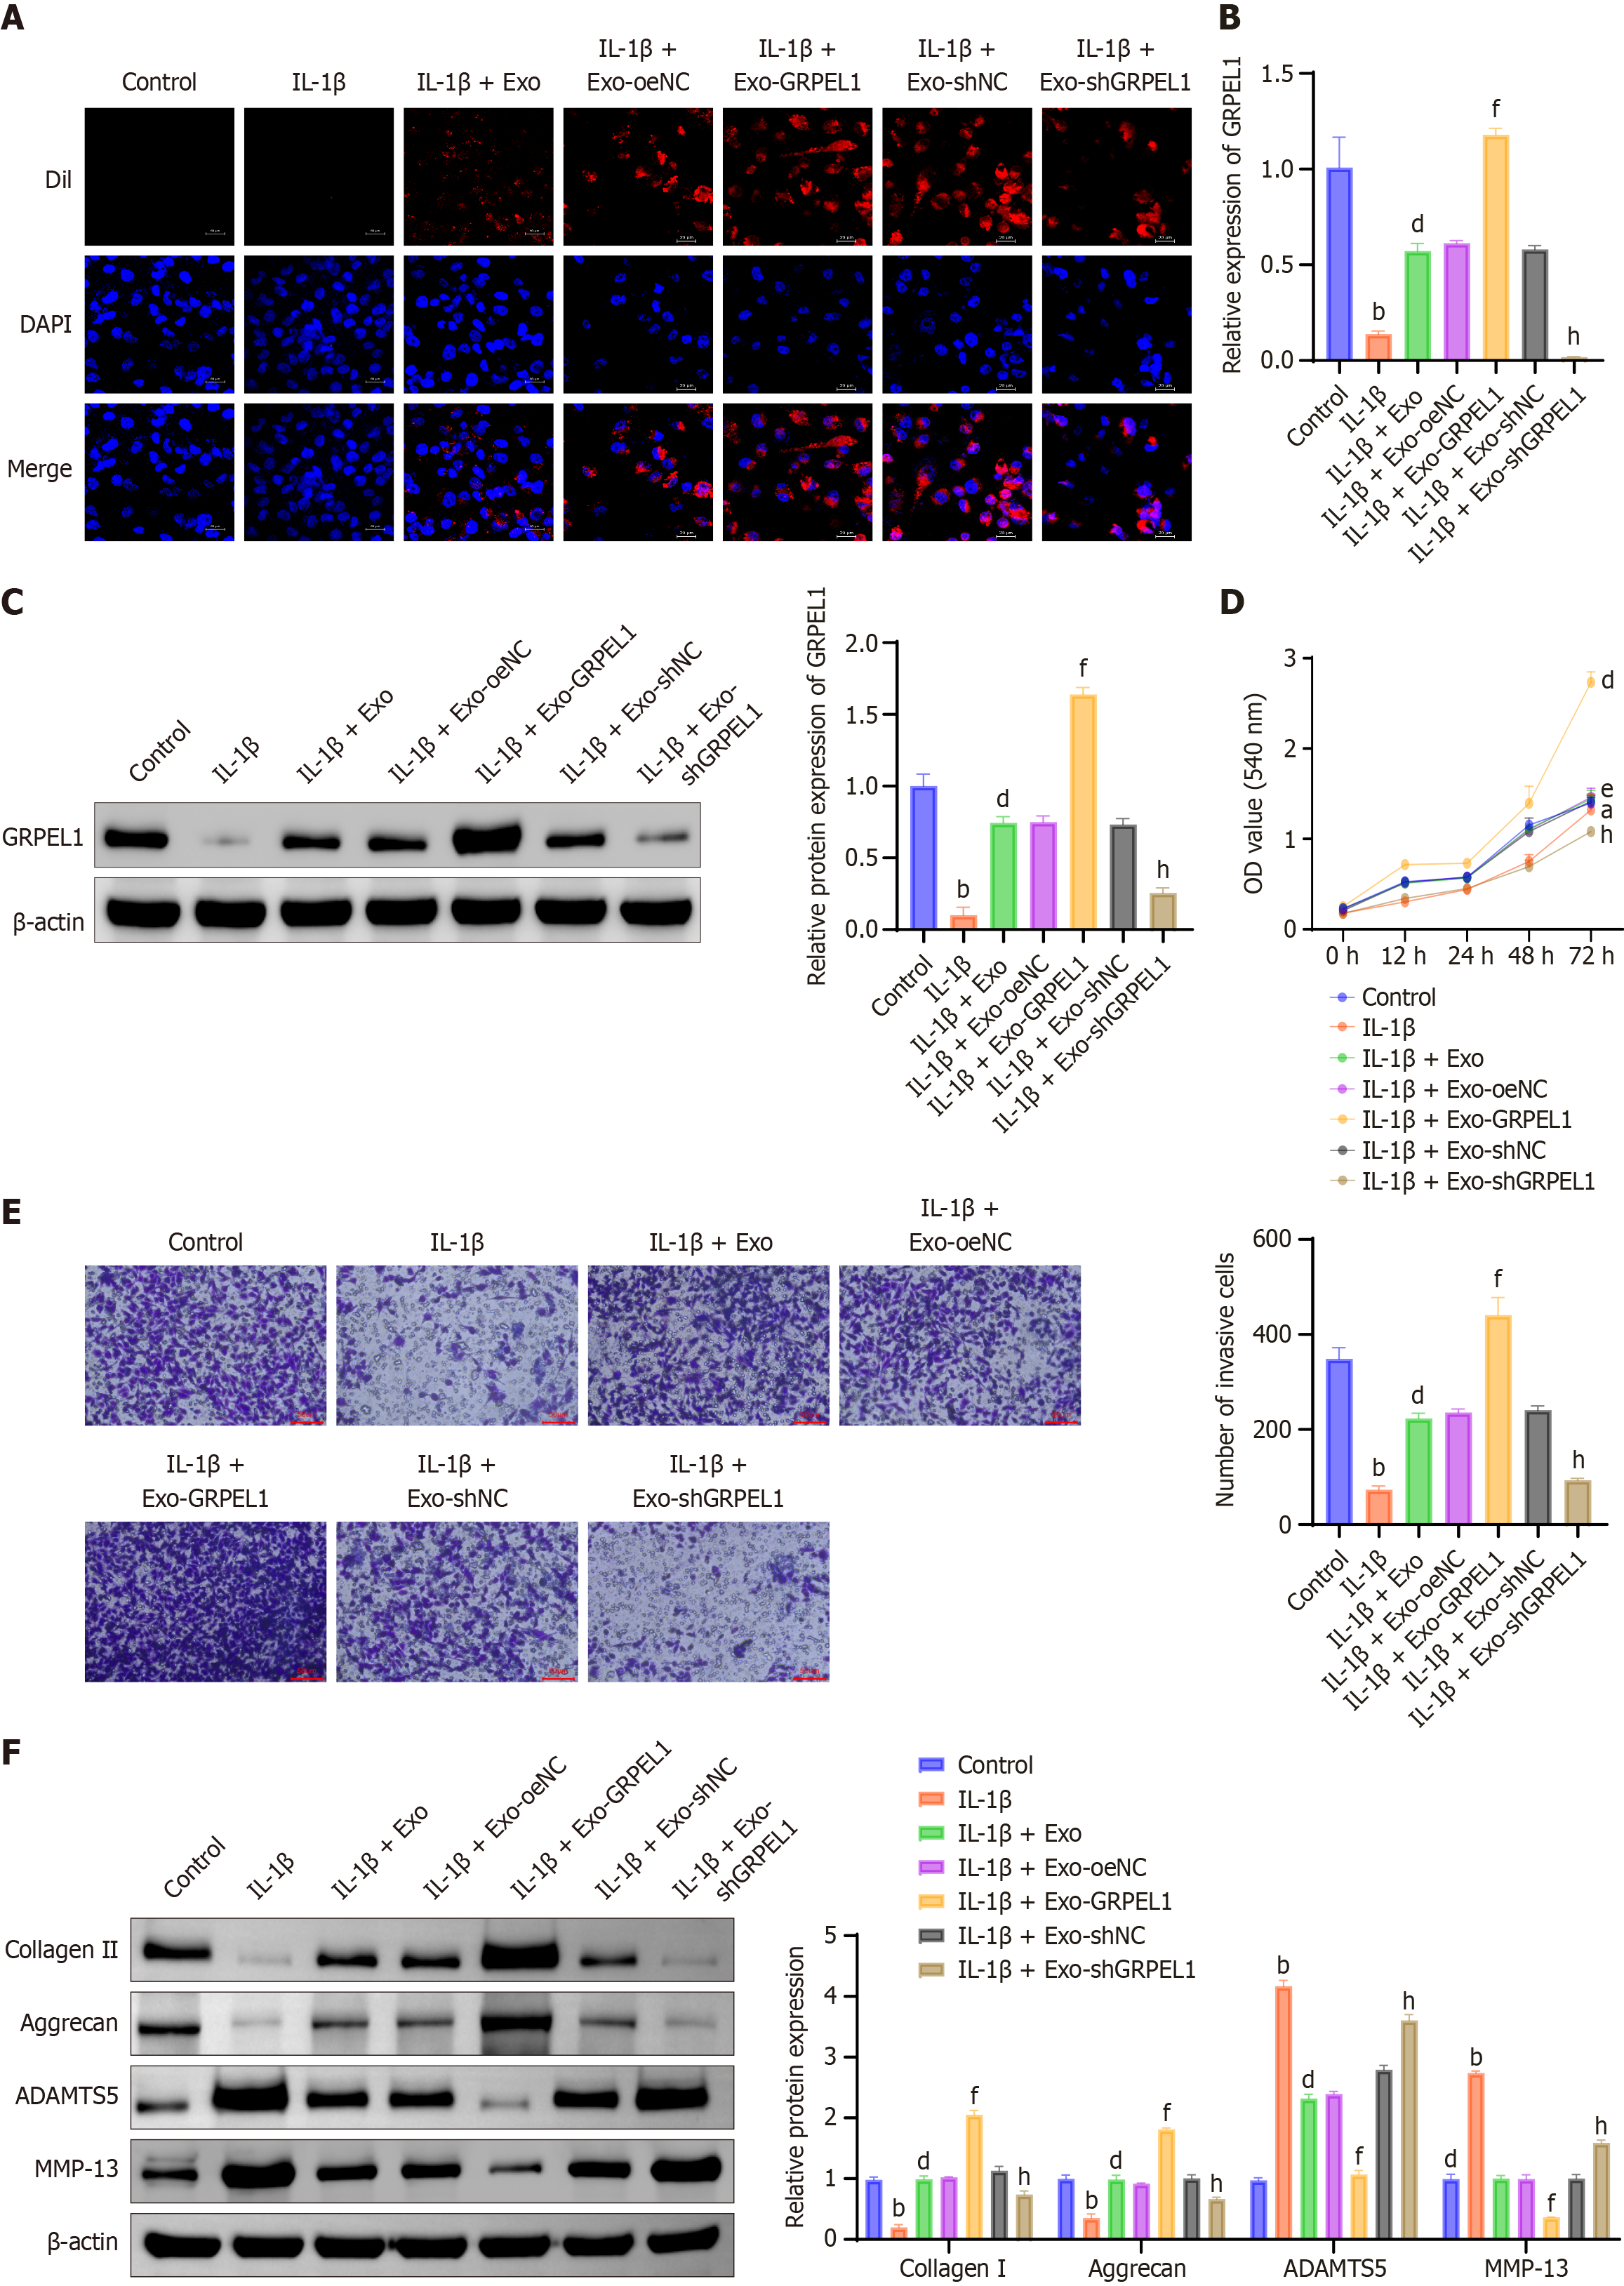
Figure 5 Synovial mesenchymal stem cell-derived exosomes delivery of GrpE-like 1 mitigates interleukin-1 beta-induced changes in CHON-001 cells.
A: Immunofluorescence tracking of Dil-labeled exosomes demonstrates cellular internalization and distribution across different experimental conditions, revealing exosomal uptake dynamics; B: Quantitative real-time polymerase chain reaction analysis of GrpE-like 1 (GRPEL1) mRNA expression levels in CHON-001 cells, providing molecular insights into genetic cargo transfer and expression; C: Western blot examination confirms GRPEL1 protein expression, complementing transcriptional analysis and validating exosomal cargo delivery; D: CCK-8 assay evaluates cellular viability, assessing the protective potential of GRPEL1-delivered exosomes against interleukin-1 beta-induced cellular stress; E: Transwell migration assay investigates cellular migratory capabilities, elucidating potential functional modifications induced by exosomal GRPEL1; F: Western blot analysis of cartilage-associated proteins (collagen II, aggrecan, a disintegrin and metalloproteinase with thrombospondin motifs 5, matrix metalloproteinase-13) reveals molecular changes in chondrocyte phenotype and matrix metabolism. Scale bar: 50 μm. bP < 0.01 vs control; dP < 0.01 vs IL-1β; fP < 0.01 vs IL-1β + Exo-oeNC; hP < 0.01 vs IL-1β + Exo-shNC. IL-1β: Interleukin-1 beta; Exo: Exosome; DAPI: 4’-6-diamidino-2-phenylindole; GRPEL1: GrpE-like 1; OD: Optical density; ADAMTS5: A disintegrin and metalloproteinase with thrombospondin motifs 5; MMP-13: Matrix metalloproteinase-13.
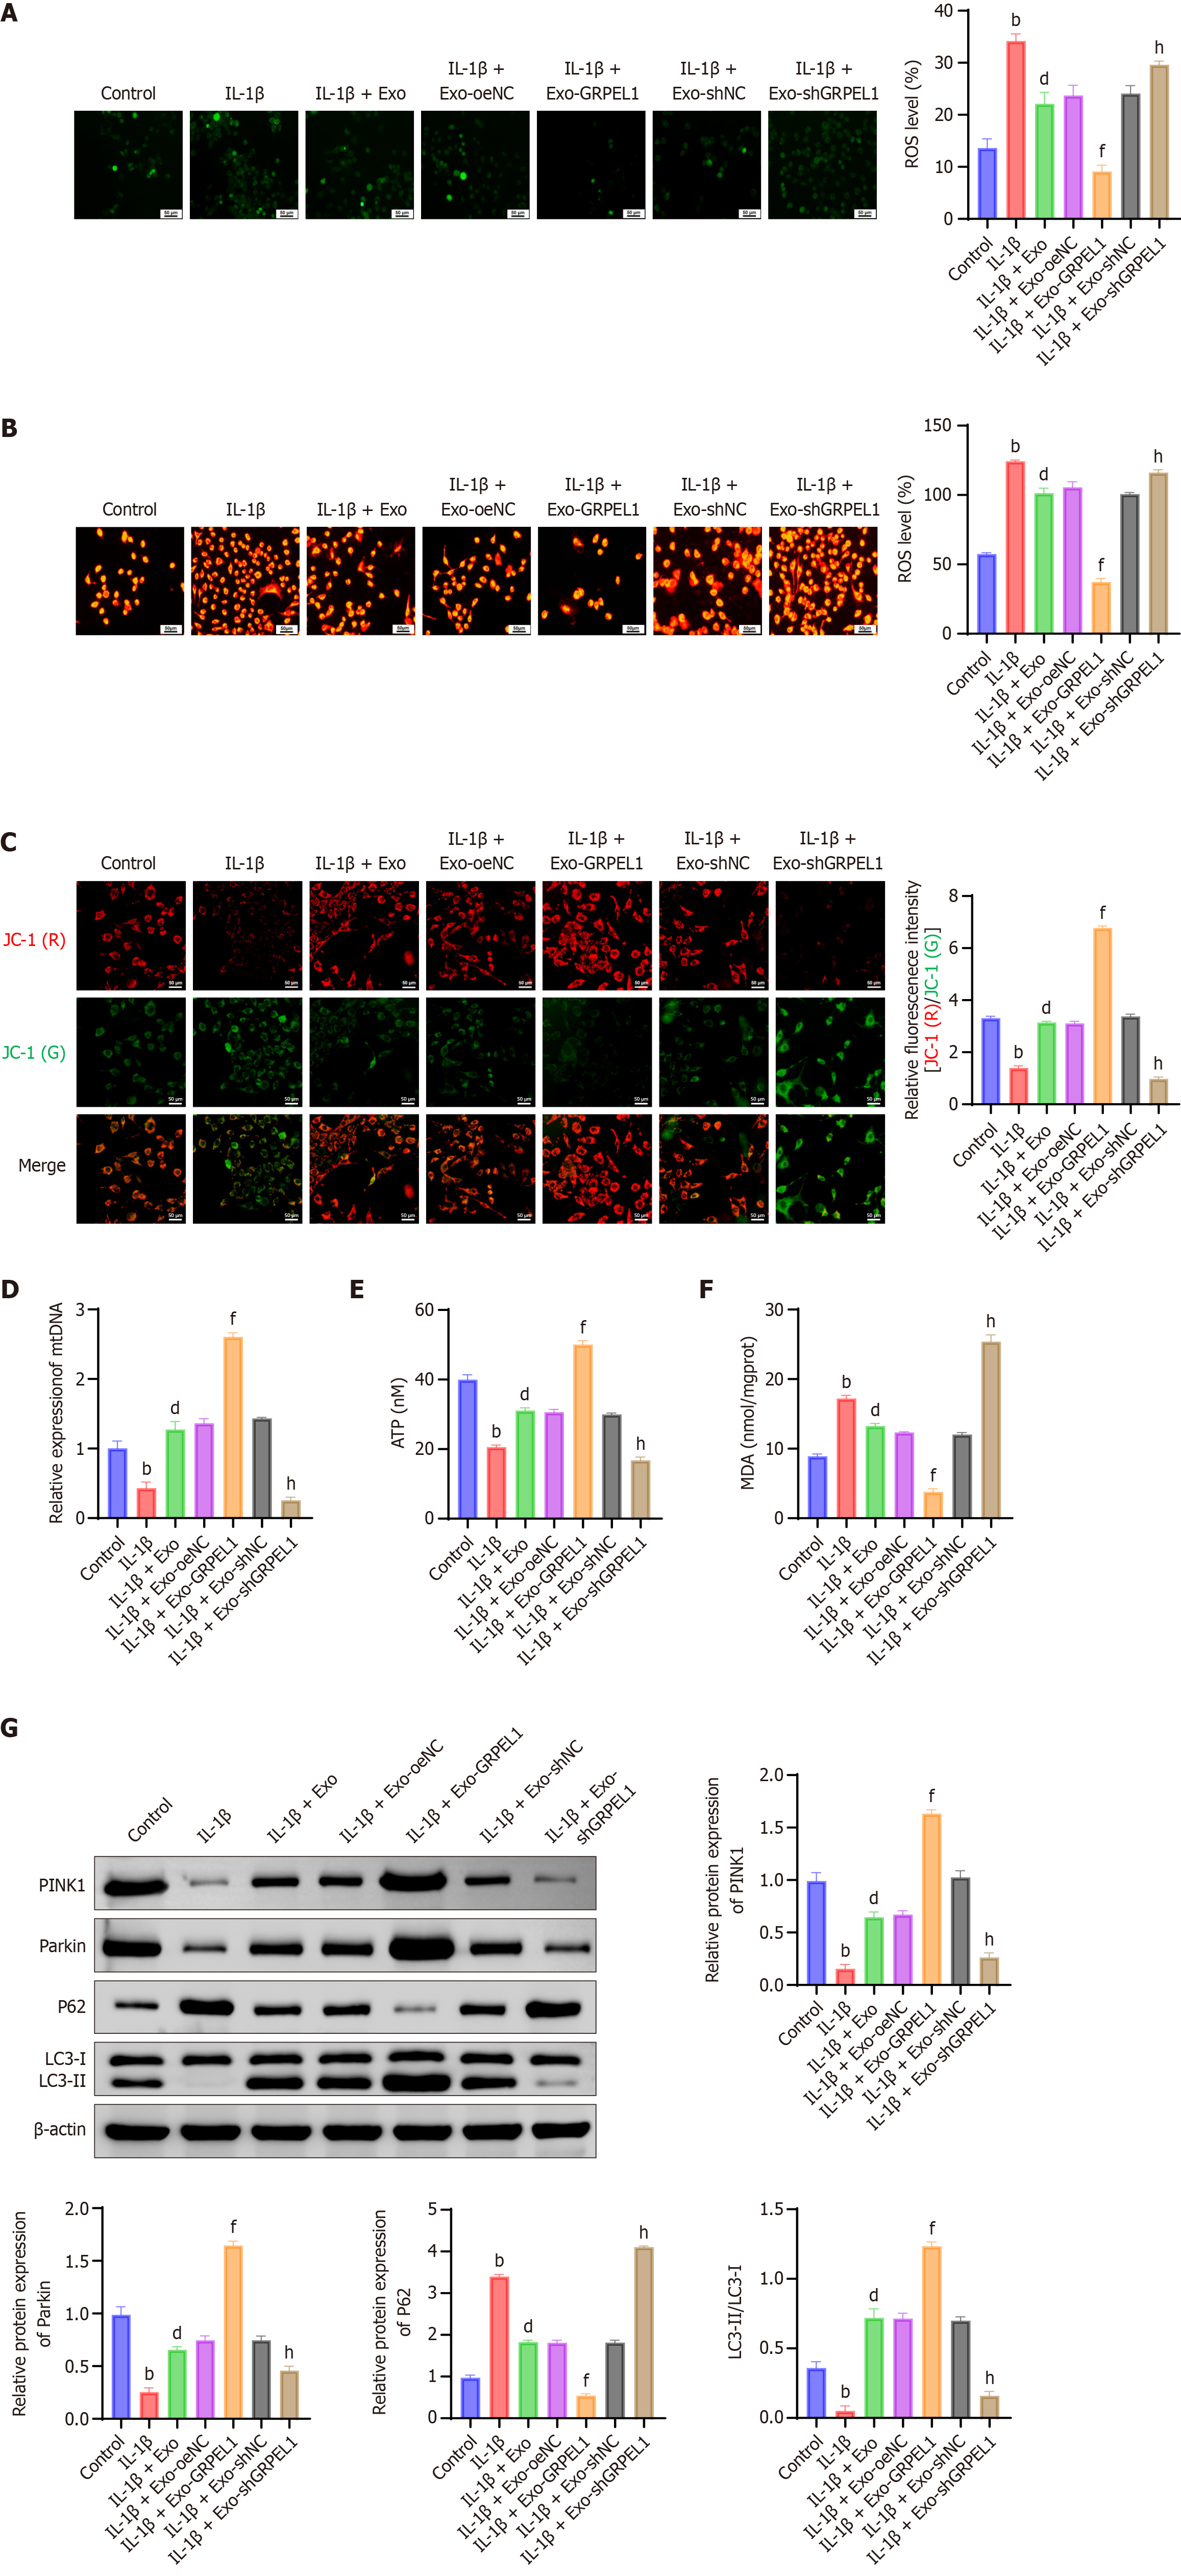
Figure 6 Synovial mesenchymal stem cell-derived exosomes delivery of GrpE-like 1 mitigates mitochondrial dysfunction in interleukin-1 beta-induced CHON-001 cells.
A: Total reactive oxygen species (ROS) levels measured by commercial assay kit, indicating cellular oxidative stress. Intracellular ROS levels indicated by green fluorescence, reflecting oxidative stress levels; B: Mitochondrial ROS quantification, revealing specific mitochondrial oxidative damage; C: Mitochondrial membrane potential (JC-1 assay) assessment, evaluating mitochondrial membrane integrity and functional status. JC-1 exists as a monomer emitting green fluorescence [JC-1 (green)] when the mitochondrial membrane potential (ψm) is low, and forms aggregates emitting red fluorescence [JC-1 (red)] when ψm is high; D: Mitochondrial DNA quantification was performed using a commercial mitochondrial DNA isolation kit (Beyotime, Shanghai, China), followed by quantitative polymerase chain reaction using specific primers targeting mitochondrial genes. Mitochondrial DNA quantification, examining mitochondrial genetic material preservation; E: Cellular ATP levels were measured using the Enhanced ATP assay Kit (Beyotime, Shanghai, China), based on the luciferase-luciferin bioluminescence method, according to the manufacturer’s instructions. Cellular ATP level measurement, indicating mitochondrial energy production capacity; F: Malondialdehyde (MDA) levels were detected using a lipid peroxidation MDA assay kit (Beyotime, Shanghai, China), based on the thiobarbituric acid method, following the manufacturer’s protocol. MDA levels, reflecting lipid peroxidation and oxidative stress intensity; G: Western blot analysis of mitophagy-related proteins (phosphatase and tensin homolog-induced putative kinase 1, parkin, P62, light chain 3 II/I), demonstrating mitochondrial quality control mechanisms and autophagic flux. Flow cytometry gating strategy: After 2’,7’-dichlorodihydrofluorescein diacetate or MitoSOX staining, cells were first gated using forward scatter (FSC) vs side scatter to exclude debris. Subsequently, singlet cells were selected based on FSC-H vs FSC-A. Fluorescence intensity of 2’,7’-dichlorodihydrofluorescein diacetate or MitoSOX was then analyzed in the FITC (for total ROS) or PE (for mitochondrial ROS) channel, respectively, using BD FACSCelesta (Becton Dickinson, NJ, United States). A minimum of 10000 events per sample were collected. Scale bar: 50 μm. bP < 0.01 vs control; dP < 0.01 vs IL-1β; fP < 0.01 vs IL-1β + Exo-oeNC; hP < 0.01 vs IL-1β + Exo-shNC. IL-1β: Interleukin-1 beta; Exo: Exosome; GRPEL1: GrpE-like 1; mtDNA: Mitochondrial DNA; ROS: Reactive oxygen species; ATP: Adenosine triphosphate; MDA: Malondialdehyde; PINK1: Phosphatase and tensin homolog-induced putative kinase 1; LC3-II/LC3-I: Light chain 3 II/I.
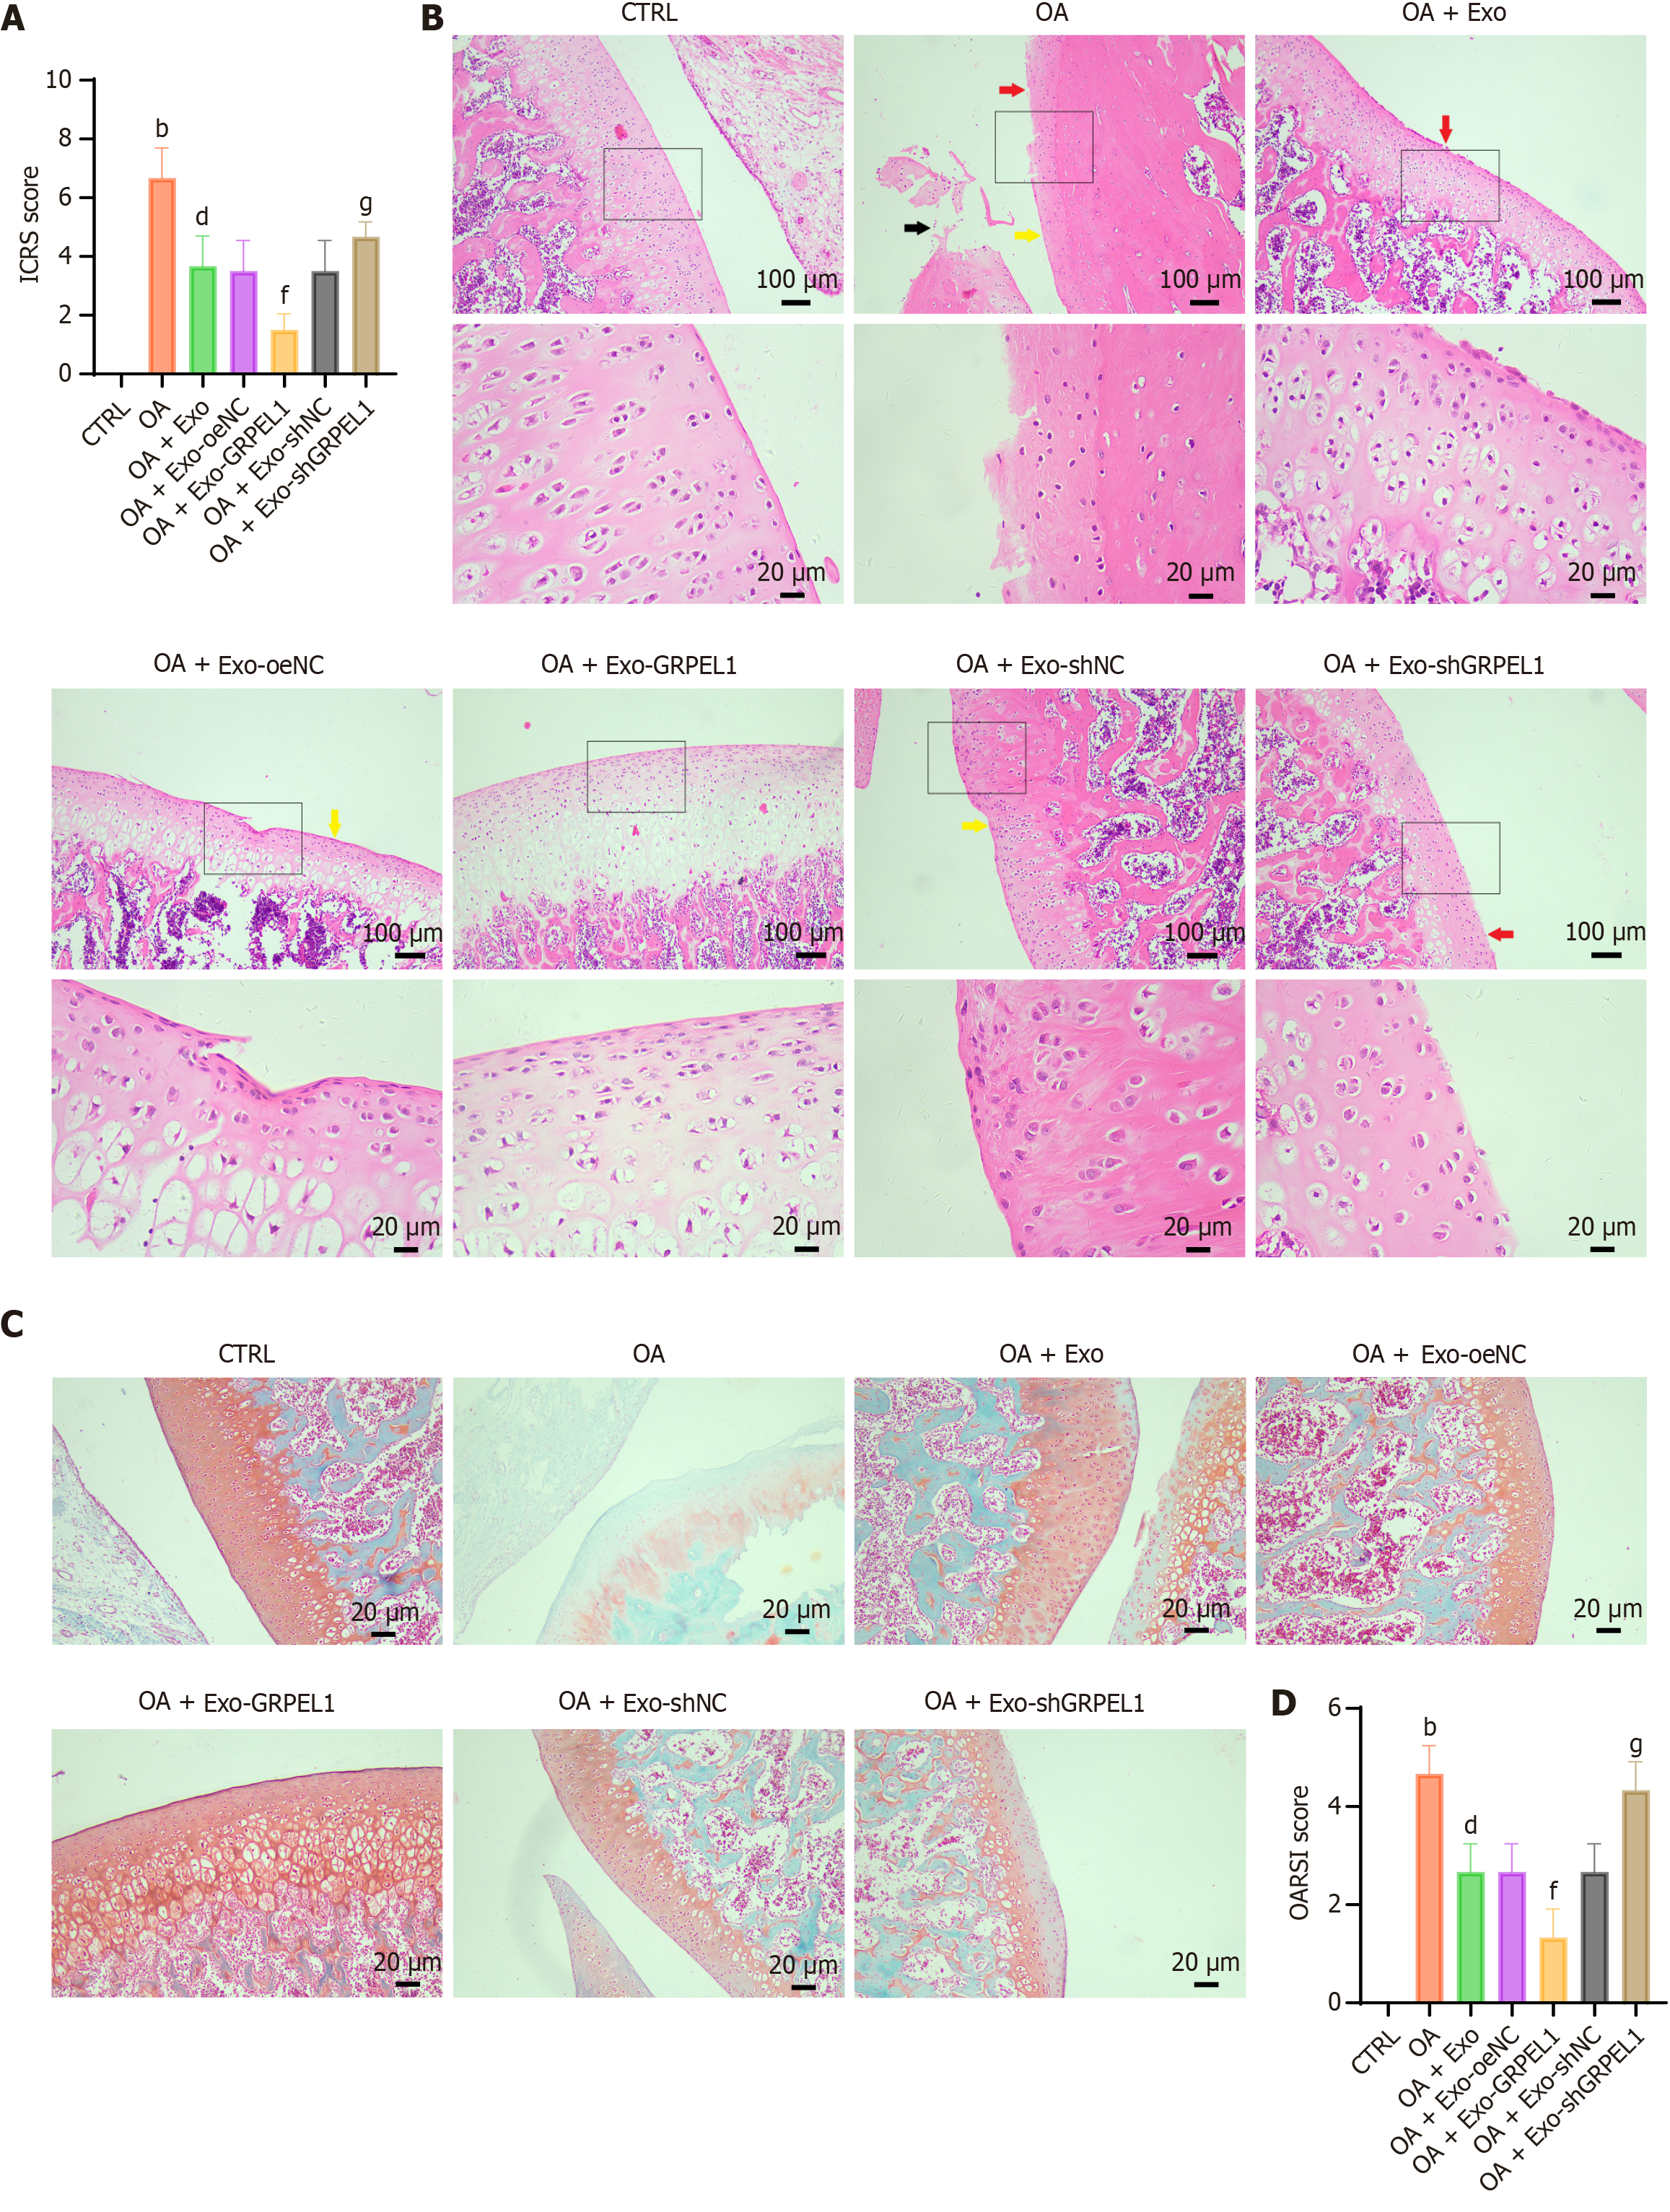
Figure 7 Cartilage injury assessment in rat osteoarthritis model after synovial mesenchymal stem cell-derived exosomes GrpE-like 1 delivery.
The figure evaluates cartilage repair and osteoarthritis progression across experimental groups. A: International Cartilage Repair Society macroscopic scoring of rat knee joints, providing comprehensive visual assessment of cartilage damage; B: Hematoxylin and eosin staining of knee cartilage tissue, revealing histological structural changes and inflammatory responses, red arrows indicate areas of cartilage surface erosion; yellow arrows indicate chondrocyte clustering; black arrows indicate matrix degradation or fissures; C: Safranin-O-Fast Green staining, demonstrating proteoglycan content and matrix integrity in cartilage tissue; D: Osteoarthritis Research Society International scoring, quantitatively assessing cartilage degeneration severity. Scale bar: 100 μm and 20 μm. bP < 0.01 vs control; dP < 0.01 vs OA; fP < 0.01 vs OA + Exo-oeNC; gP < 0.05 vs OA + Exo-shNC. ICRS: International Cartilage Repair Society; OA: Osteoarthritis; Exo: Exosome; OARSI: Osteoarthritis research society international.
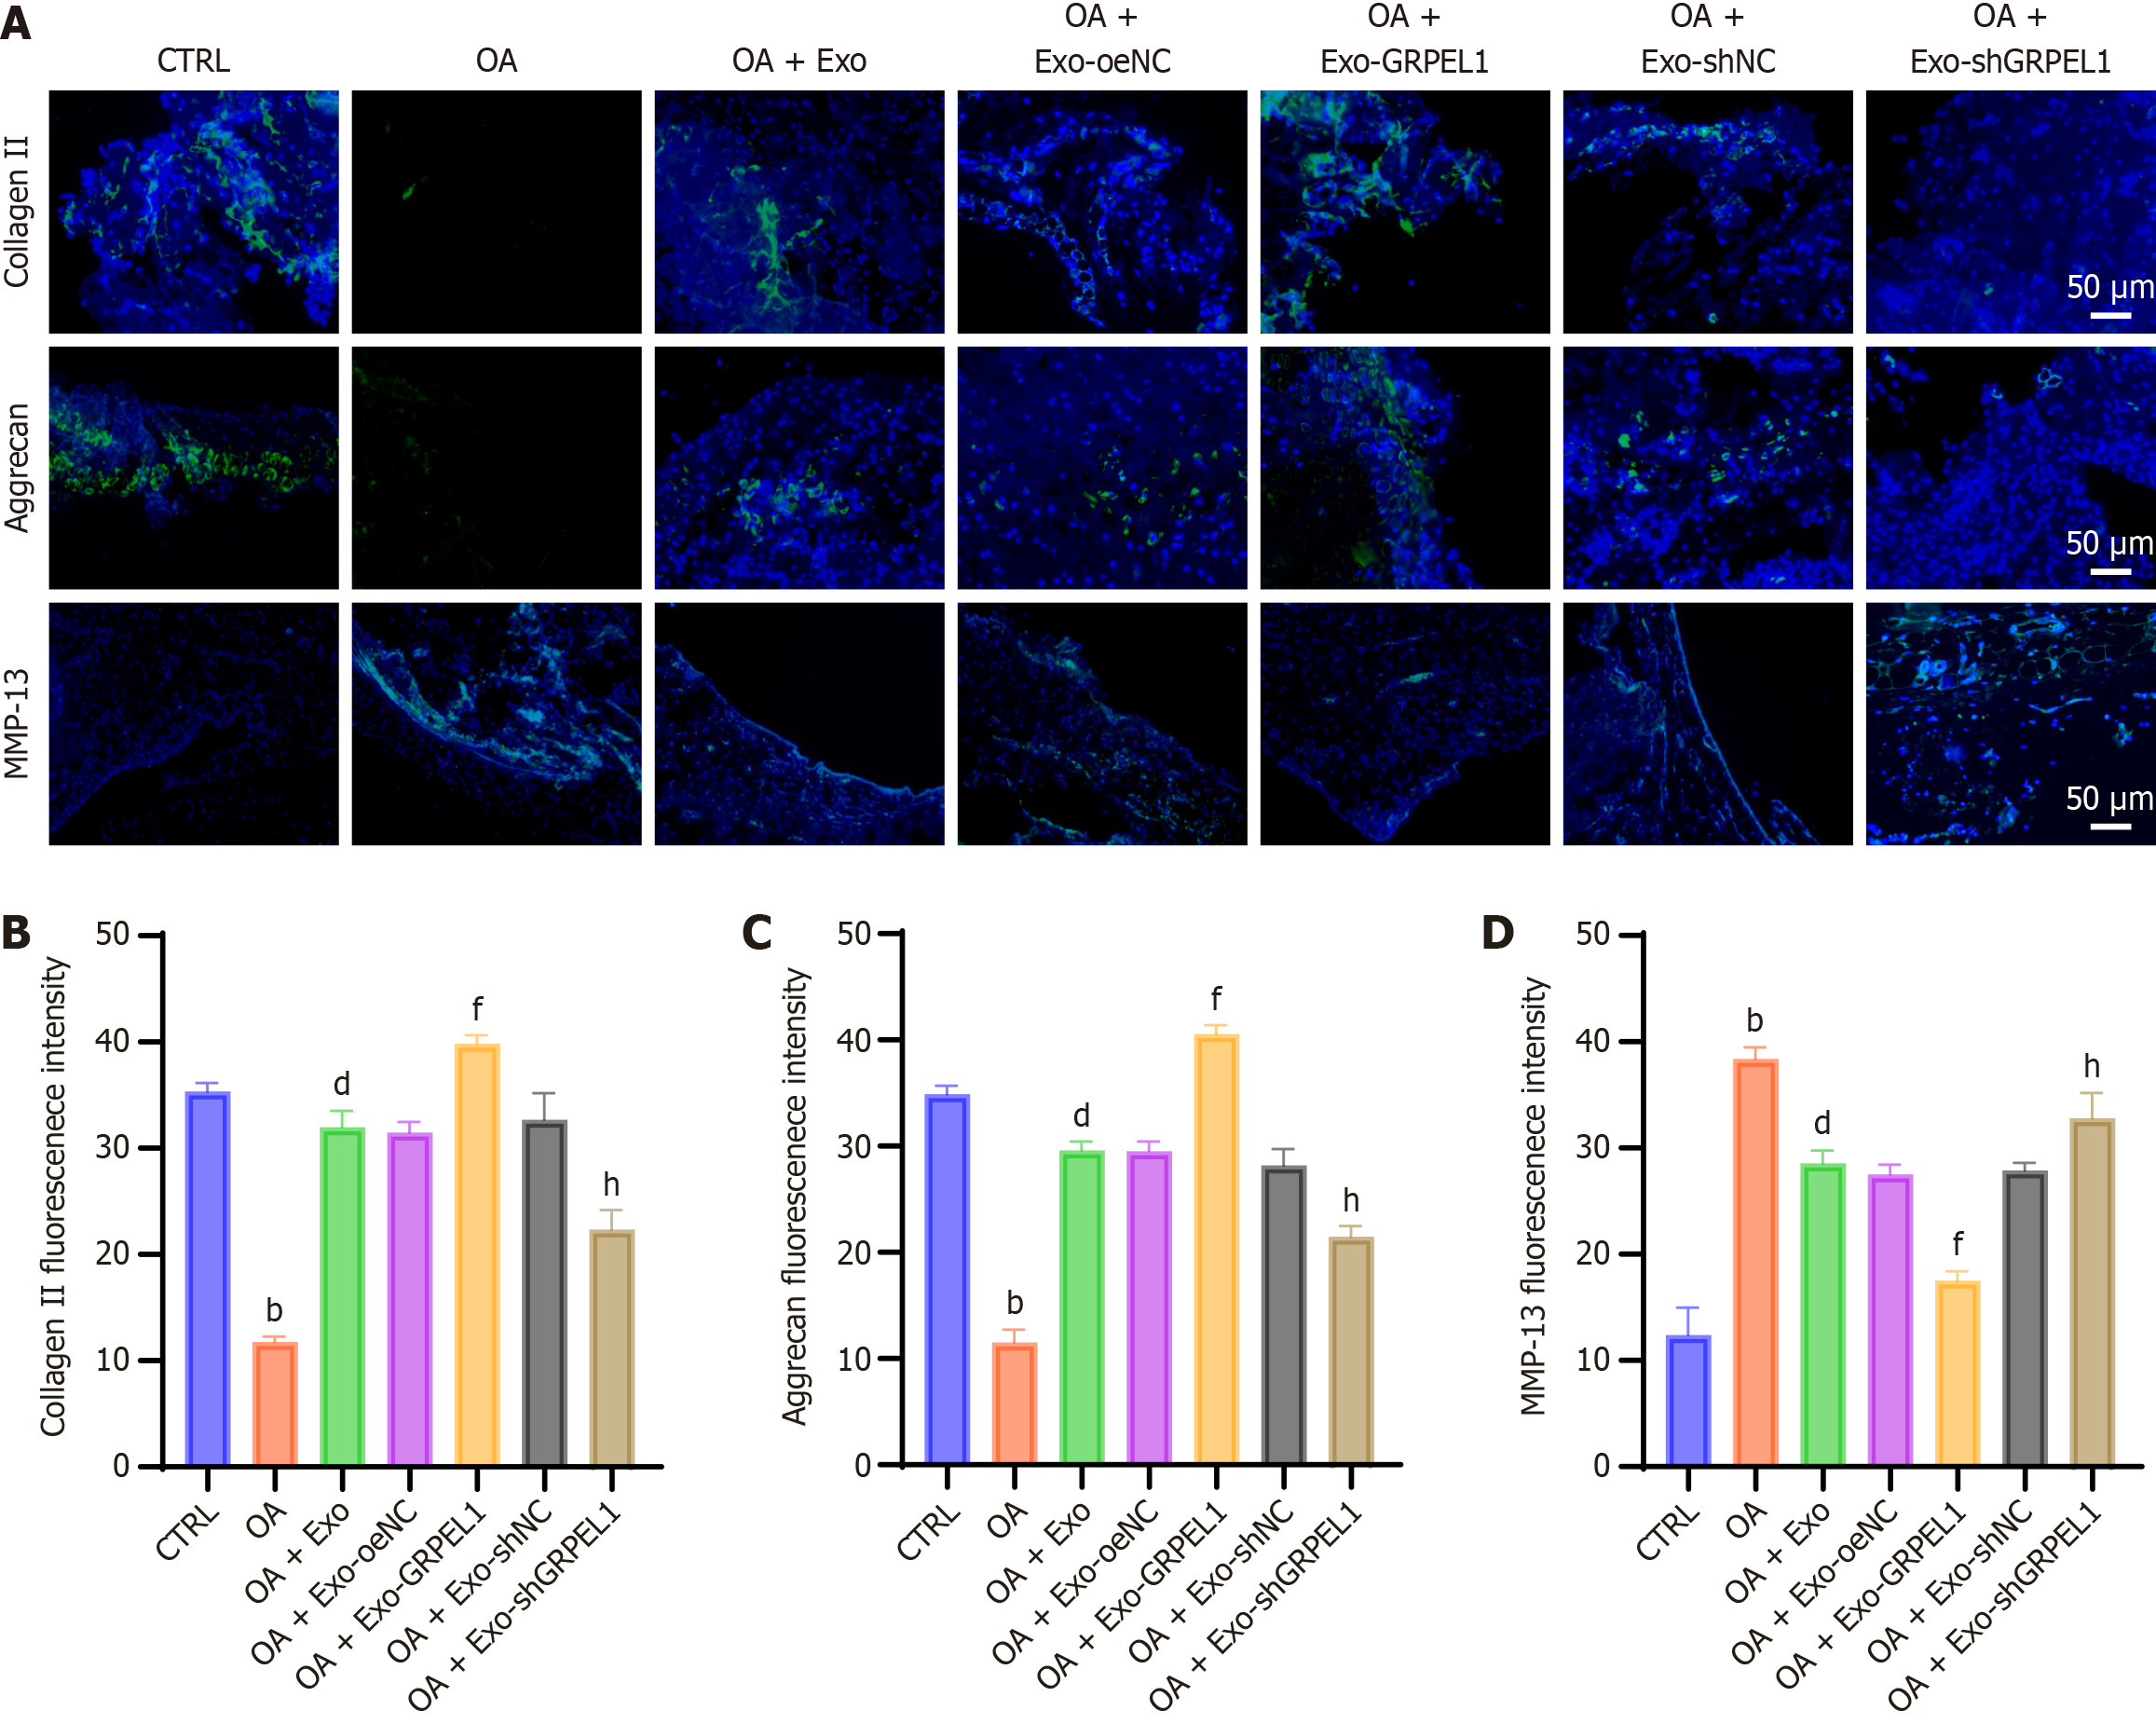
Figure 8 Cartilage degeneration assessment after synovial mesenchymal stem cell-derived exosomes GrpE-like 1 delivery in rat osteoarthritis model.
A: Immunofluorescence analysis of collagen II, aggrecan, and matrix metalloproteinase-13 in rat cartilage tissue across experimental groups, visualizing key cartilage matrix and degradation markers; B-D: Quantitative fluorescence intensity analysis of collagen II (B), aggrecan (C) and matrix metalloproteinase-13 (D), revealing matrix protein preservation and potential cartilage regeneration. Scale bar: 50 μm. bP < 0.01 vs Control; dP < 0.01 vs OA; fP < 0.01 vs OA + Exo-oeNC; hP < 0.01 vs OA + Exo-shNC. MMP-13: Matrix metalloproteinase-13.
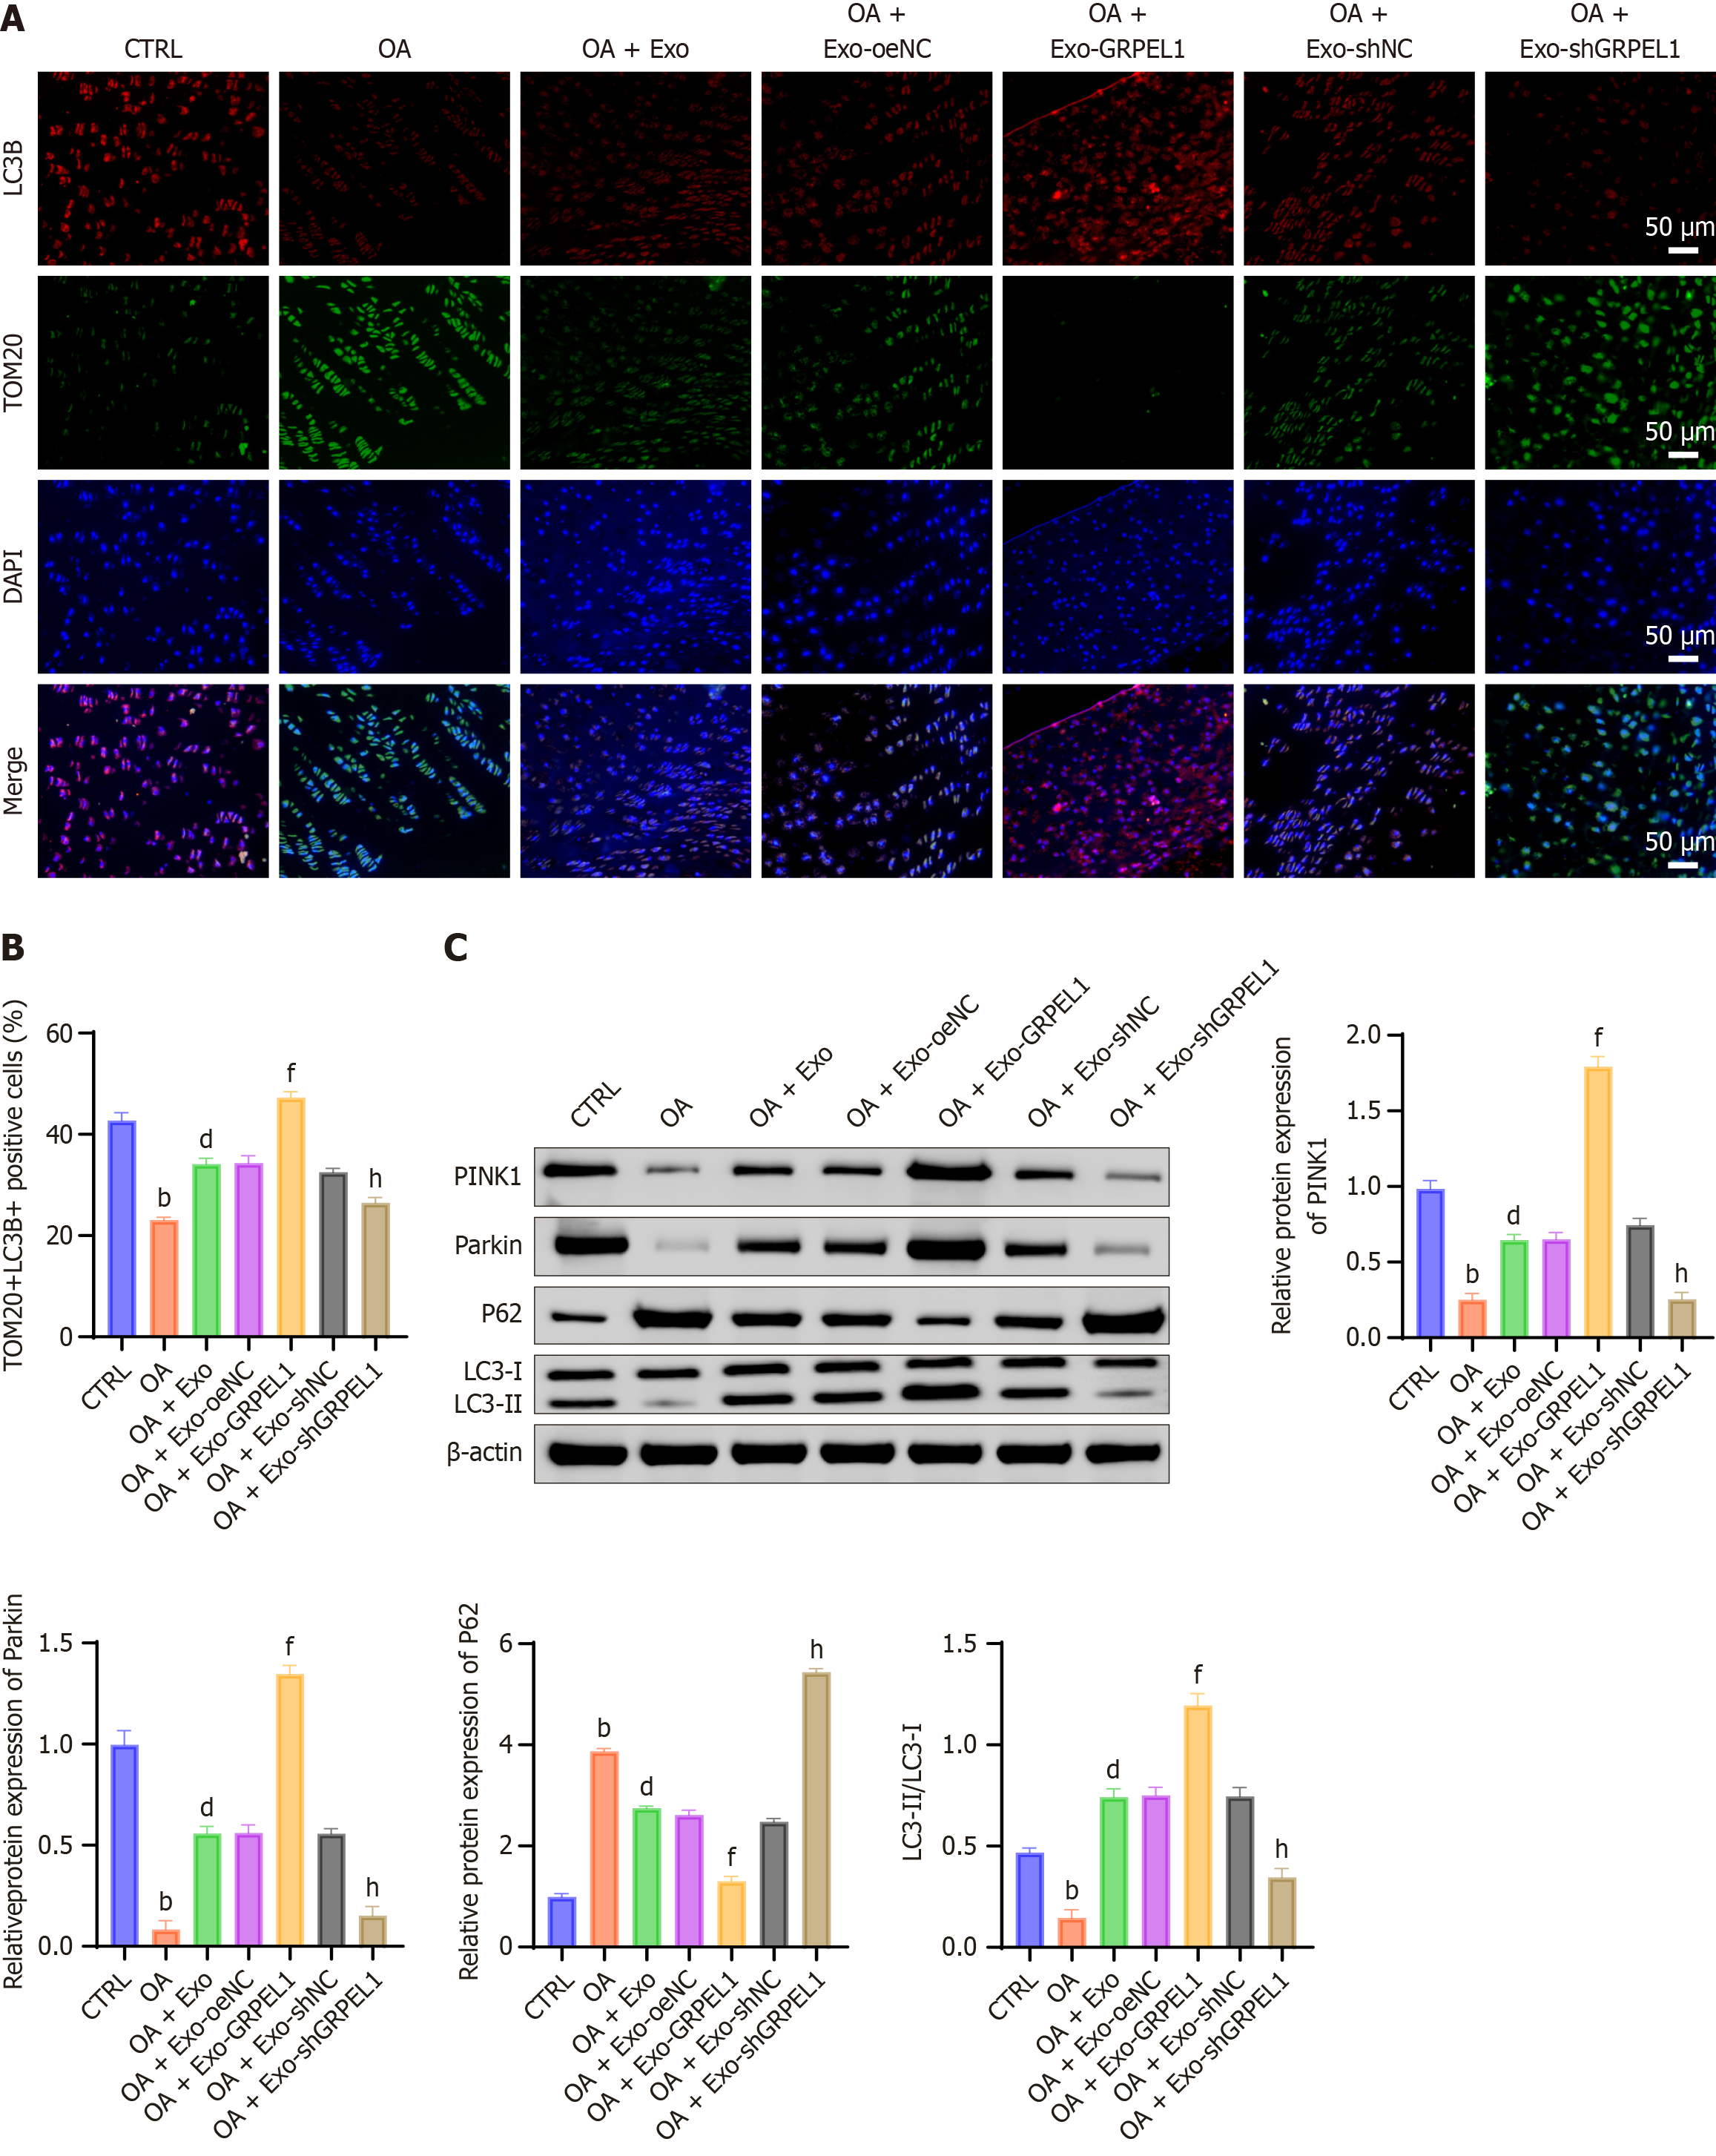
Figure 9 Mitochondrial autophagy assessment in rat osteoarthritis cartilage cells after stem cell-derived exosomes GrpE-like 1 delivery.
A: Immunofluorescence analysis of translocase of the outer membrane 20 and light chain 3B in rat cartilage tissue, visualizing mitochondrial and autophagic marker co-localization; B: Quantitative analysis of TOM20+LC3B+ double-positive cells based on immunofluorescence staining shown in (A), indicating the extent of mitophagy activation across experimental groups; C: Western blot analysis of mitophagy-related proteins (phosphatase and tensin homolog-induced putative kinase 1, parkin, P62, light chain 3 II/I) using protein lysates extracted from rat cartilage tissue, demonstrating mitochondrial quality control mechanisms. Scale bar: 50 μm. bP < 0.01 vs control; dP < 0.01 vs IL-1β; fP < 0.01 vs IL-1β + Exo-oeNC; hP < 0.01 vs IL-1β + Exo-shNC. TOM20: Translocase of the outer membrane 20; LC3B: Light chain 3B; DAPI: 4’-6-diamidino-2-phenylindole; PINK1: Phosphatase and tensin homolog-induced putative kinase 1; LC3-II/LC3-I: Light chain 3 II/I.
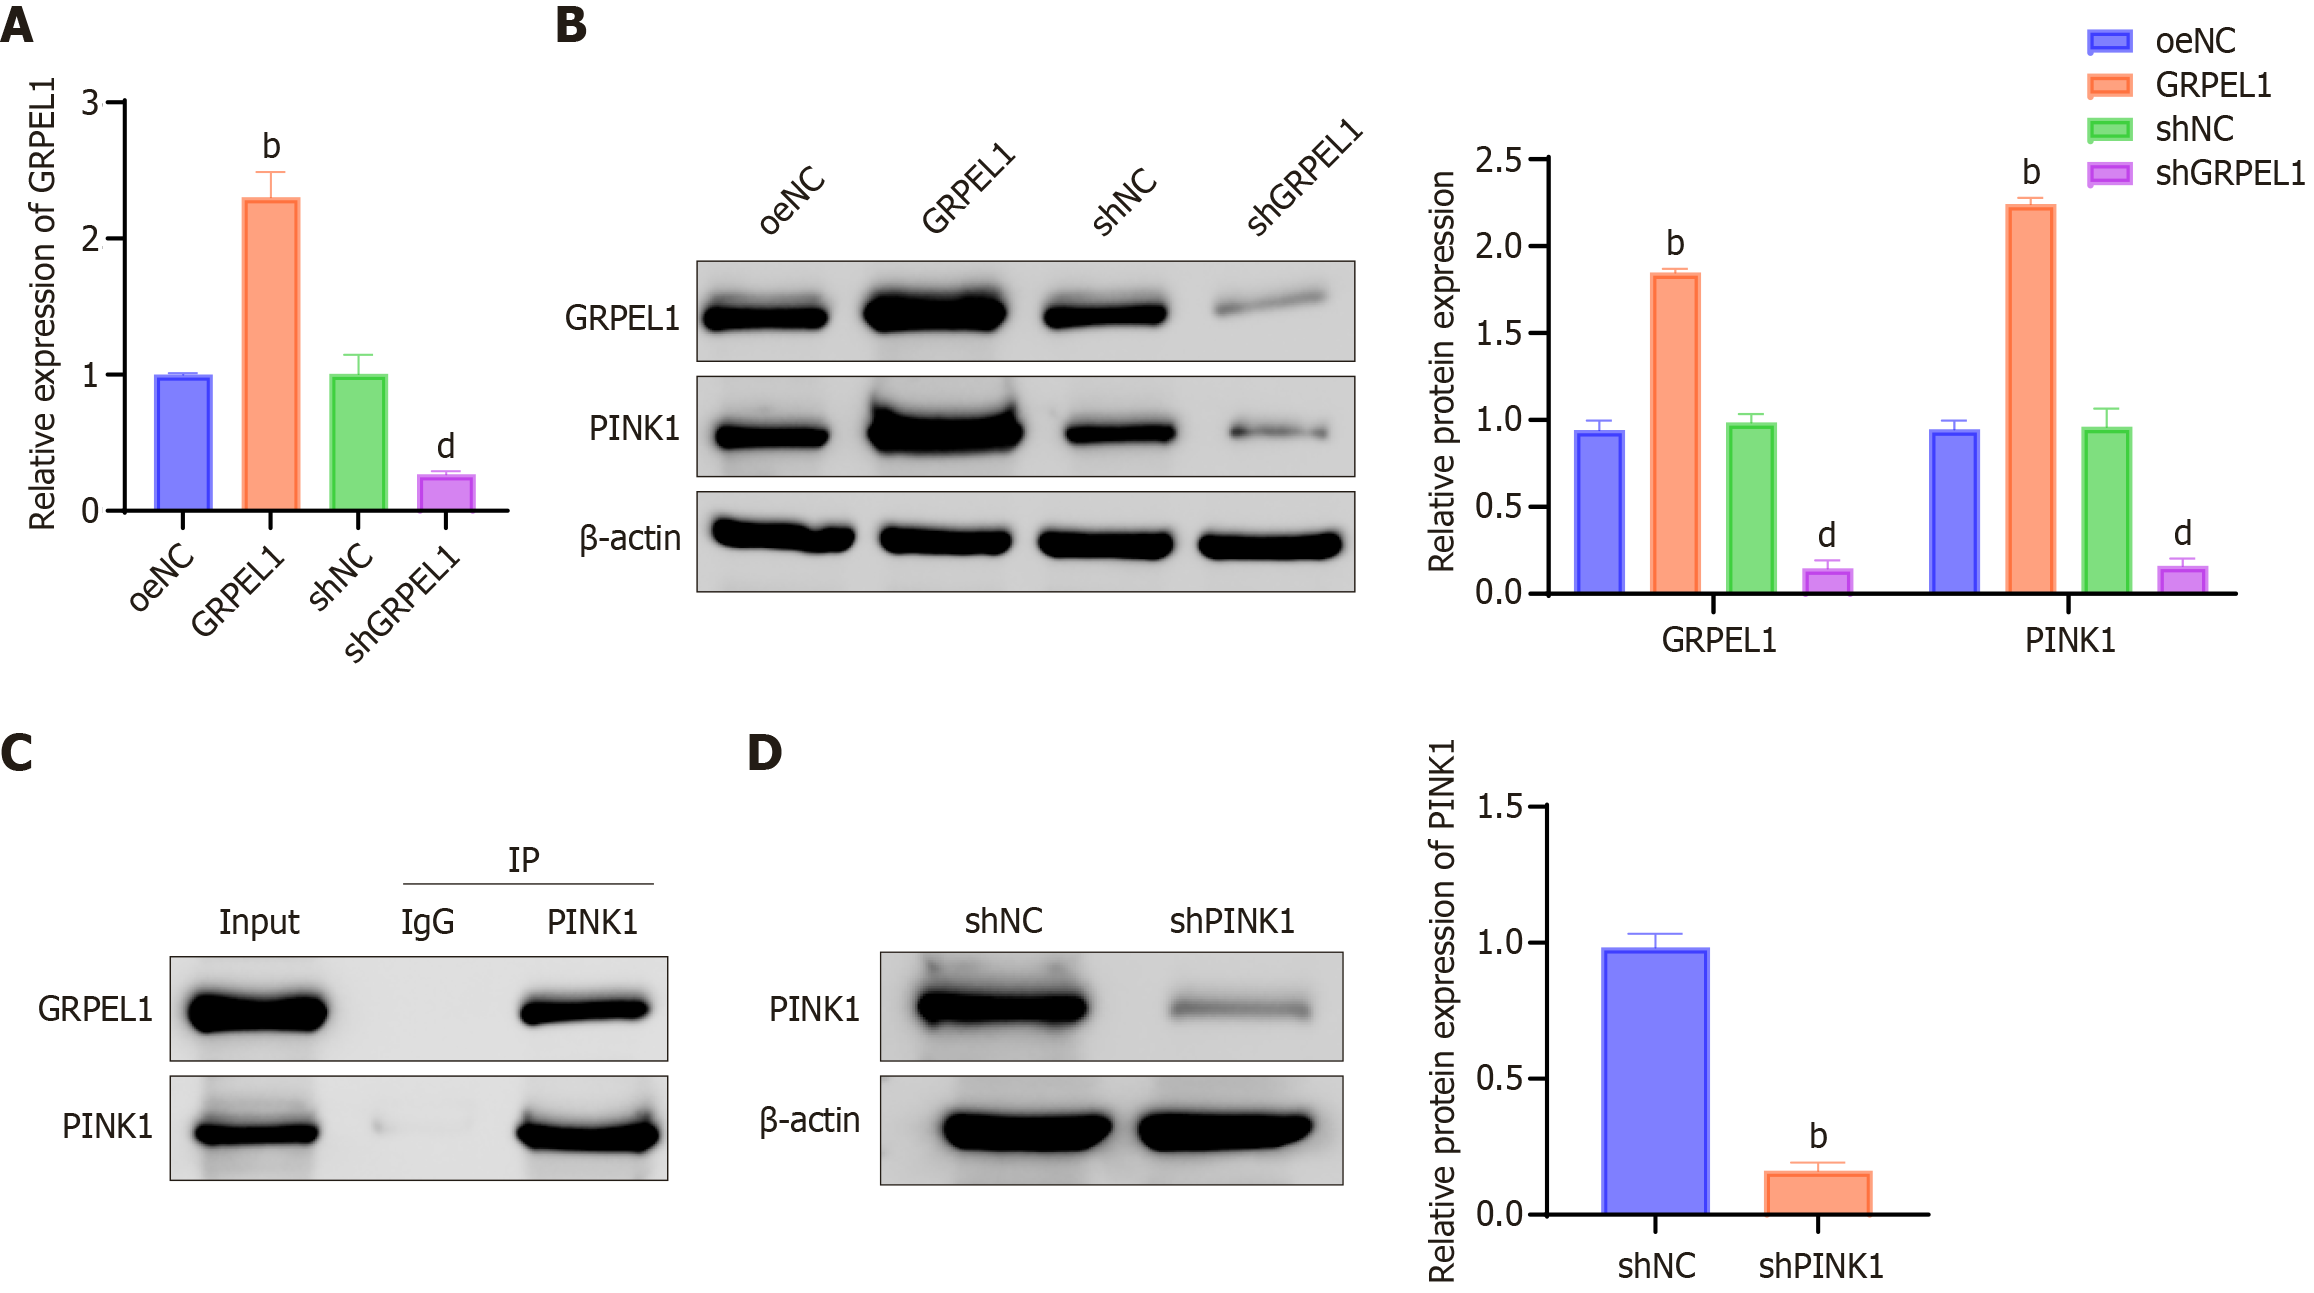
Figure 10 Verification of GrpE-like 1 and phosphatase and tensin homolog-induced putative kinase 1 interaction.
A: GrpE-like 1 (GRPEL1) expression levels in CHON-001 cells across experimental groups, detected using quantitative real-time polymerase chain reaction; B: Protein expression levels of GRPEL1 and phosphatase and tensin homolog-induced putative kinase 1 (PINK1) in CHON-001 cells across experimental groups; C: Co-immunoprecipitation analysis demonstrating the direct molecular interaction between GRPEL1 and PINK1; D: Western blot assessment of PINK1 protein expression in shNC and shPINK1 CHON-001 cell groups. bP < 0.01 vs oeNC; dP < 0.01 vs shNC. GRPEL1: GrpE-like 1; PINK1: Phosphatase and tensin homolog-induced putative kinase 1; IP: Immunoprecipitation; IgG: Immunoglobulin G.
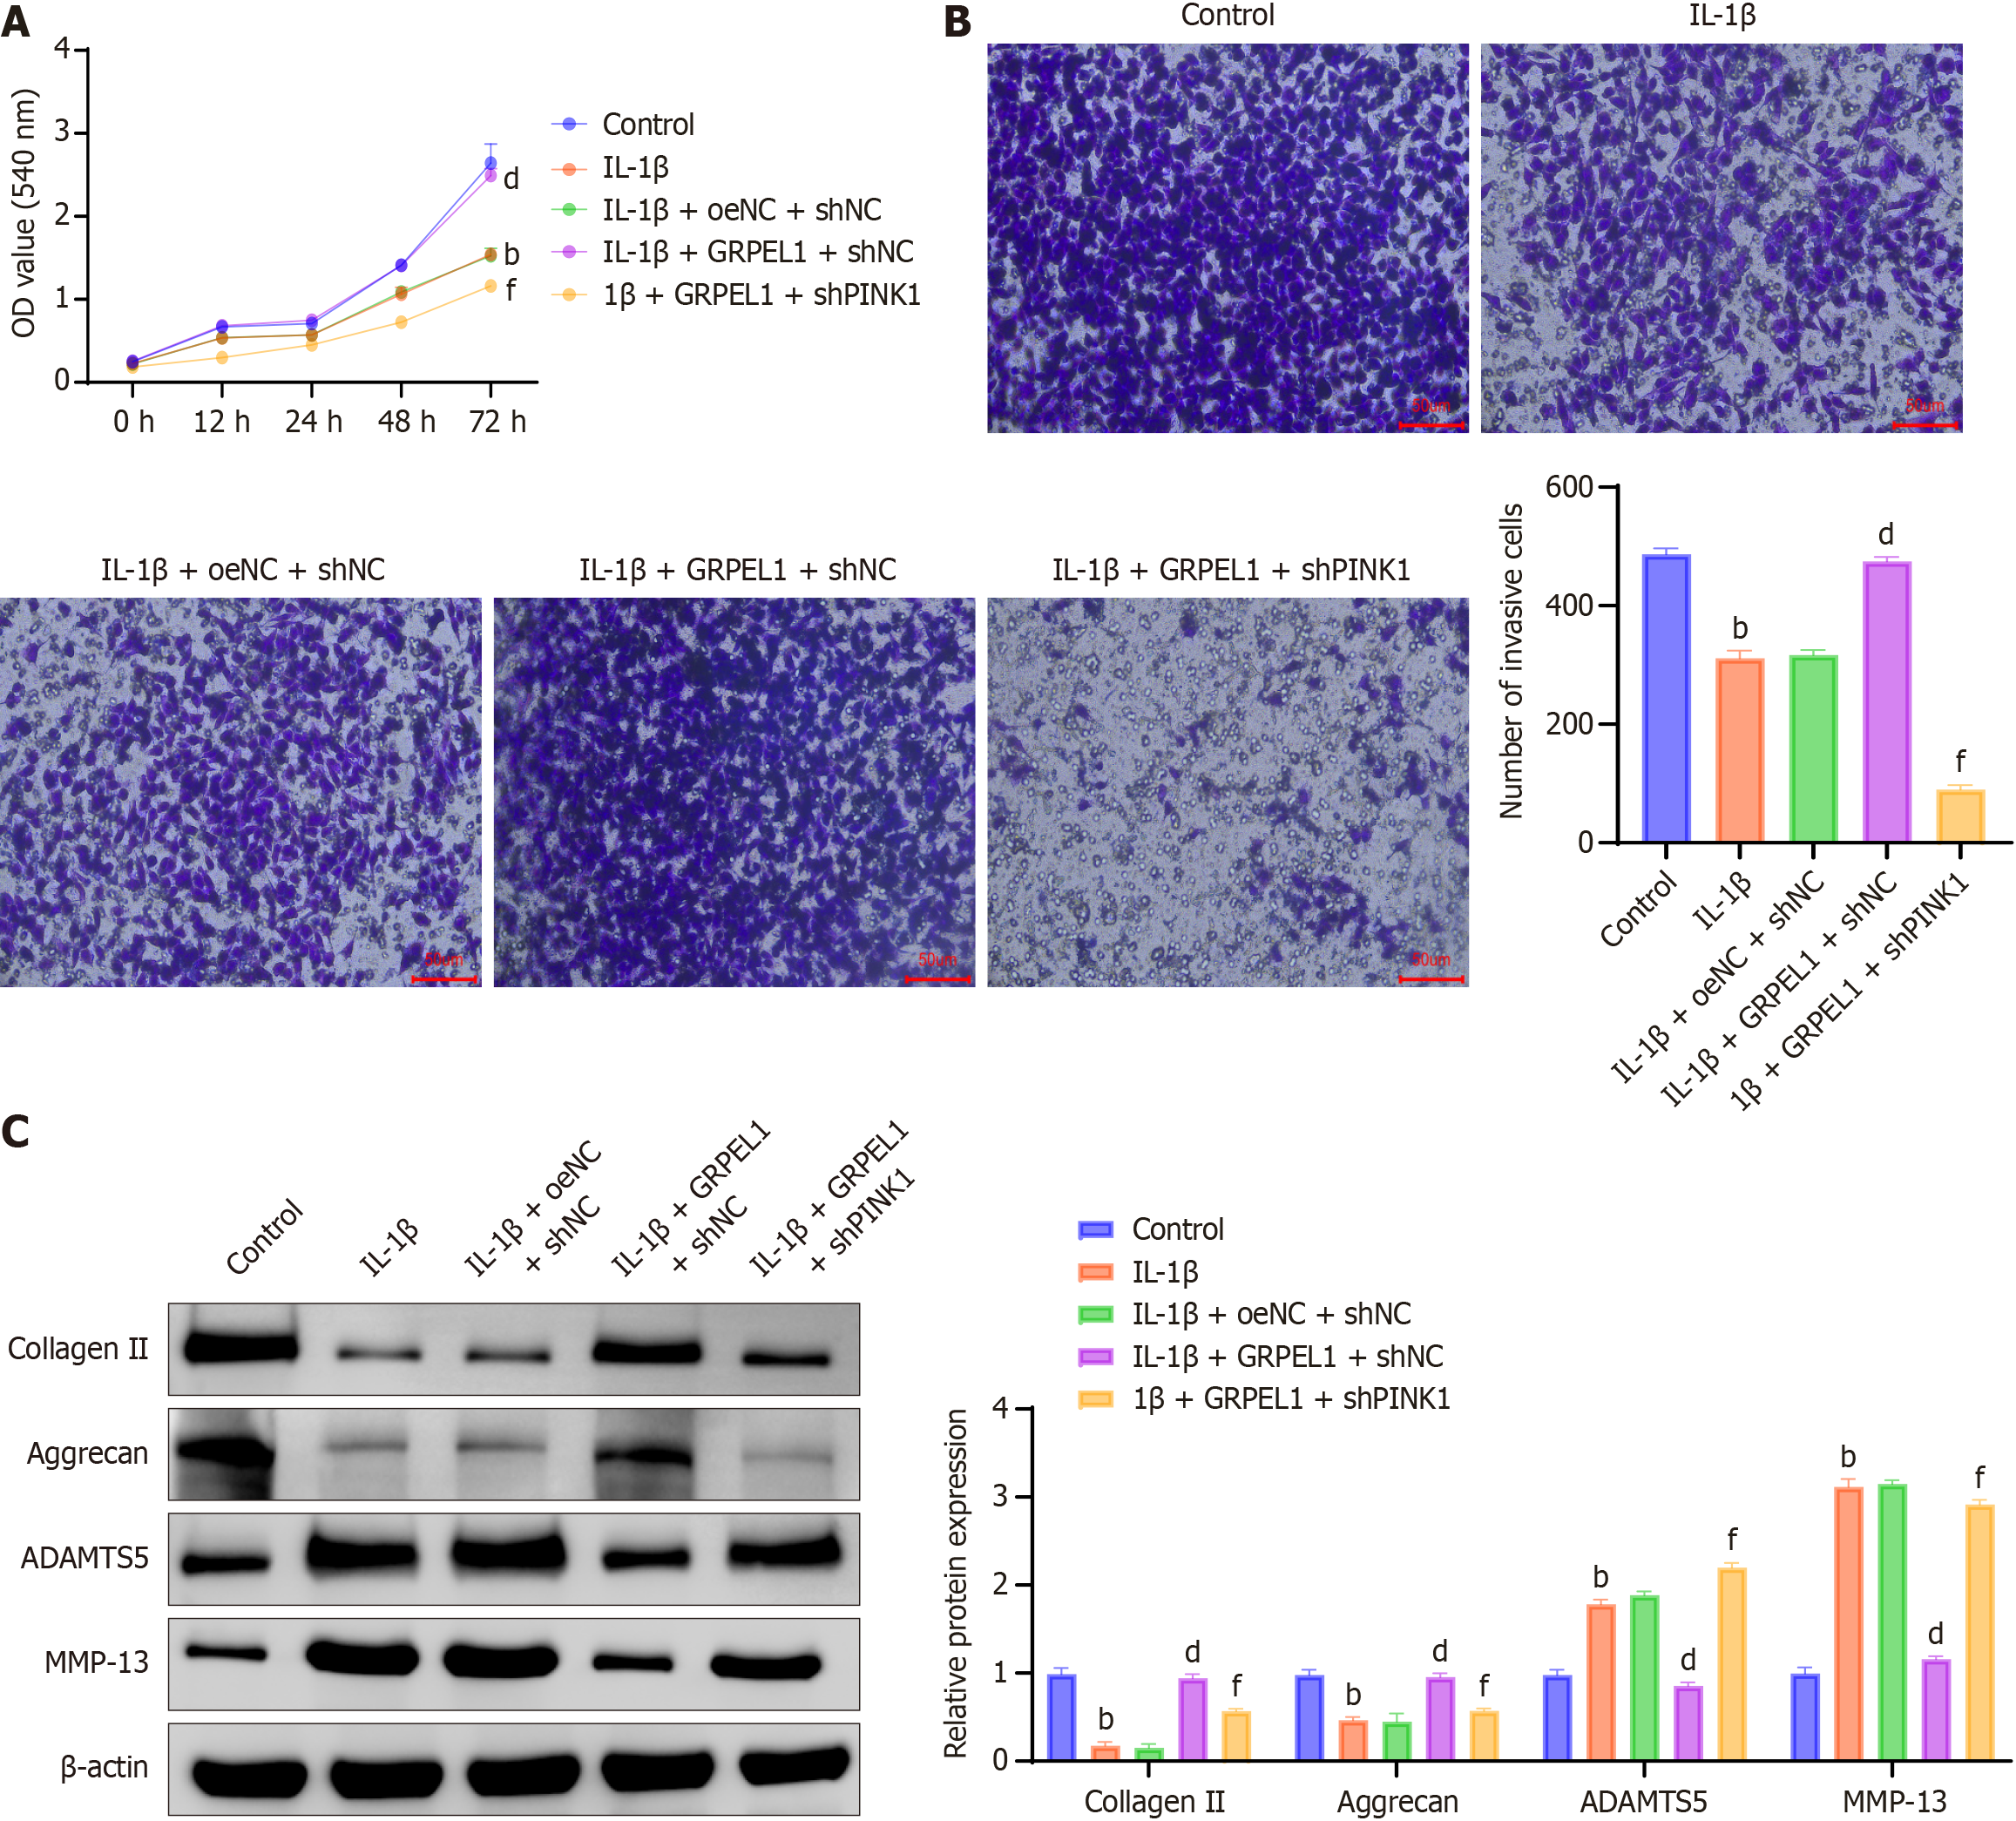
Figure 11 Impact of phosphatase and tensin homolog-induced putative kinase 1 knockdown on GrpE-like 1-mediated changes in interleukin-1 beta-induced CHON-001 cells.
A: Cell viability assessment across experimental groups, evaluating cellular metabolic activity using the CCK-8 assay; B: Transwell migration assay to determine cellular migratory capacity under different conditions (scale bar: 50 μm); C: Western blot analysis of cartilage-associated proteins (collagen II, aggrecan, a disintegrin and metalloproteinase with thrombospondin motifs 5, matrix metalloproteinase-13) to assess matrix metabolism and chondrocyte phenotype. bP < 0.01 vs control; dP < 0.01 vs IL-1β + oeNC + shNC; fP < 0.01 vs IL-1β + GRPEL1 + shNC. OD: Optical density; ADAMTS5: A disintegrin and metalloproteinase with thrombospondin motifs 5; MMP-13: Matrix metalloproteinase-13.
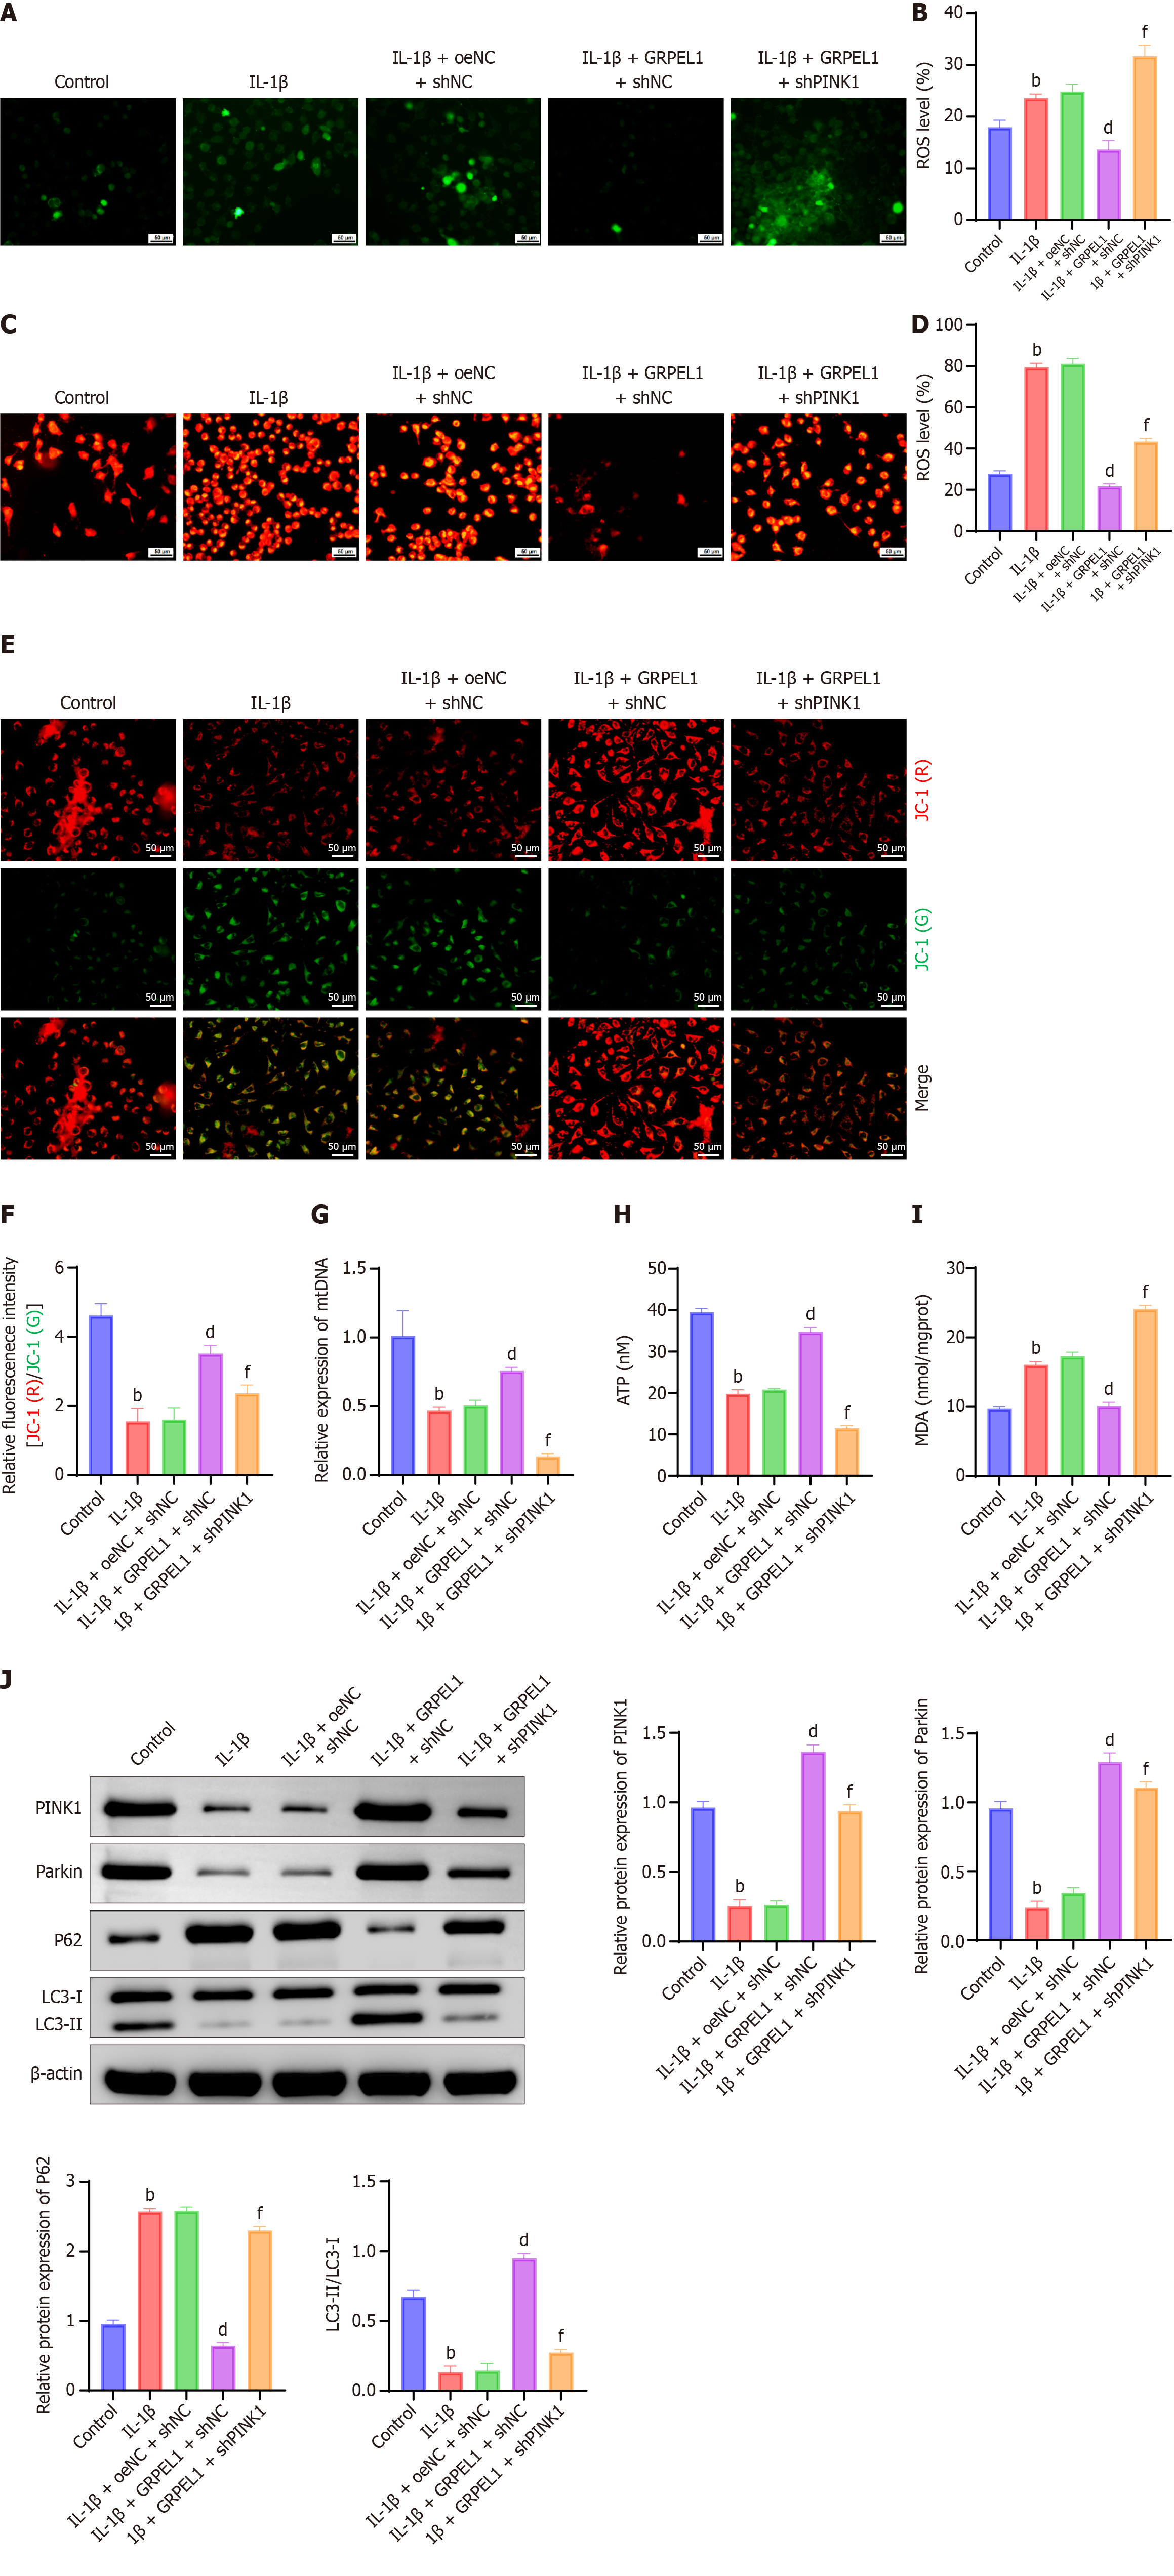
Figure 12 Impact of phosphatase and tensin homolog-induced putative kinase 1 knockdown on mitochondrial dysfunction and mitophagy in interleukin-1 beta-induced CHON-001 cells.
Changes in CHON-001 cells were observed in the experimental groups. A-J: Total reactive oxygen species levels (A and B), mitochondrial reactive oxygen species levels (C and D), mitochondrial membrane potential (JC-1) (E and F), mitochondrial DNA levels (G), ATP levels (H), malondialdehyde levels (I) and protein expression levels of phosphatase and tensin homolog-induced putative kinase 1, parkin, P62, and light chain 3 II/I (J) in CHON-001 cells from each group. Statistical notation consistent with previous figures recommended. Scale bar: 50 μm. bP < 0.01 vs control; dP < 0.01 vs IL-1β + oeNC + shNC; fP < 0.01 vs IL-1β + GRPEL1 + shNC. ROS: Reactive oxygen species; mtDNA: Mitochondrial DNA; ATP: Adenosine triphosphate; MDA: Malondialdehyde; PINK1: Phosphatase and tensin homolog-induced putative kinase 1; LC3-II/LC3-I: Light chain 3 conversion.
- Citation: Xiang CH, Zou L, Huang ZG, Zhang GJ, Zeng HL, He ZX, Dai ZS. Synovial mesenchymal stem cell-derived exosomes delivering GRPEL1 activate PINK1-mediated mitophagy to promote cartilage repair in arthritis. World J Stem Cells 2025; 17(10): 109369
- URL: https://www.wjgnet.com/1948-0210/full/v17/i10/109369.htm
- DOI: https://dx.doi.org/10.4252/wjsc.v17.i10.109369


