Copyright
©The Author(s) 2024.
World J Stem Cells. May 26, 2024; 16(5): 512-524
Published online May 26, 2024. doi: 10.4252/wjsc.v16.i5.512
Published online May 26, 2024. doi: 10.4252/wjsc.v16.i5.512
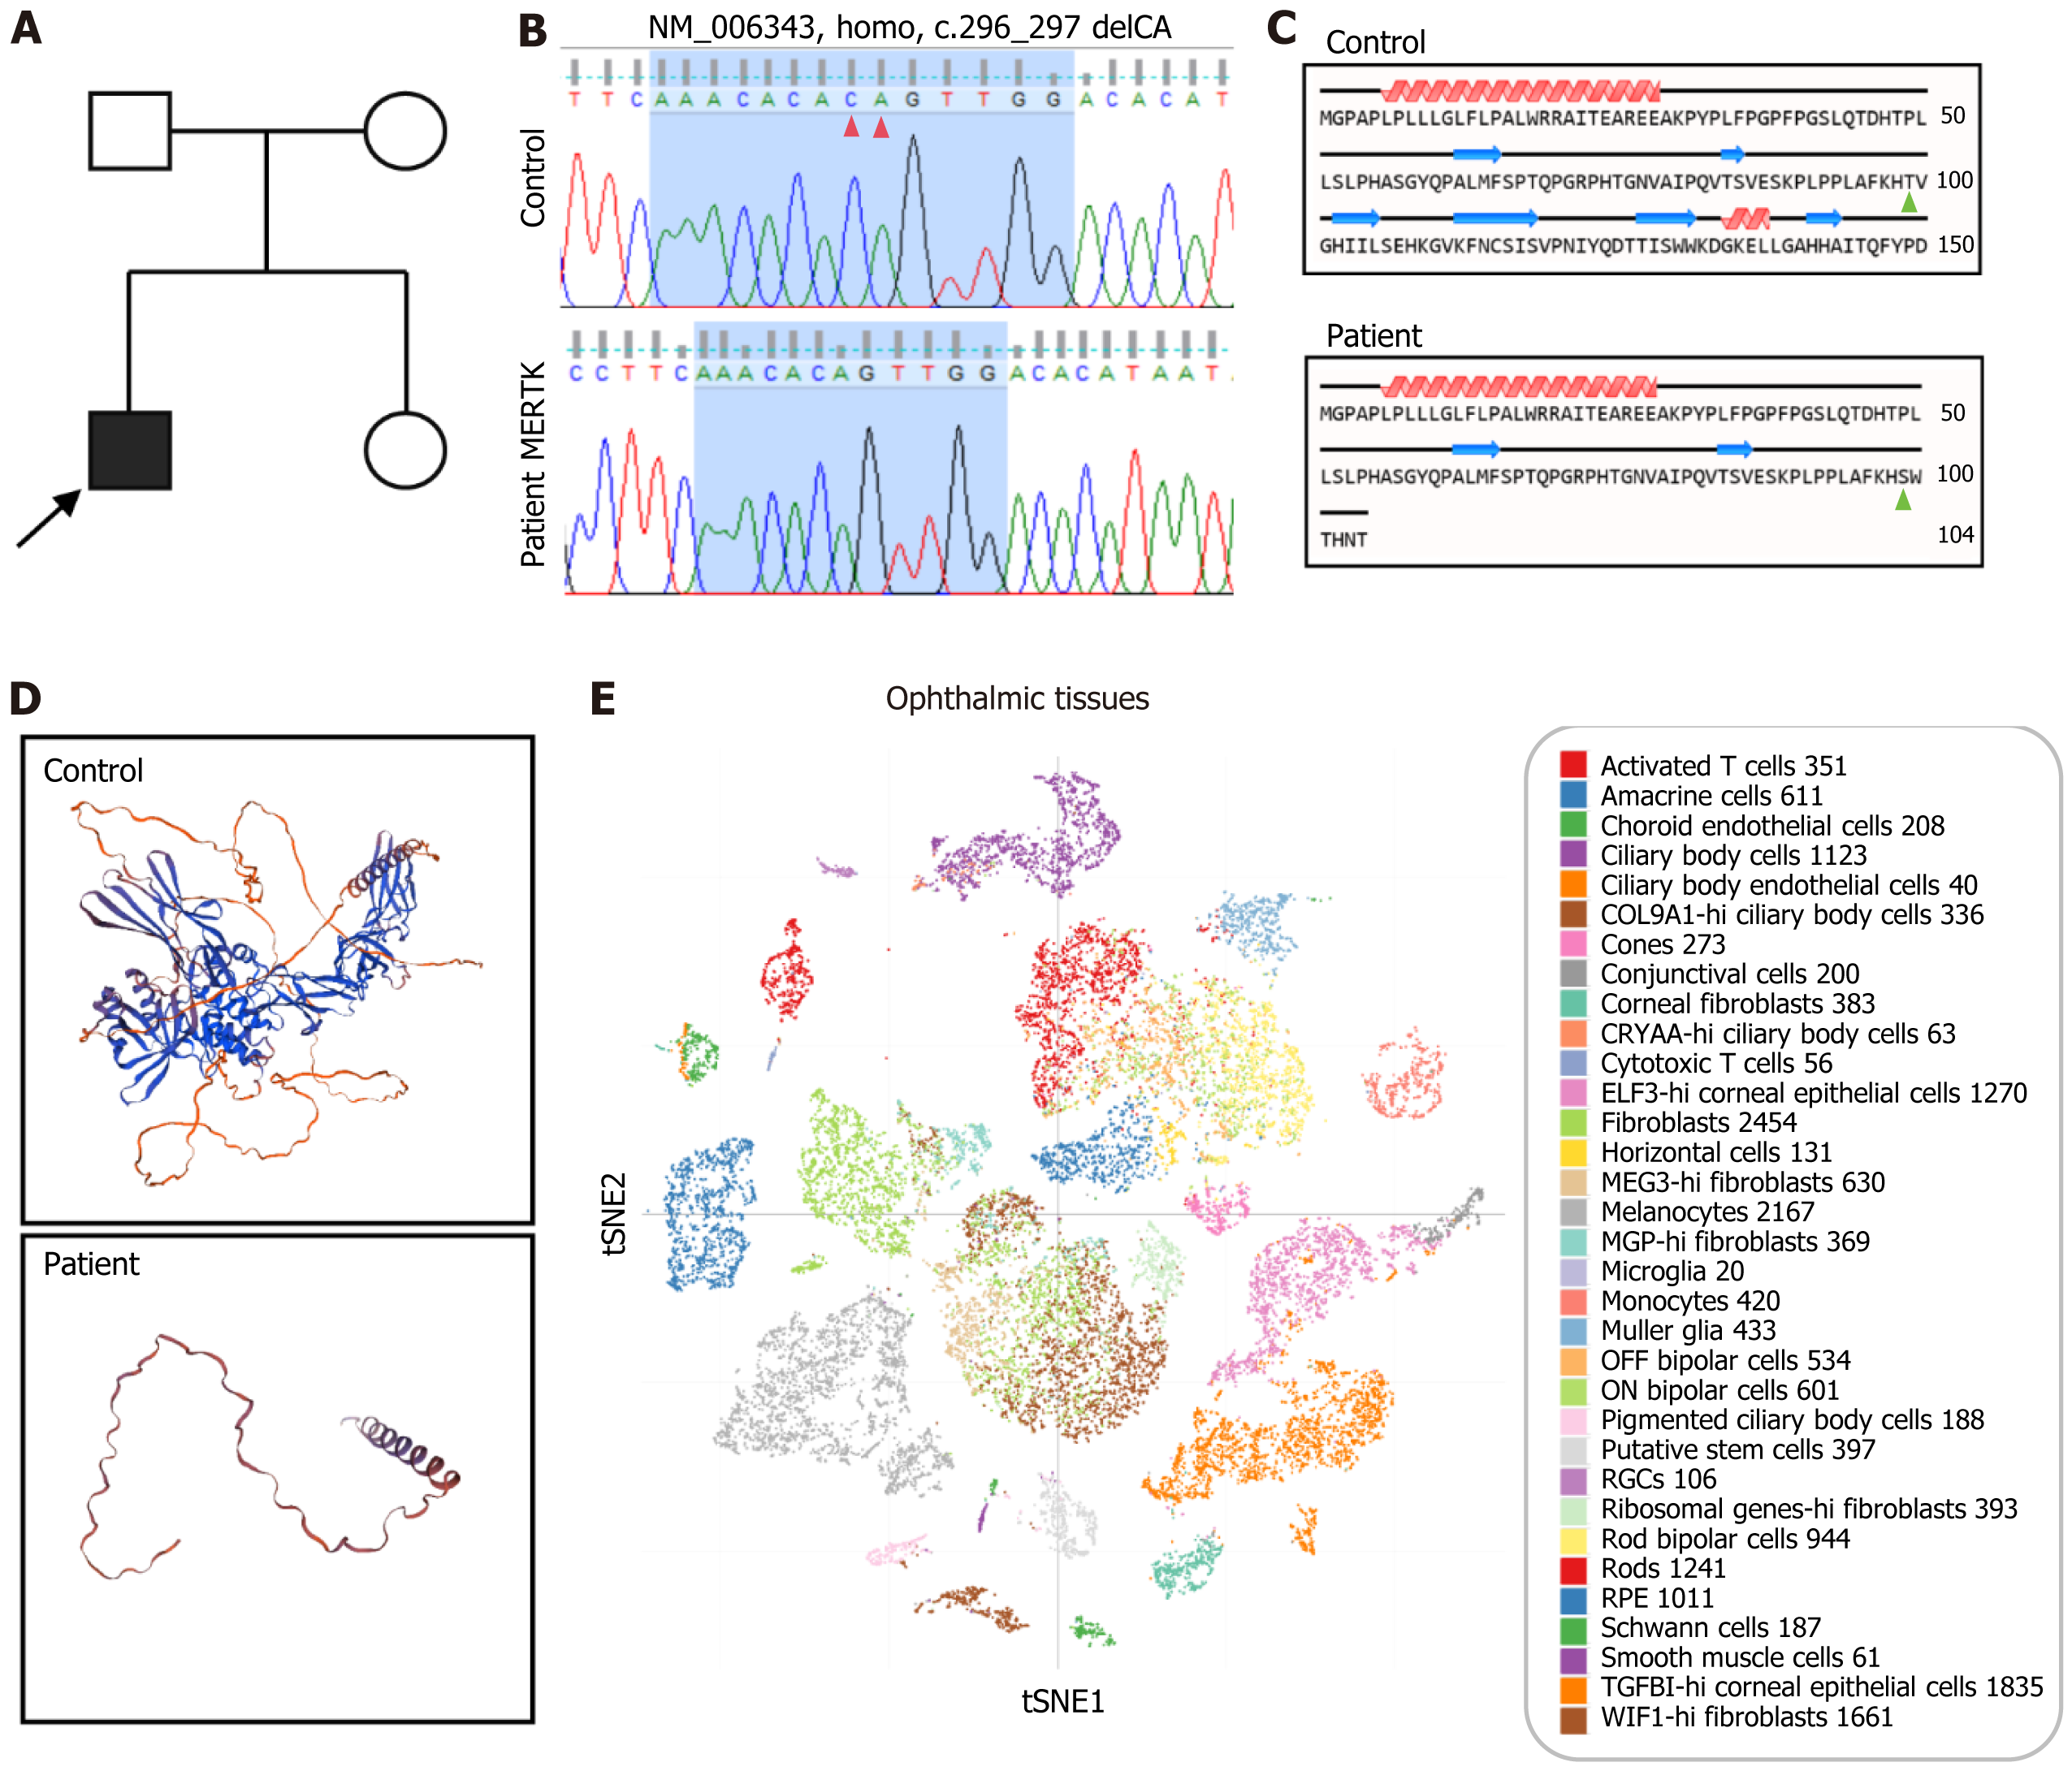
Figure 1 Identification of the MERTK mutation in the retinitis pigmentosa patient.
A: Family pedigree; B: Sanger sequencing of the healthy control and the retinitis pigmentosa (RP) patient. Two-base deletion of CA in the RP patient (red arrows); C: Protein translation of the healthy control and RP patient. The 99th threonine was replaced by serine in the RP patient (green arrows), resulting in the emergence of a new reading frame, leading to translation termination at the 8th codon downstream; D: MERTK protein structure prediction of the healthy control and the RP patient; E: MERTK gene expression in ophthalmic tissue.
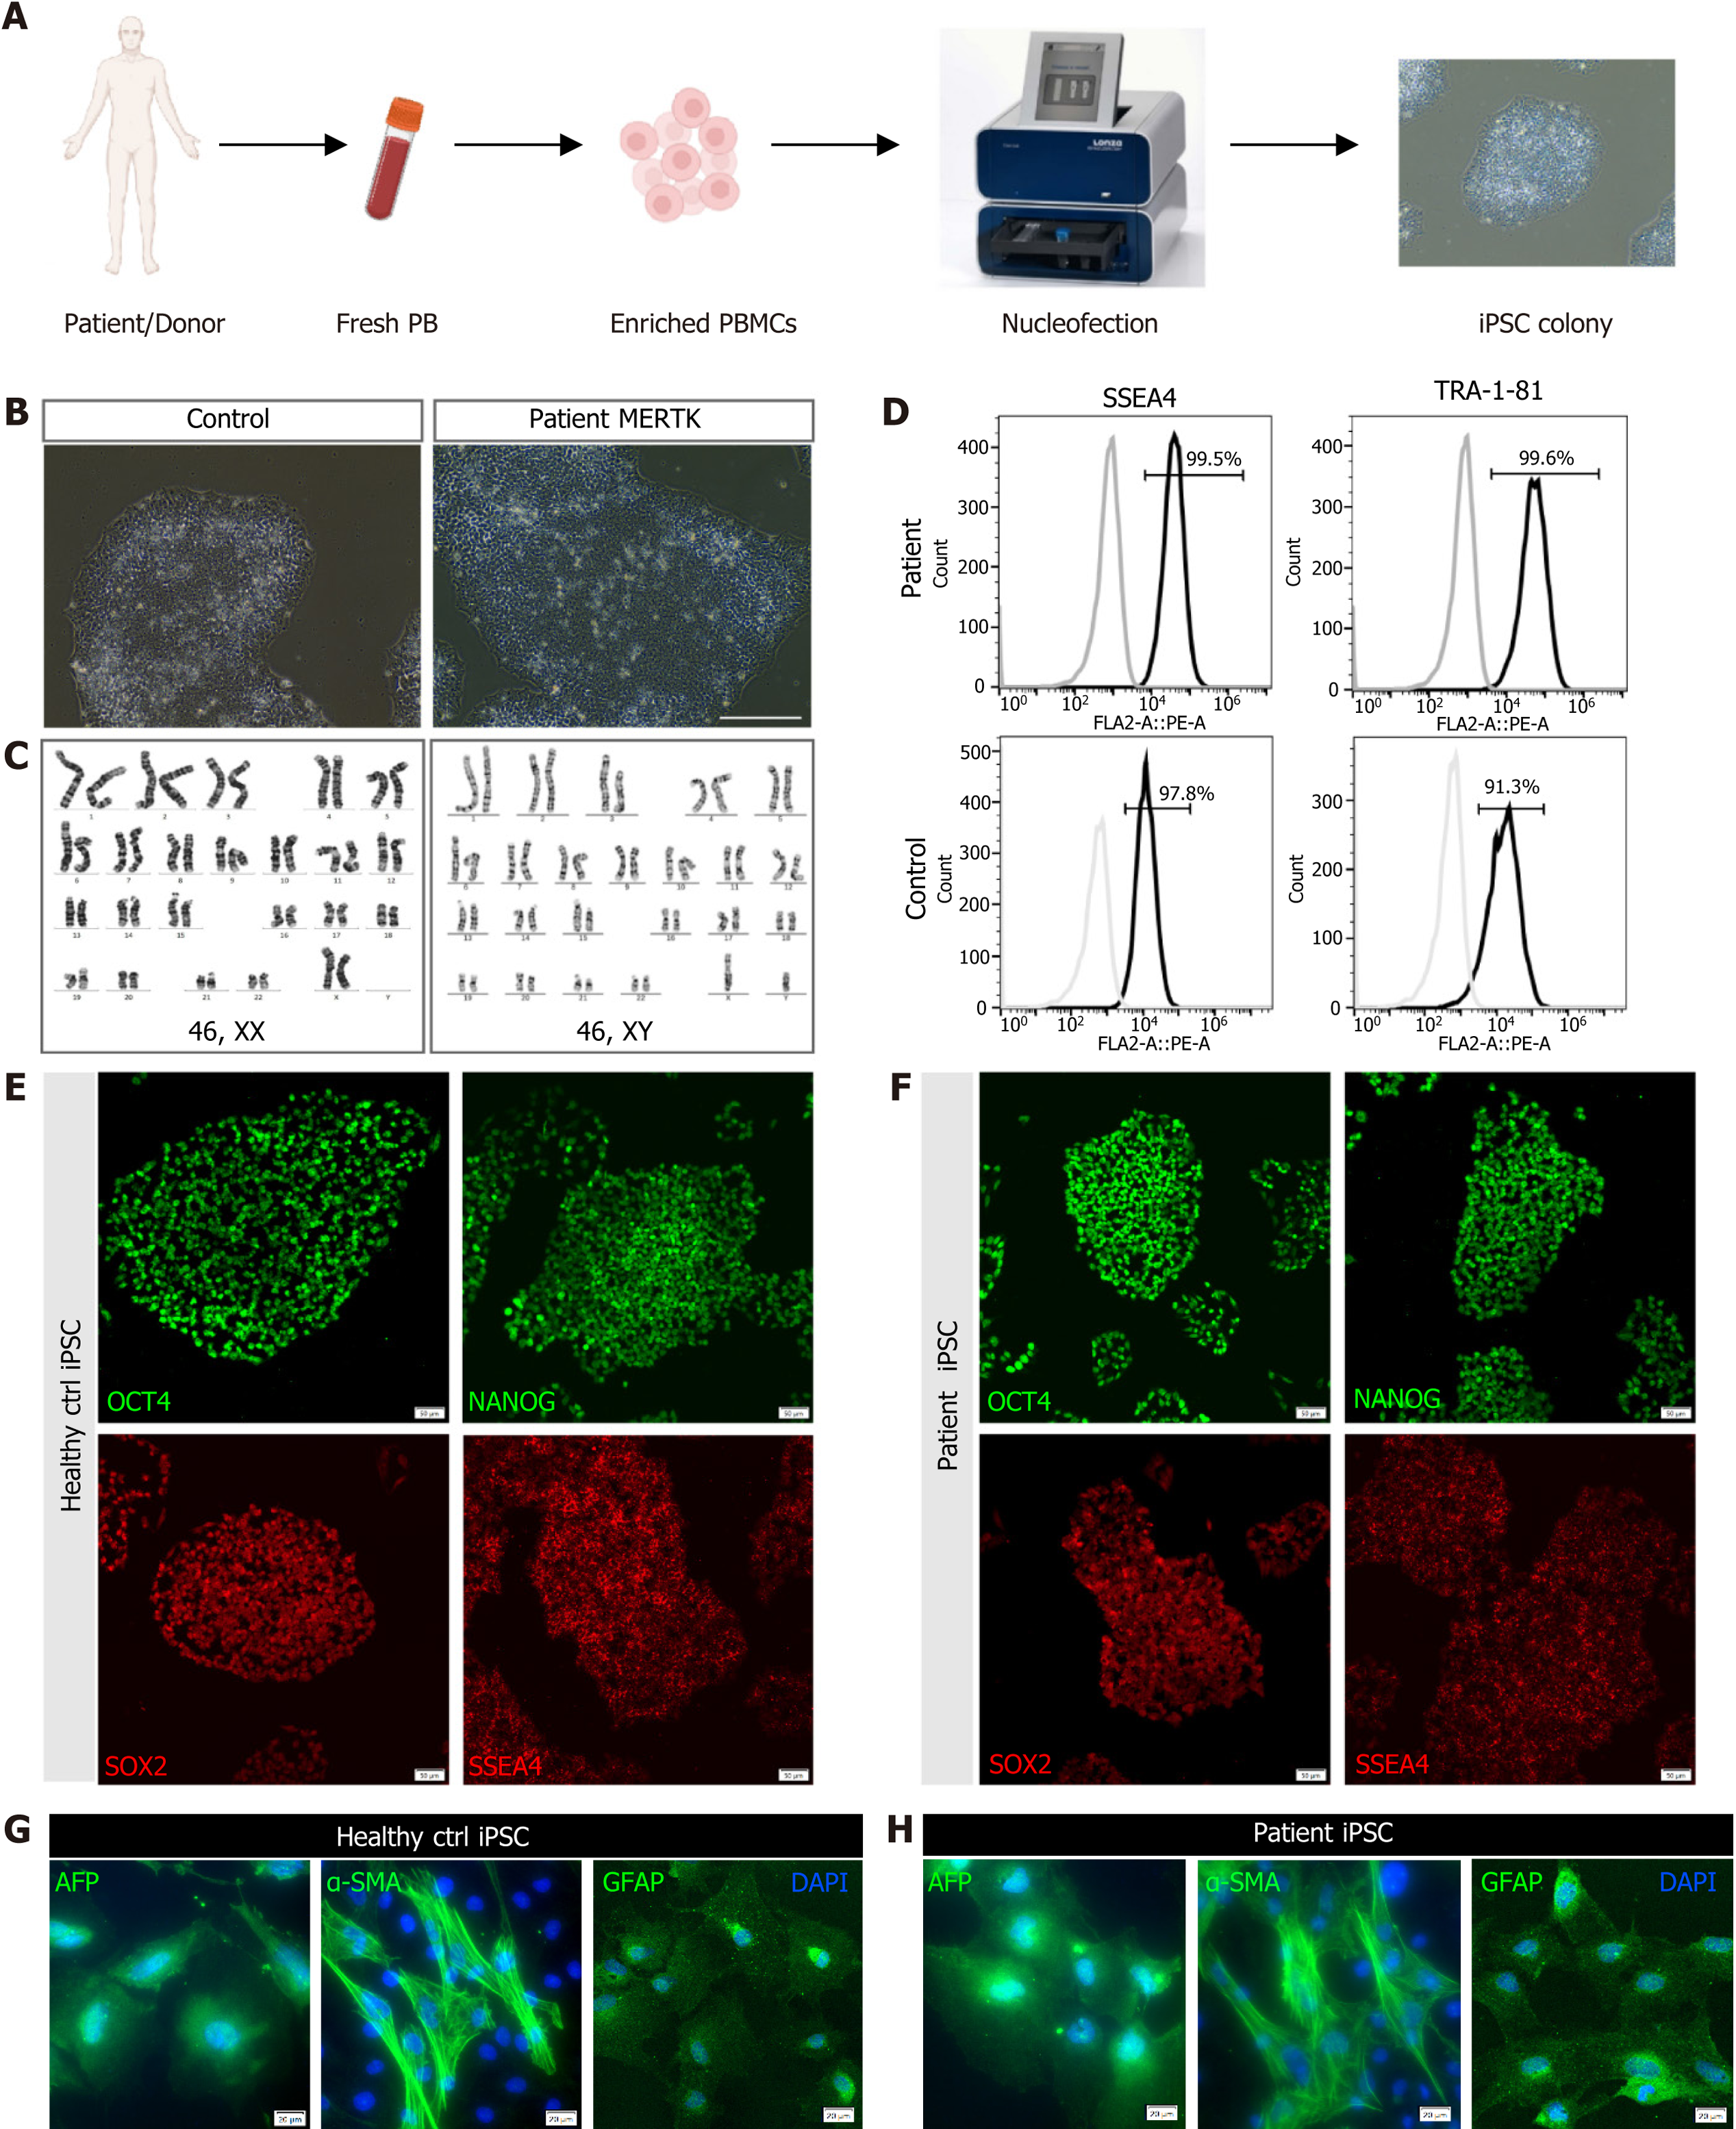
Figure 2 Generation and identification of the human induced pluripotent stem cells derived from the retinitis pigmentosa patient.
A: Timeline of human induced pluripotent stem cell generation; B: Imaging by phase-contrast microscopy. Scale bar = 200 μm; C: Karyotype analysis of the healthy control (left) and retinitis pigmentosa patient (right); D: Flow cytometry of pluripotency markers SSEA-4 and TRA-1-81; E and F: Immunostaining of pluripotency markers OCT4, NANOG, SOX2, and SSEA4 of the healthy control and retinitis pigmentosa patient. Scale bar = 20 μm; G and H: In vitro differentiation of control (G) and patient (H) induced pluripotent stem cells into three germ layers, endoderm (AFP+), mesoderm (α-SMA+) and ectoderm (GFAP+). Scale bar = 20 μm. PB: Peripheral blood; PBMC: Peripheral blood mononuclear cell; iPSC: Induced pluripotent stem cell.
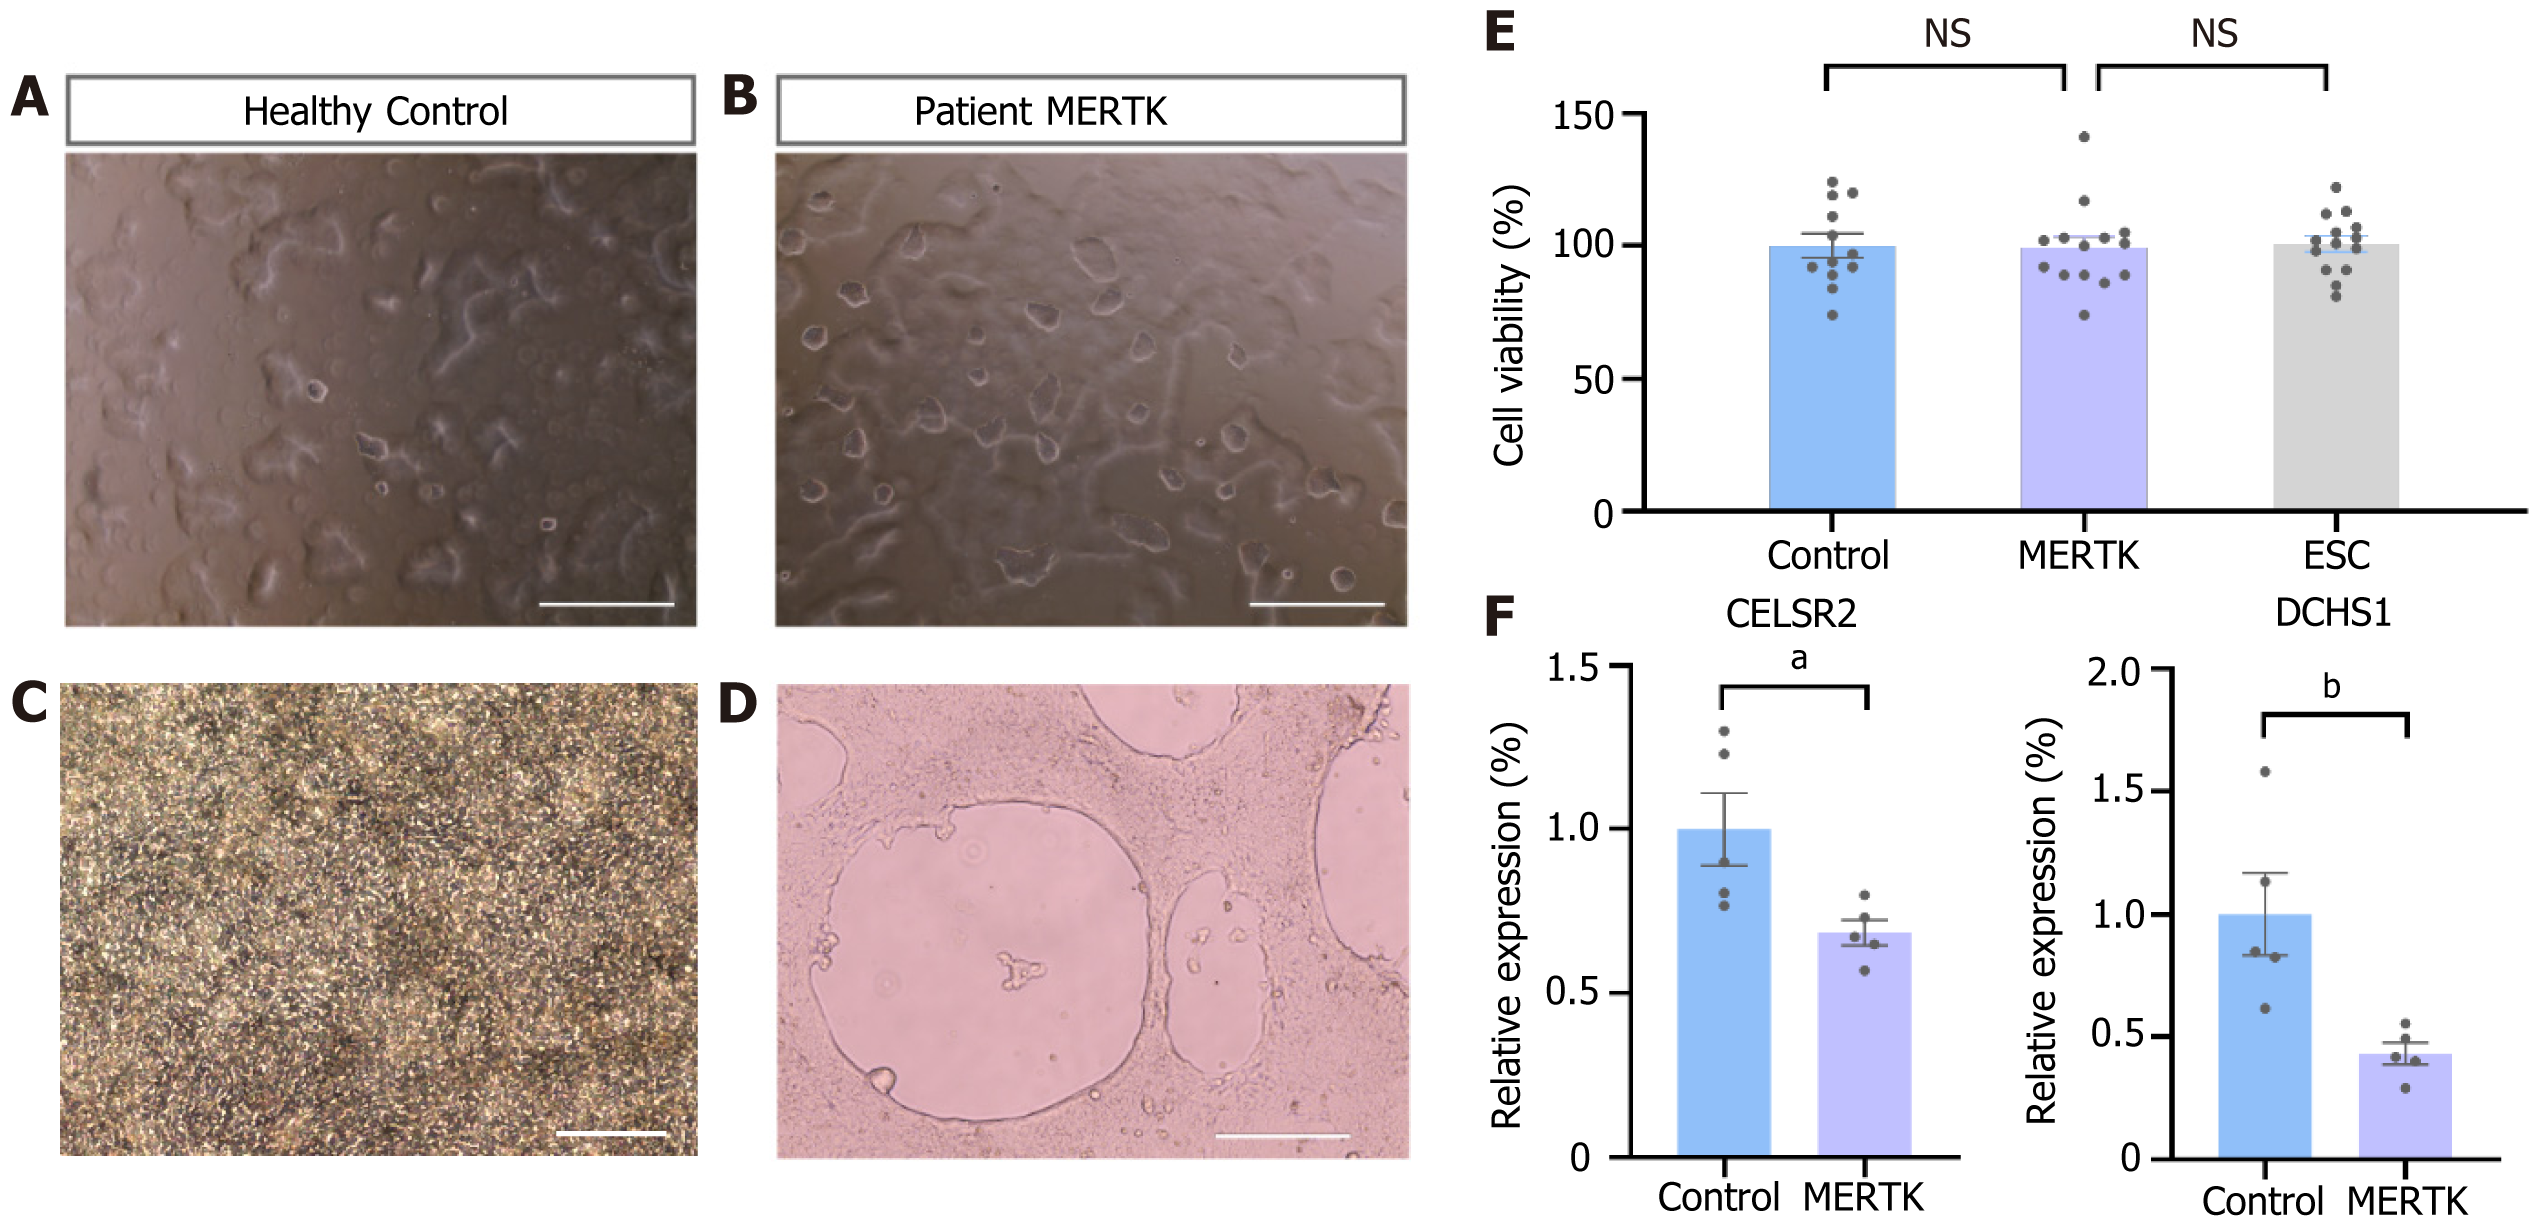
Figure 3 Abnormal adherent capability and aberrant differentiation potential.
A and B: Imaging of clones floating on the surface of the culture medium by phase-contrast microscopy. Scale bar = 1000 μm; C and D: Imaging of cells during epithelial cell differentiation. Scale bar = 200 μm (C), scale bar = 400 μm (D); E: Cell counting kit-8 detection of human induced pluripotent stem cell proliferation ability. mean ± SEM, n = 12-14; F: Quantitative polymerase chain reaction analysis of representative cadherin subfamily members CELSR2 and DCHS1. mean ± SEM, n = 5. Two-tailed t-test. aP < 0.05, bP < 0.05. NS: No significance. ESC: Embryonic stem cell.
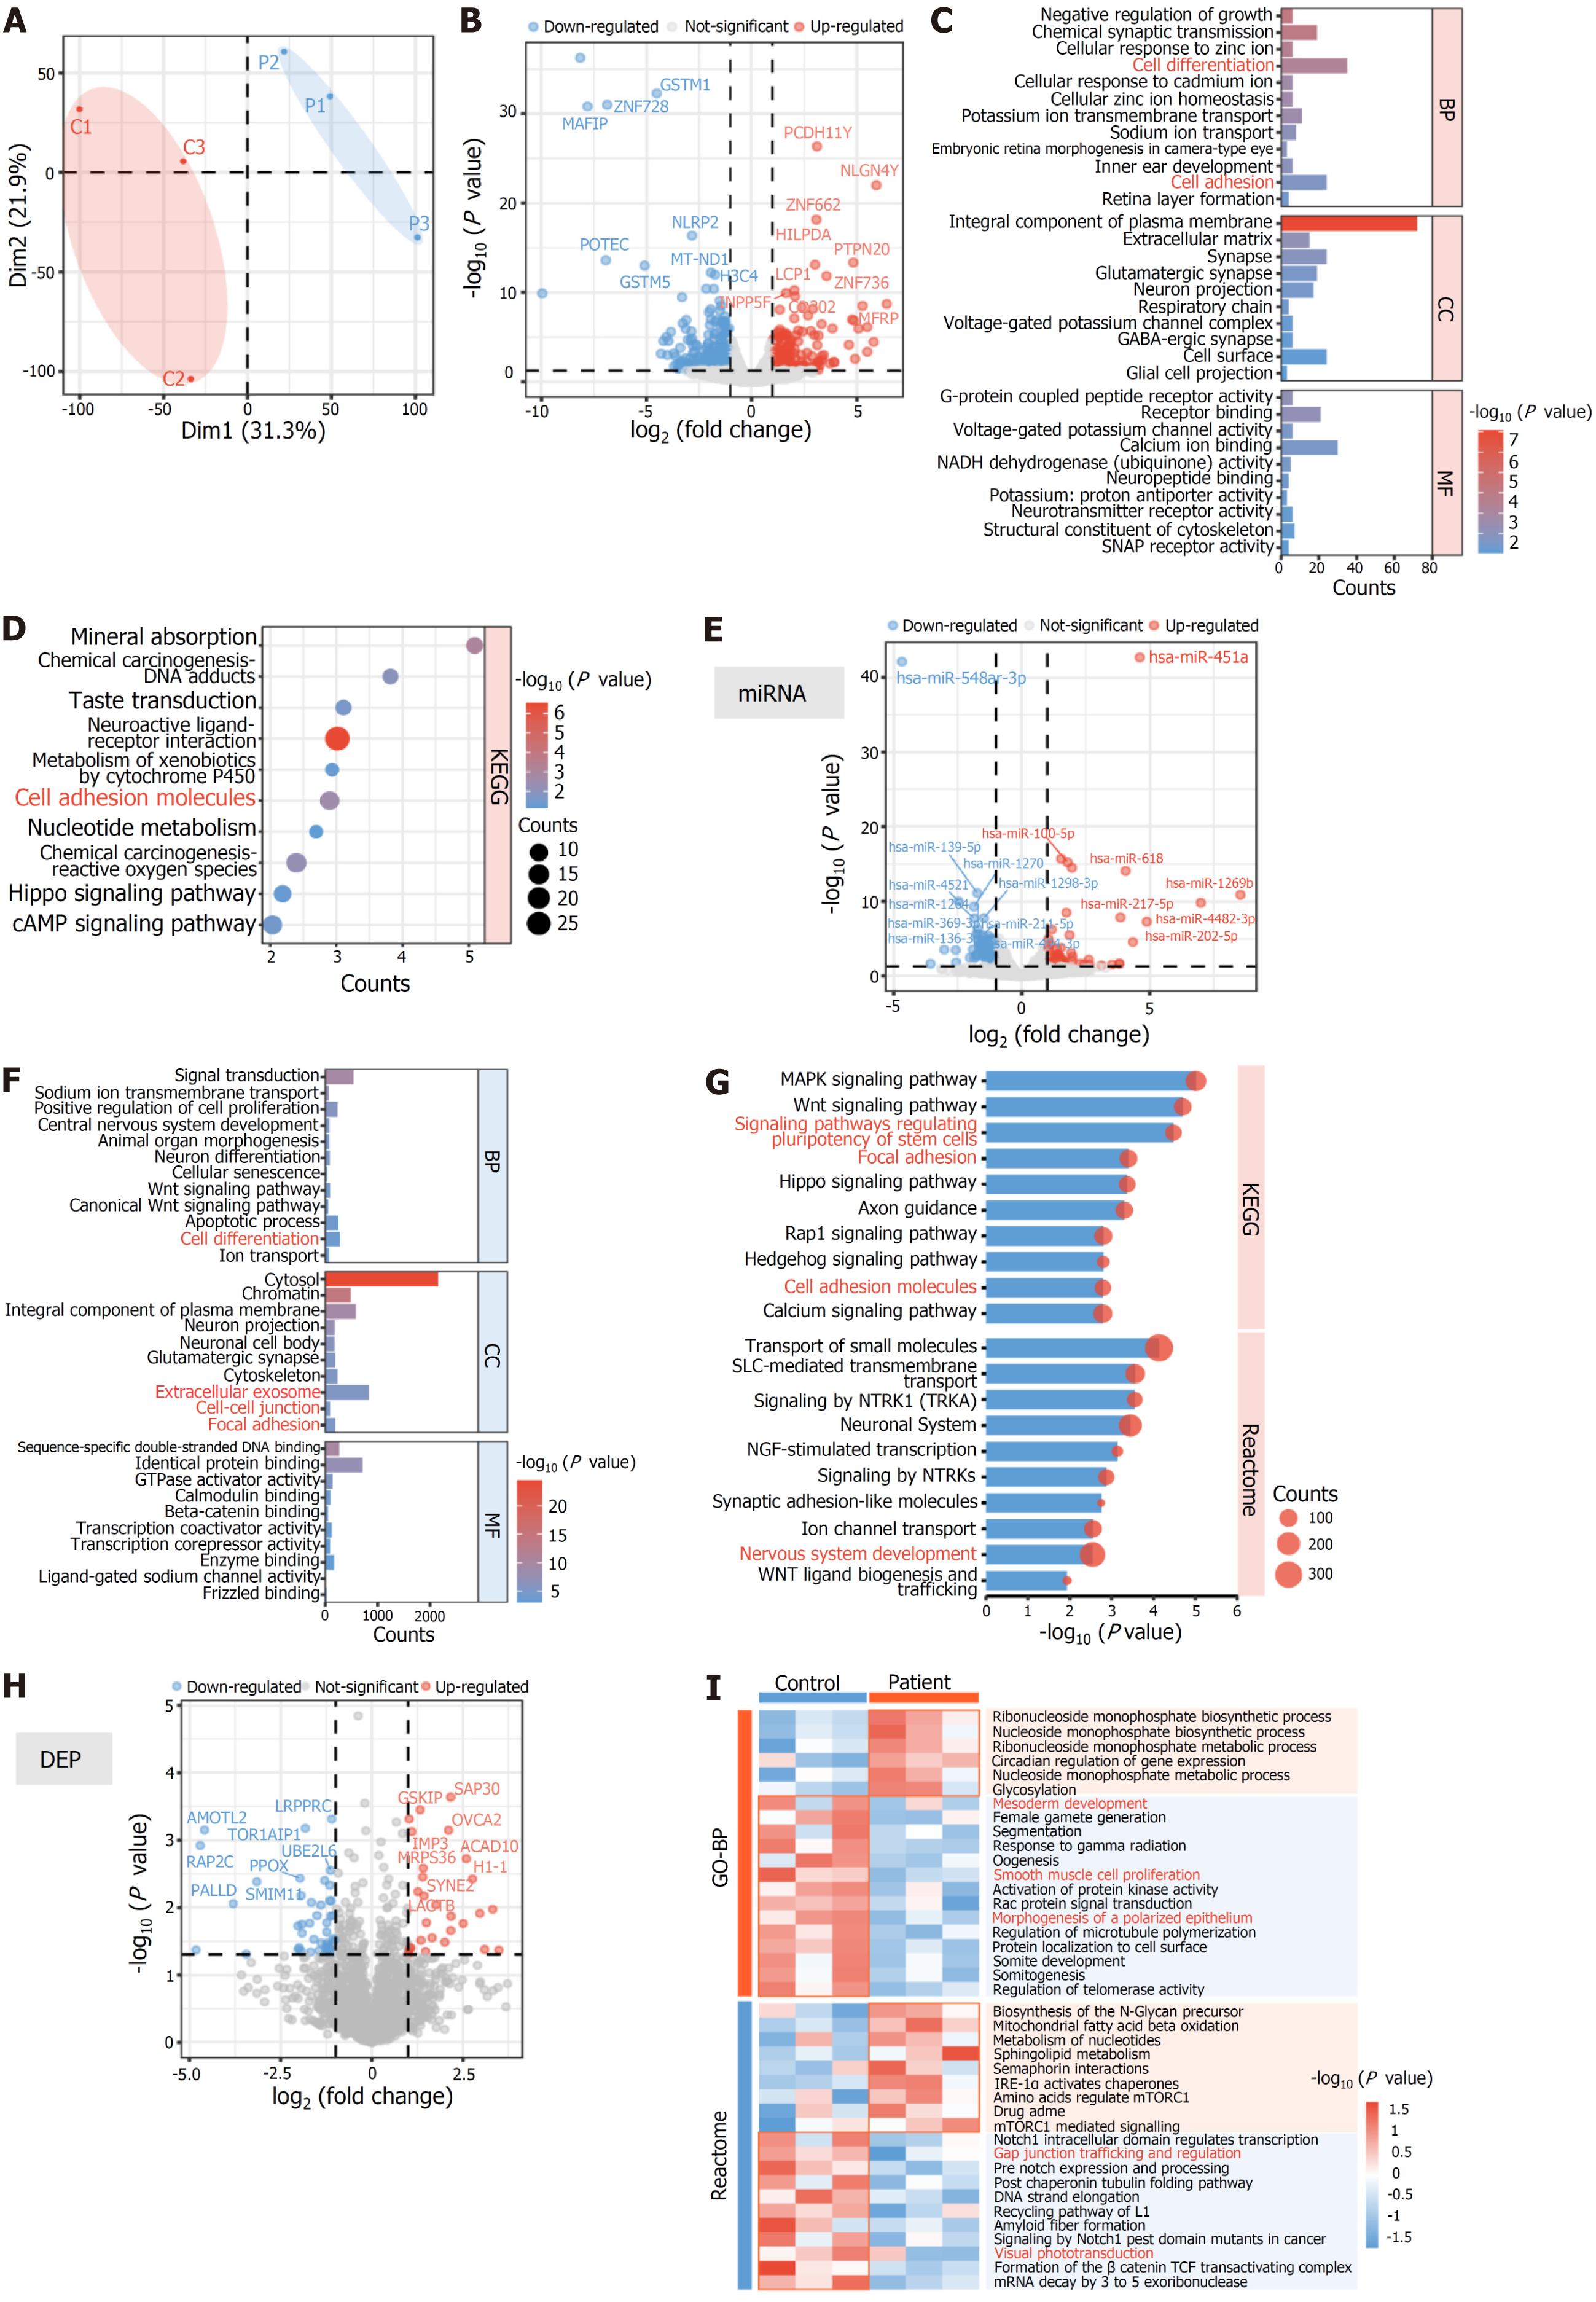
Figure 4 Transcriptomic and proteomic analyses identifying defects of cell adhesion and differentiation in patient-derived human induced pluripotent stem cells.
A: Principal component analysis of mRNA expression; B: Differentially expressed mRNAs between patient human induced pluripotent stem cells (iPSCs) and control iPSCs; C: Gene Ontology (GO) enrichment analysis for differentially expressed genes; D: Kyoto Encyclopedia of Genes and Genomes (KEGG) enrichment analysis for differentially expressed genes; E: Differentially expressed microRNAs (miRNAs) between patient iPSCs and control iPSCs; F: GO enrichment analysis for differentially expressed miRNA target genes; G: KEGG and Reactome enrichment analyses for differentially expressed miRNA target genes; H: Differentially expressed proteins between patient iPSCs and control iPSCs; I: GO and Reactome enrichment analyses for differentially expressed proteins. GO: Gene Ontology; KEGG: Kyoto Encyclopedia of Genes and Genomes; BP: Biological progress; CC: Cellular component; MF: Molecular function; miRNA: MicroRNA; DEP: Differentially expressed protein.
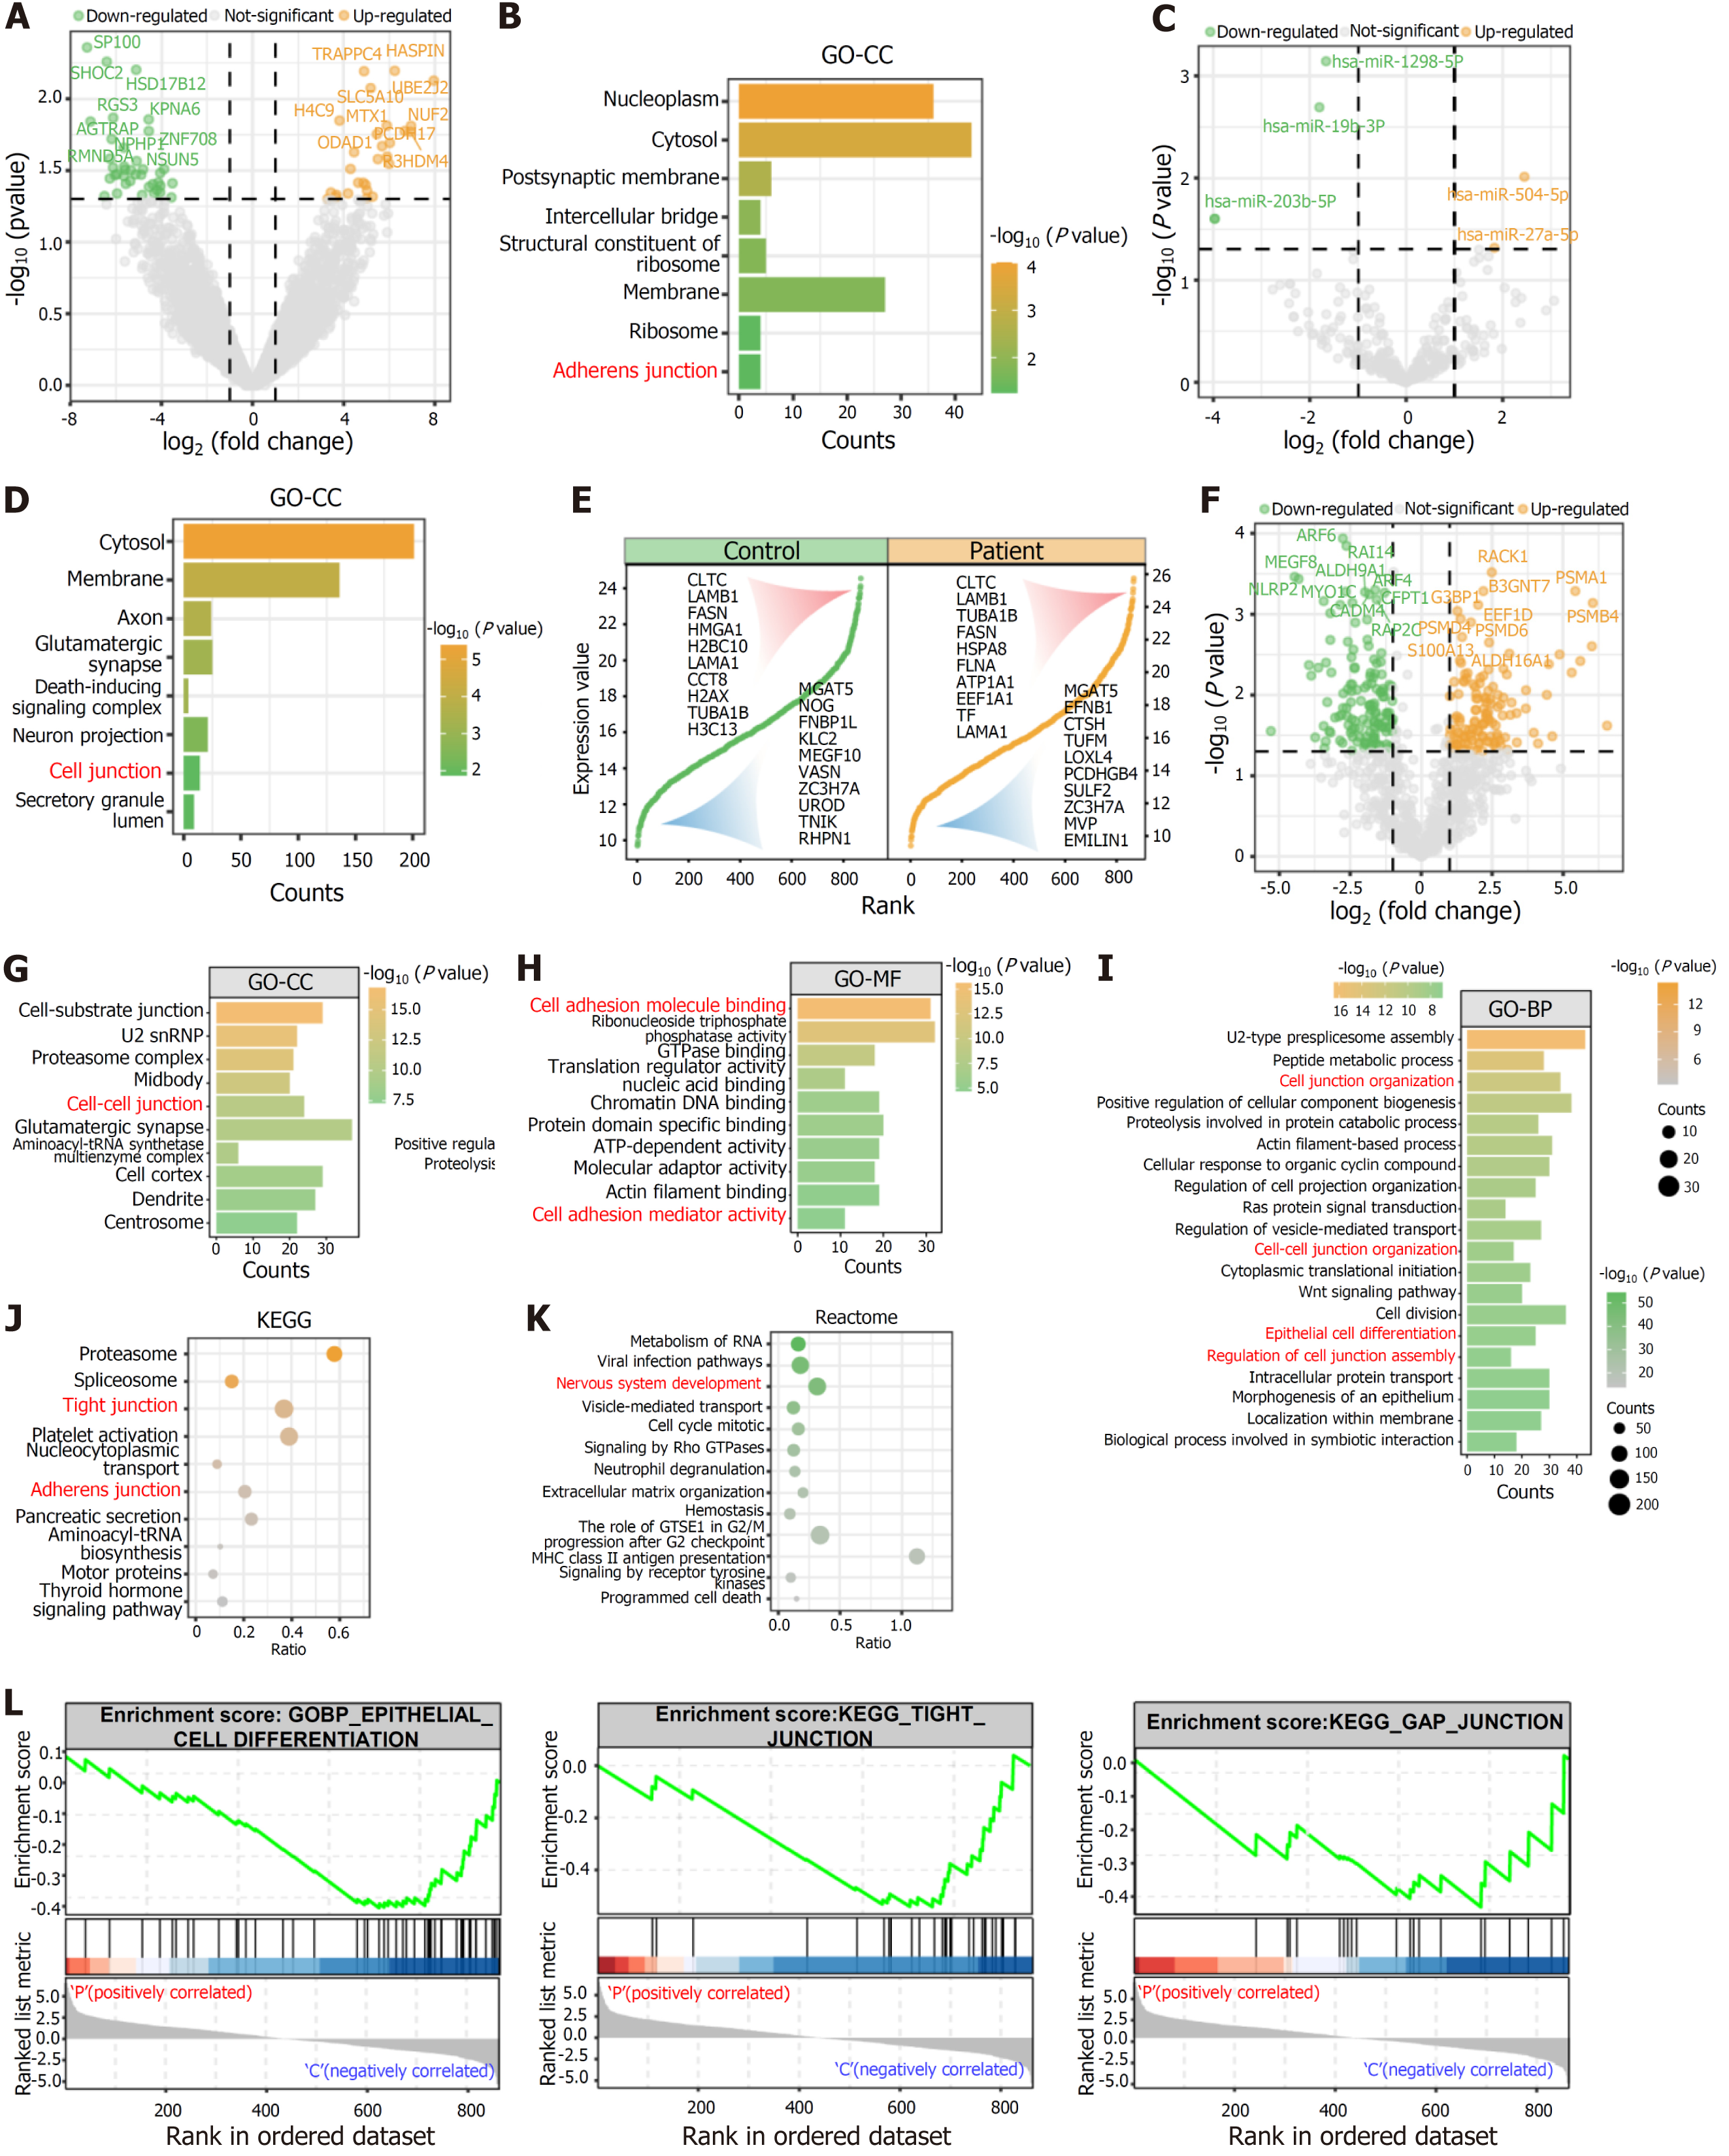
Figure 5 Transcriptomic and proteomic analyses indicating that human induced pluripotent stem cell-derived extracellular vesicles play a crucial role in regulating cell adhesion and differentiation.
A: Differentially expressed mRNAs between patient human induced pluripotent stem cell (iPSC)-derived extracellular vesicles (EVs) and control iPSC-derived EVs; B: Gene Ontology (GO)-cellular component enrichment analysis of differentially expressed mRNAs; C: Differentially expressed microRNA between patient iPSC-derived EVs and control iPSC-derived EVs; D: GO-cellular component enrichment analysis of differentially expressed microRNA target genes; E: Abundance of proteins from patient iPSC-derived EVs and control iPSC-derived EVs. The abscissa represents the protein number, and the ordinate represents the normalized protein expression score. The top 10 and bottom 10 expressed proteins are displayed; F: Differentially expressed proteins between patient iPSC-derived EVs and control iPSC-derived EVs; G-I: GO enrichment analysis for differentially expressed proteins; J and K: Kyoto Encyclopedia of Genes and Genomes and Reactome enrichment analyses for differentially expressed proteins; L: Gene set enrichment analysis of patient iPSC-derived EVs and control iPSC-derived EVs. GO: Gene Ontology; KEGG: Kyoto Encyclopedia of Genes and Genomes; BP: Biological progress; CC: Cellular component; MF: Molecular function.
- Citation: Zhang H, Wu LZ, Liu ZY, Jin ZB. Patient-derived induced pluripotent stem cells with a MERTK mutation exhibit cell junction abnormalities and aberrant cellular differentiation potential. World J Stem Cells 2024; 16(5): 512-524
- URL: https://www.wjgnet.com/1948-0210/full/v16/i5/512.htm
- DOI: https://dx.doi.org/10.4252/wjsc.v16.i5.512


