Copyright
©The Author(s) 2021.
World J Stem Cells. Nov 26, 2021; 13(11): 1762-1782
Published online Nov 26, 2021. doi: 10.4252/wjsc.v13.i11.1762
Published online Nov 26, 2021. doi: 10.4252/wjsc.v13.i11.1762
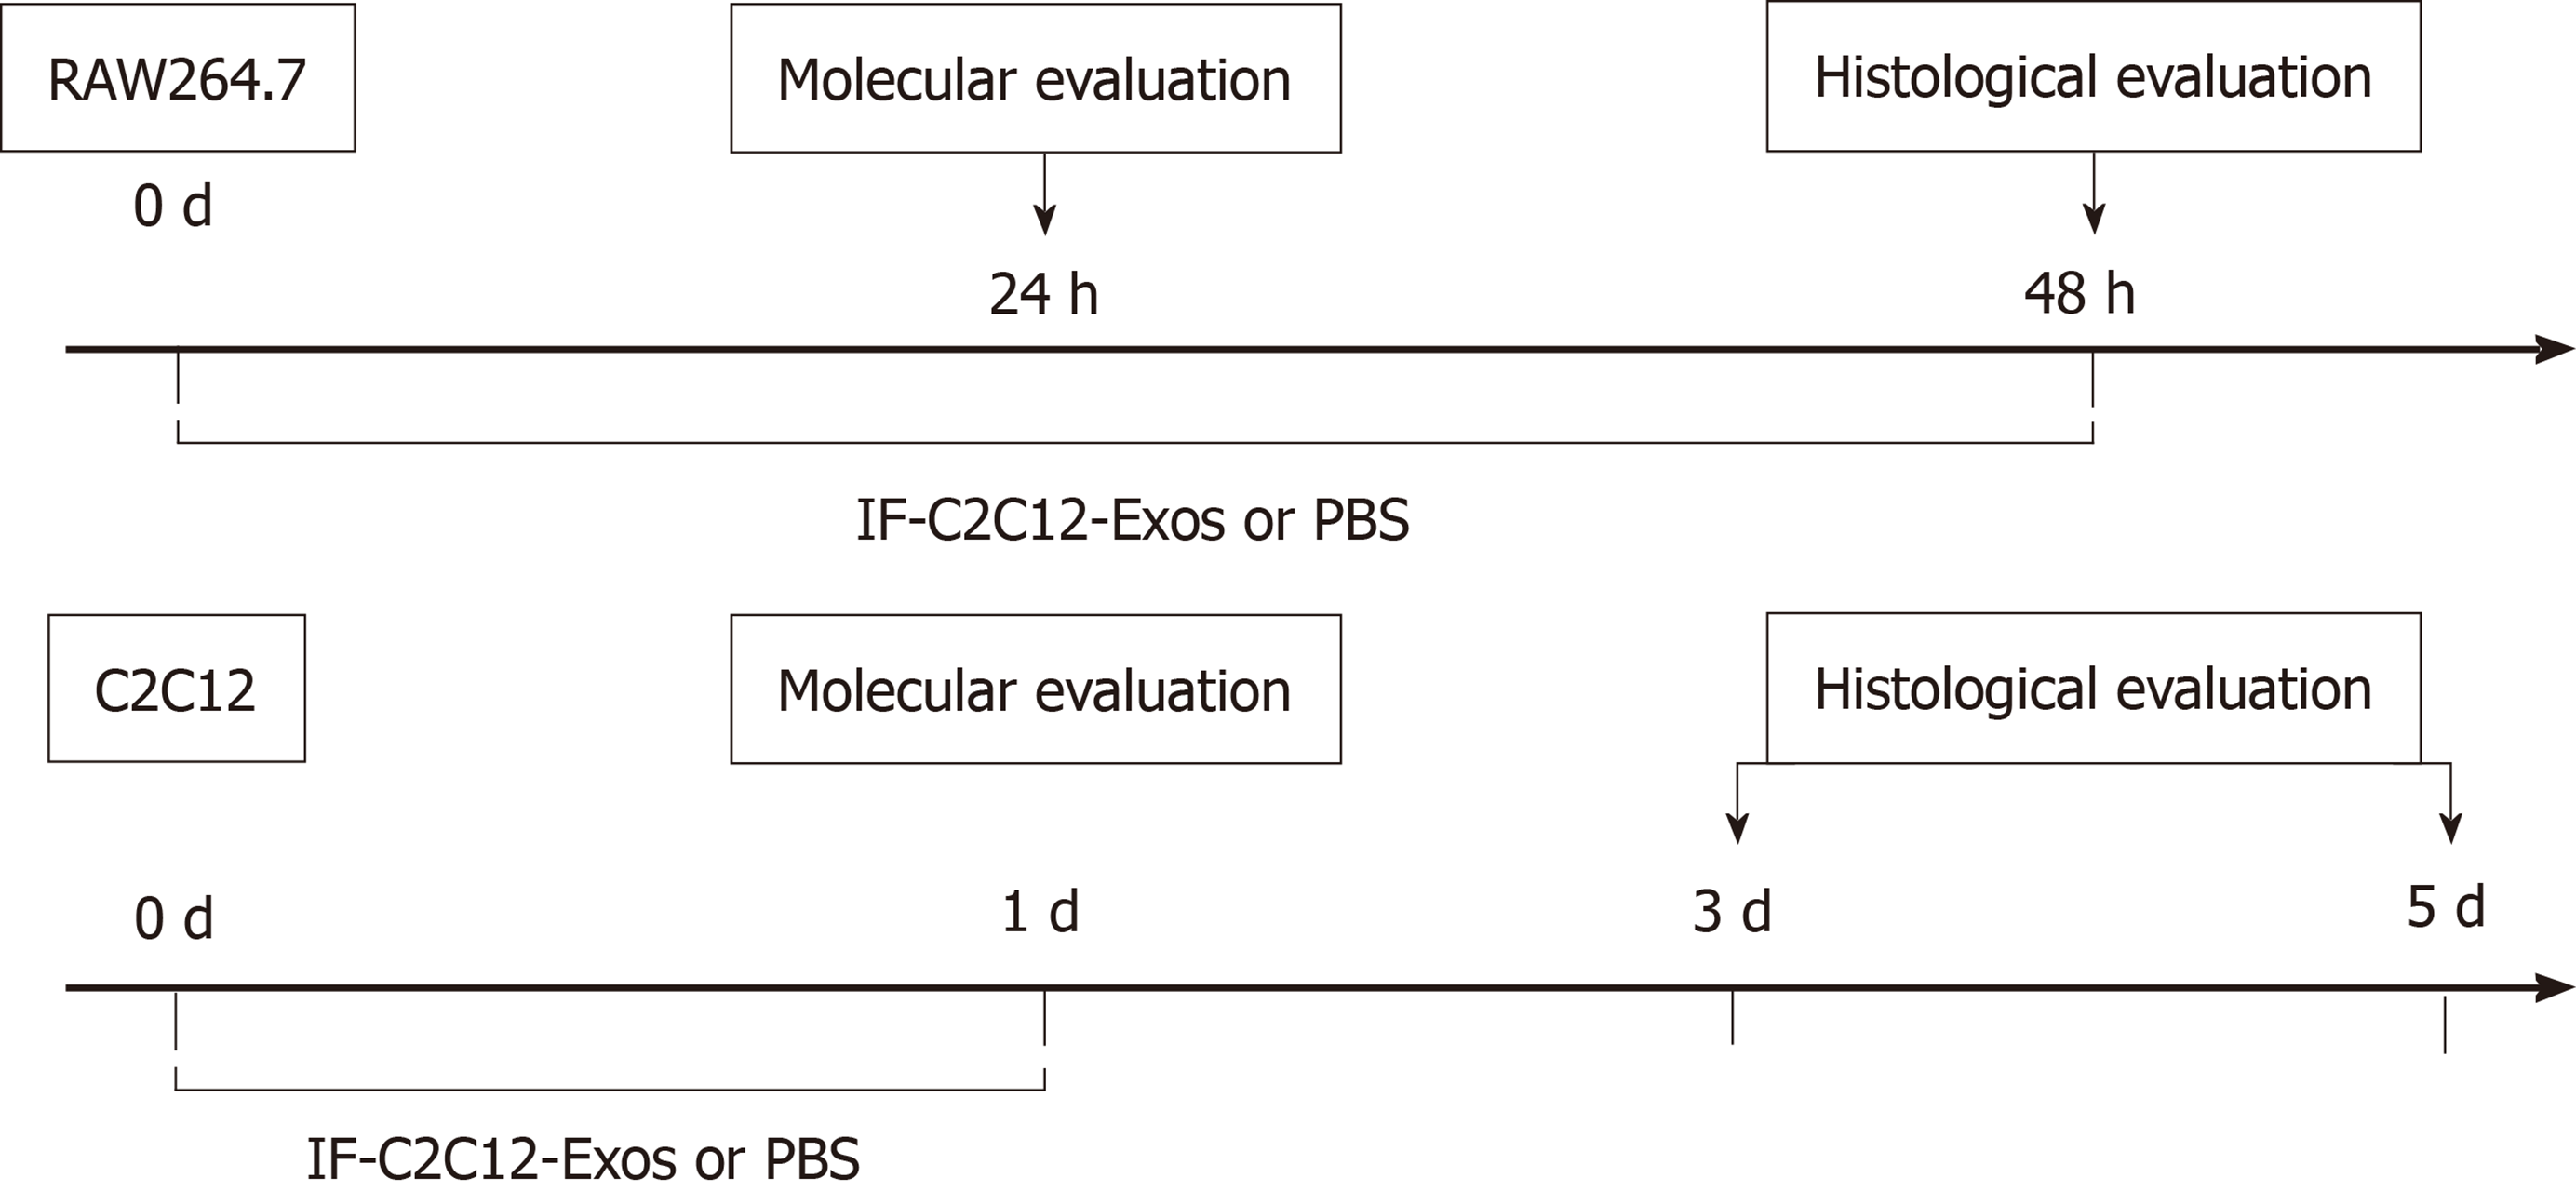
Figure 1 Experimental design for both the in vitro and in vivo studies.
IF-C2C12-Exos, Myoblast-derived exosomes within the inflammatory environment; Molecular evaluation included Western Blot, ELISA, immunofluorescence, and flow cytometry. Histological evaluation included immunofluorescence and electron microscopy. PBS: Phosphate-buffered saline.
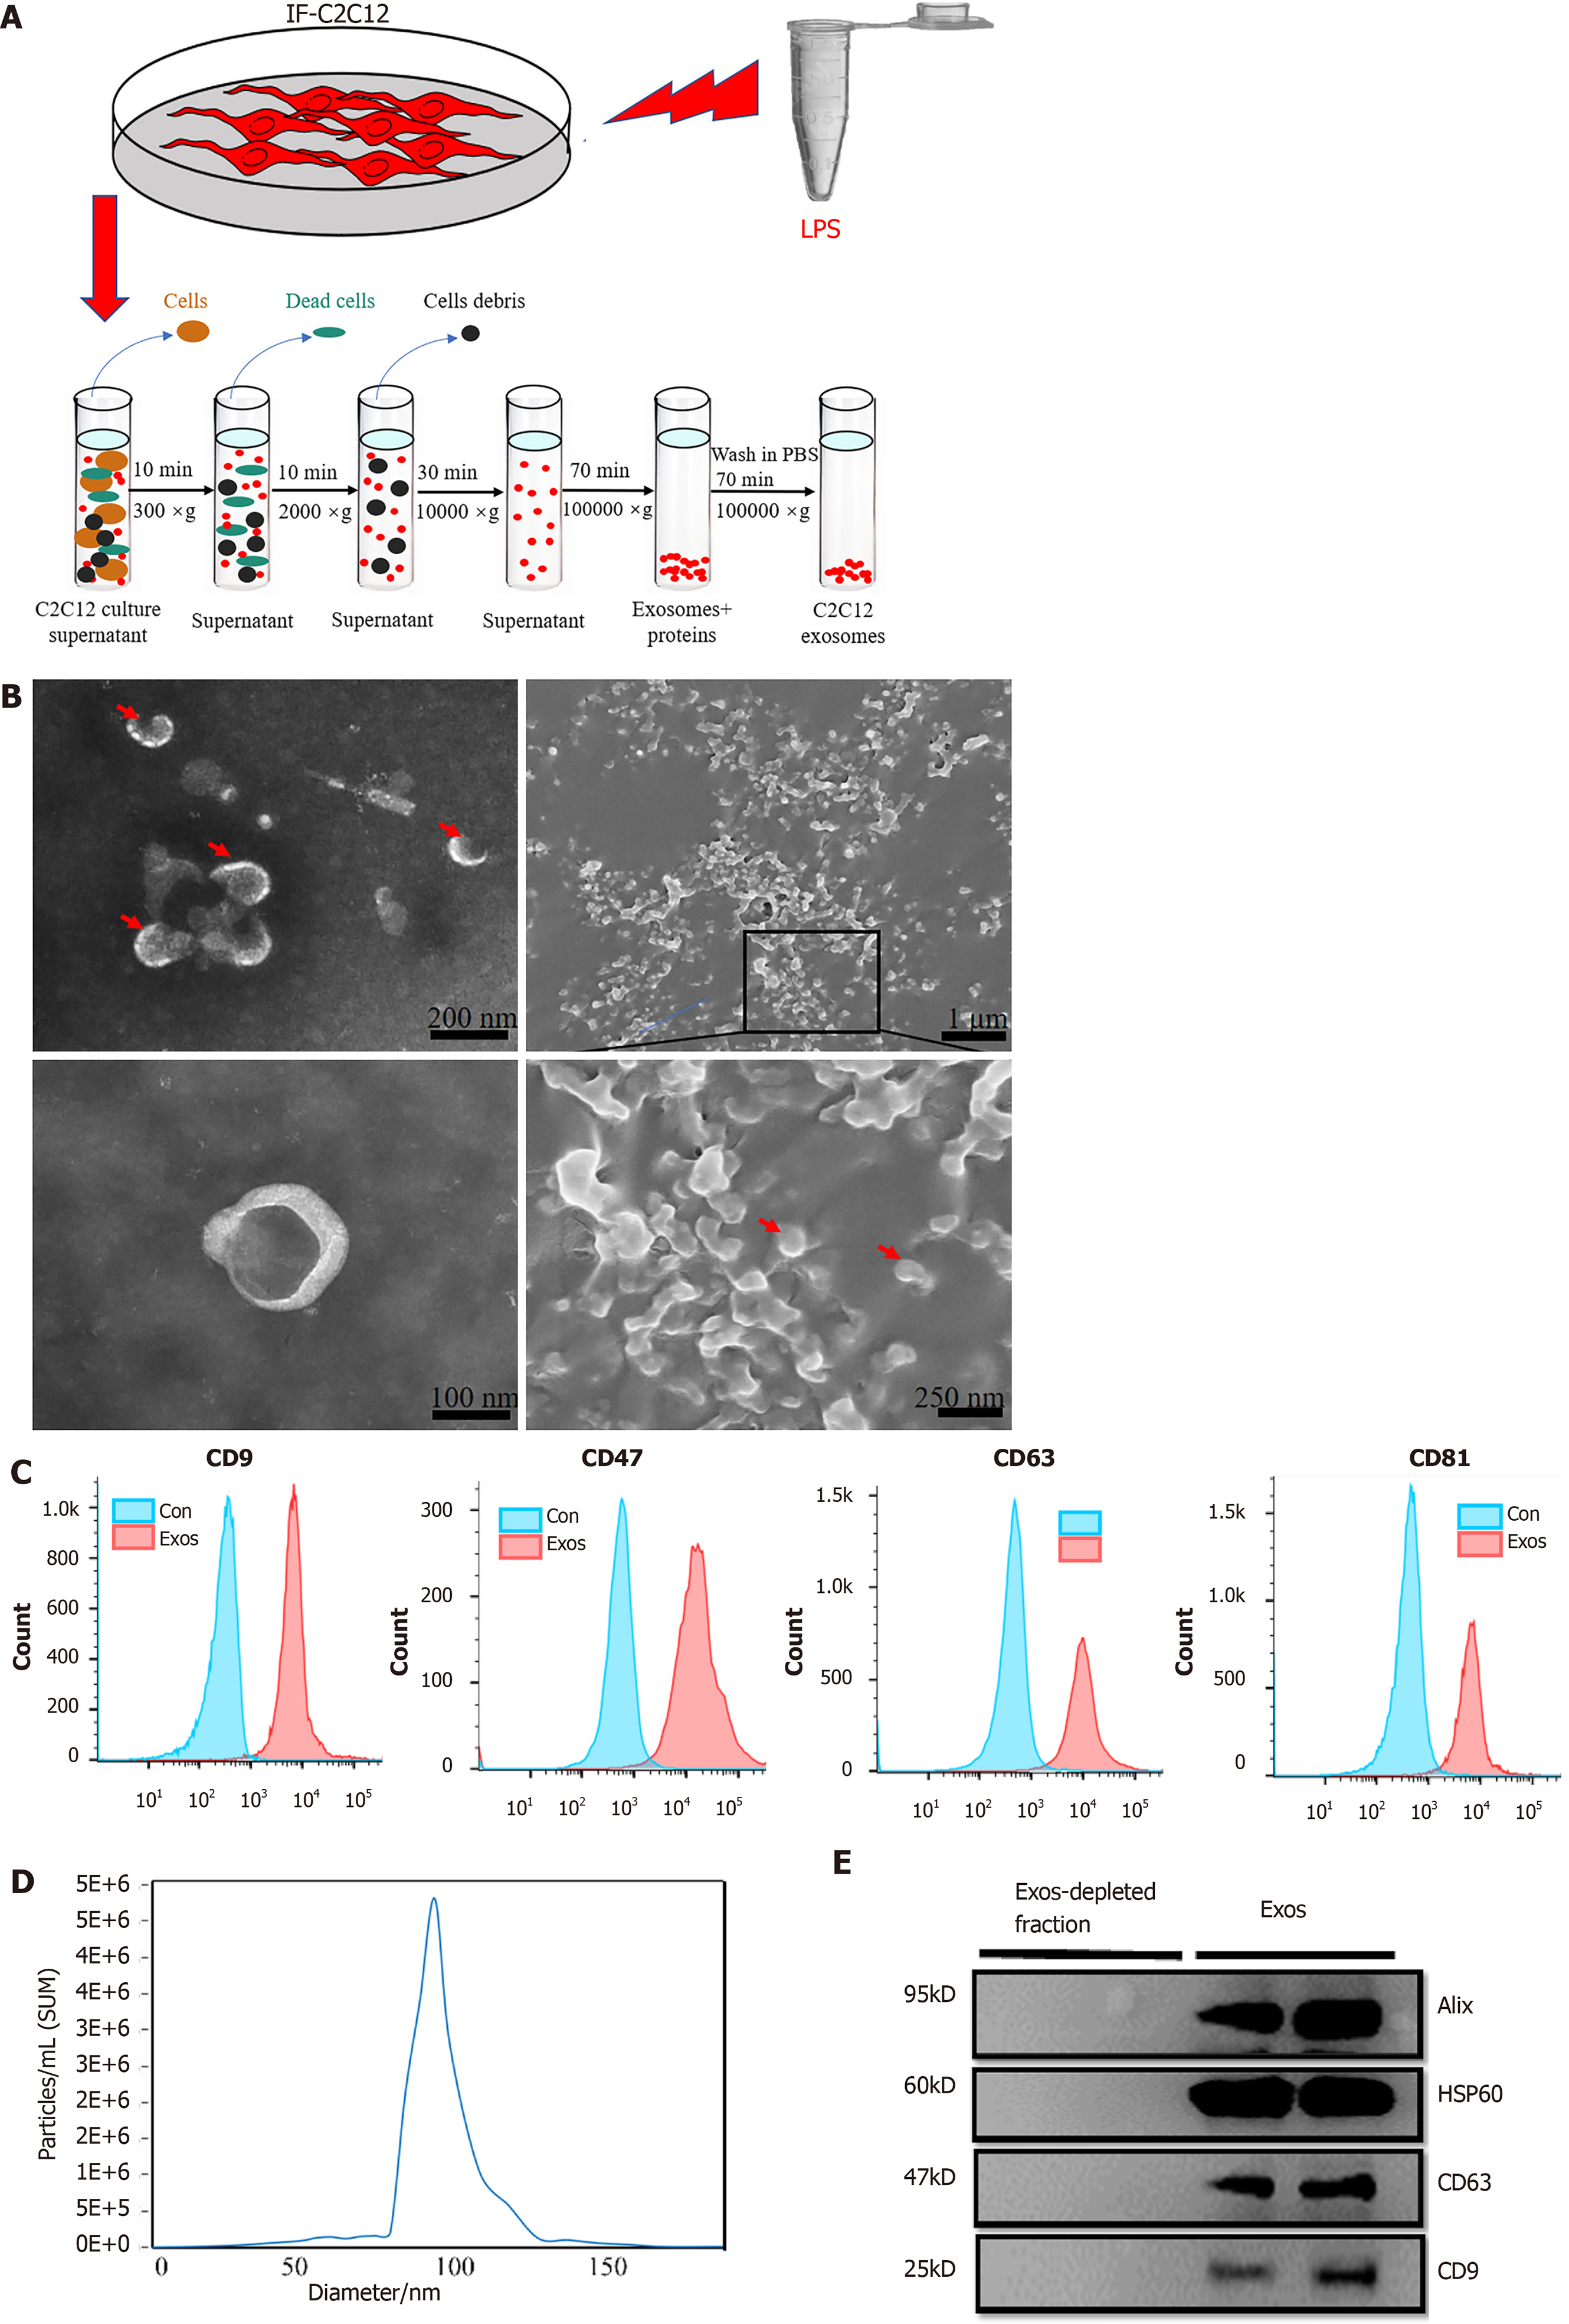
Figure 2 Purification, isolation, and characterization of C2C12-Exos.
A: Flowchart of C2C12-Exos purification based on differential ultra-centrifugation. Lipopolysaccharide, 1000 ng/mL for 1 d; B: The morphology of C2C12-Exos was observed by transmission electron microscopy (left) and scanning electron microscopy (right). The red arrows indicate representative exosomes; C: Representative flow cytometry plots showing the phenotypes of exosome markers, including CD9, CD47, CD63, and CD81; D: The particle size distribution of C2C12-Exos was analyzed by the qNano platform; E: Western blotting showed the presence of exosomal markers, including CD63, HSP60, Alix, and CD9. The four lanes represent different exosomal proteins and deproteinized supernatants extracted from the two independent conditioned media. LPS: Lipopolysaccharide.
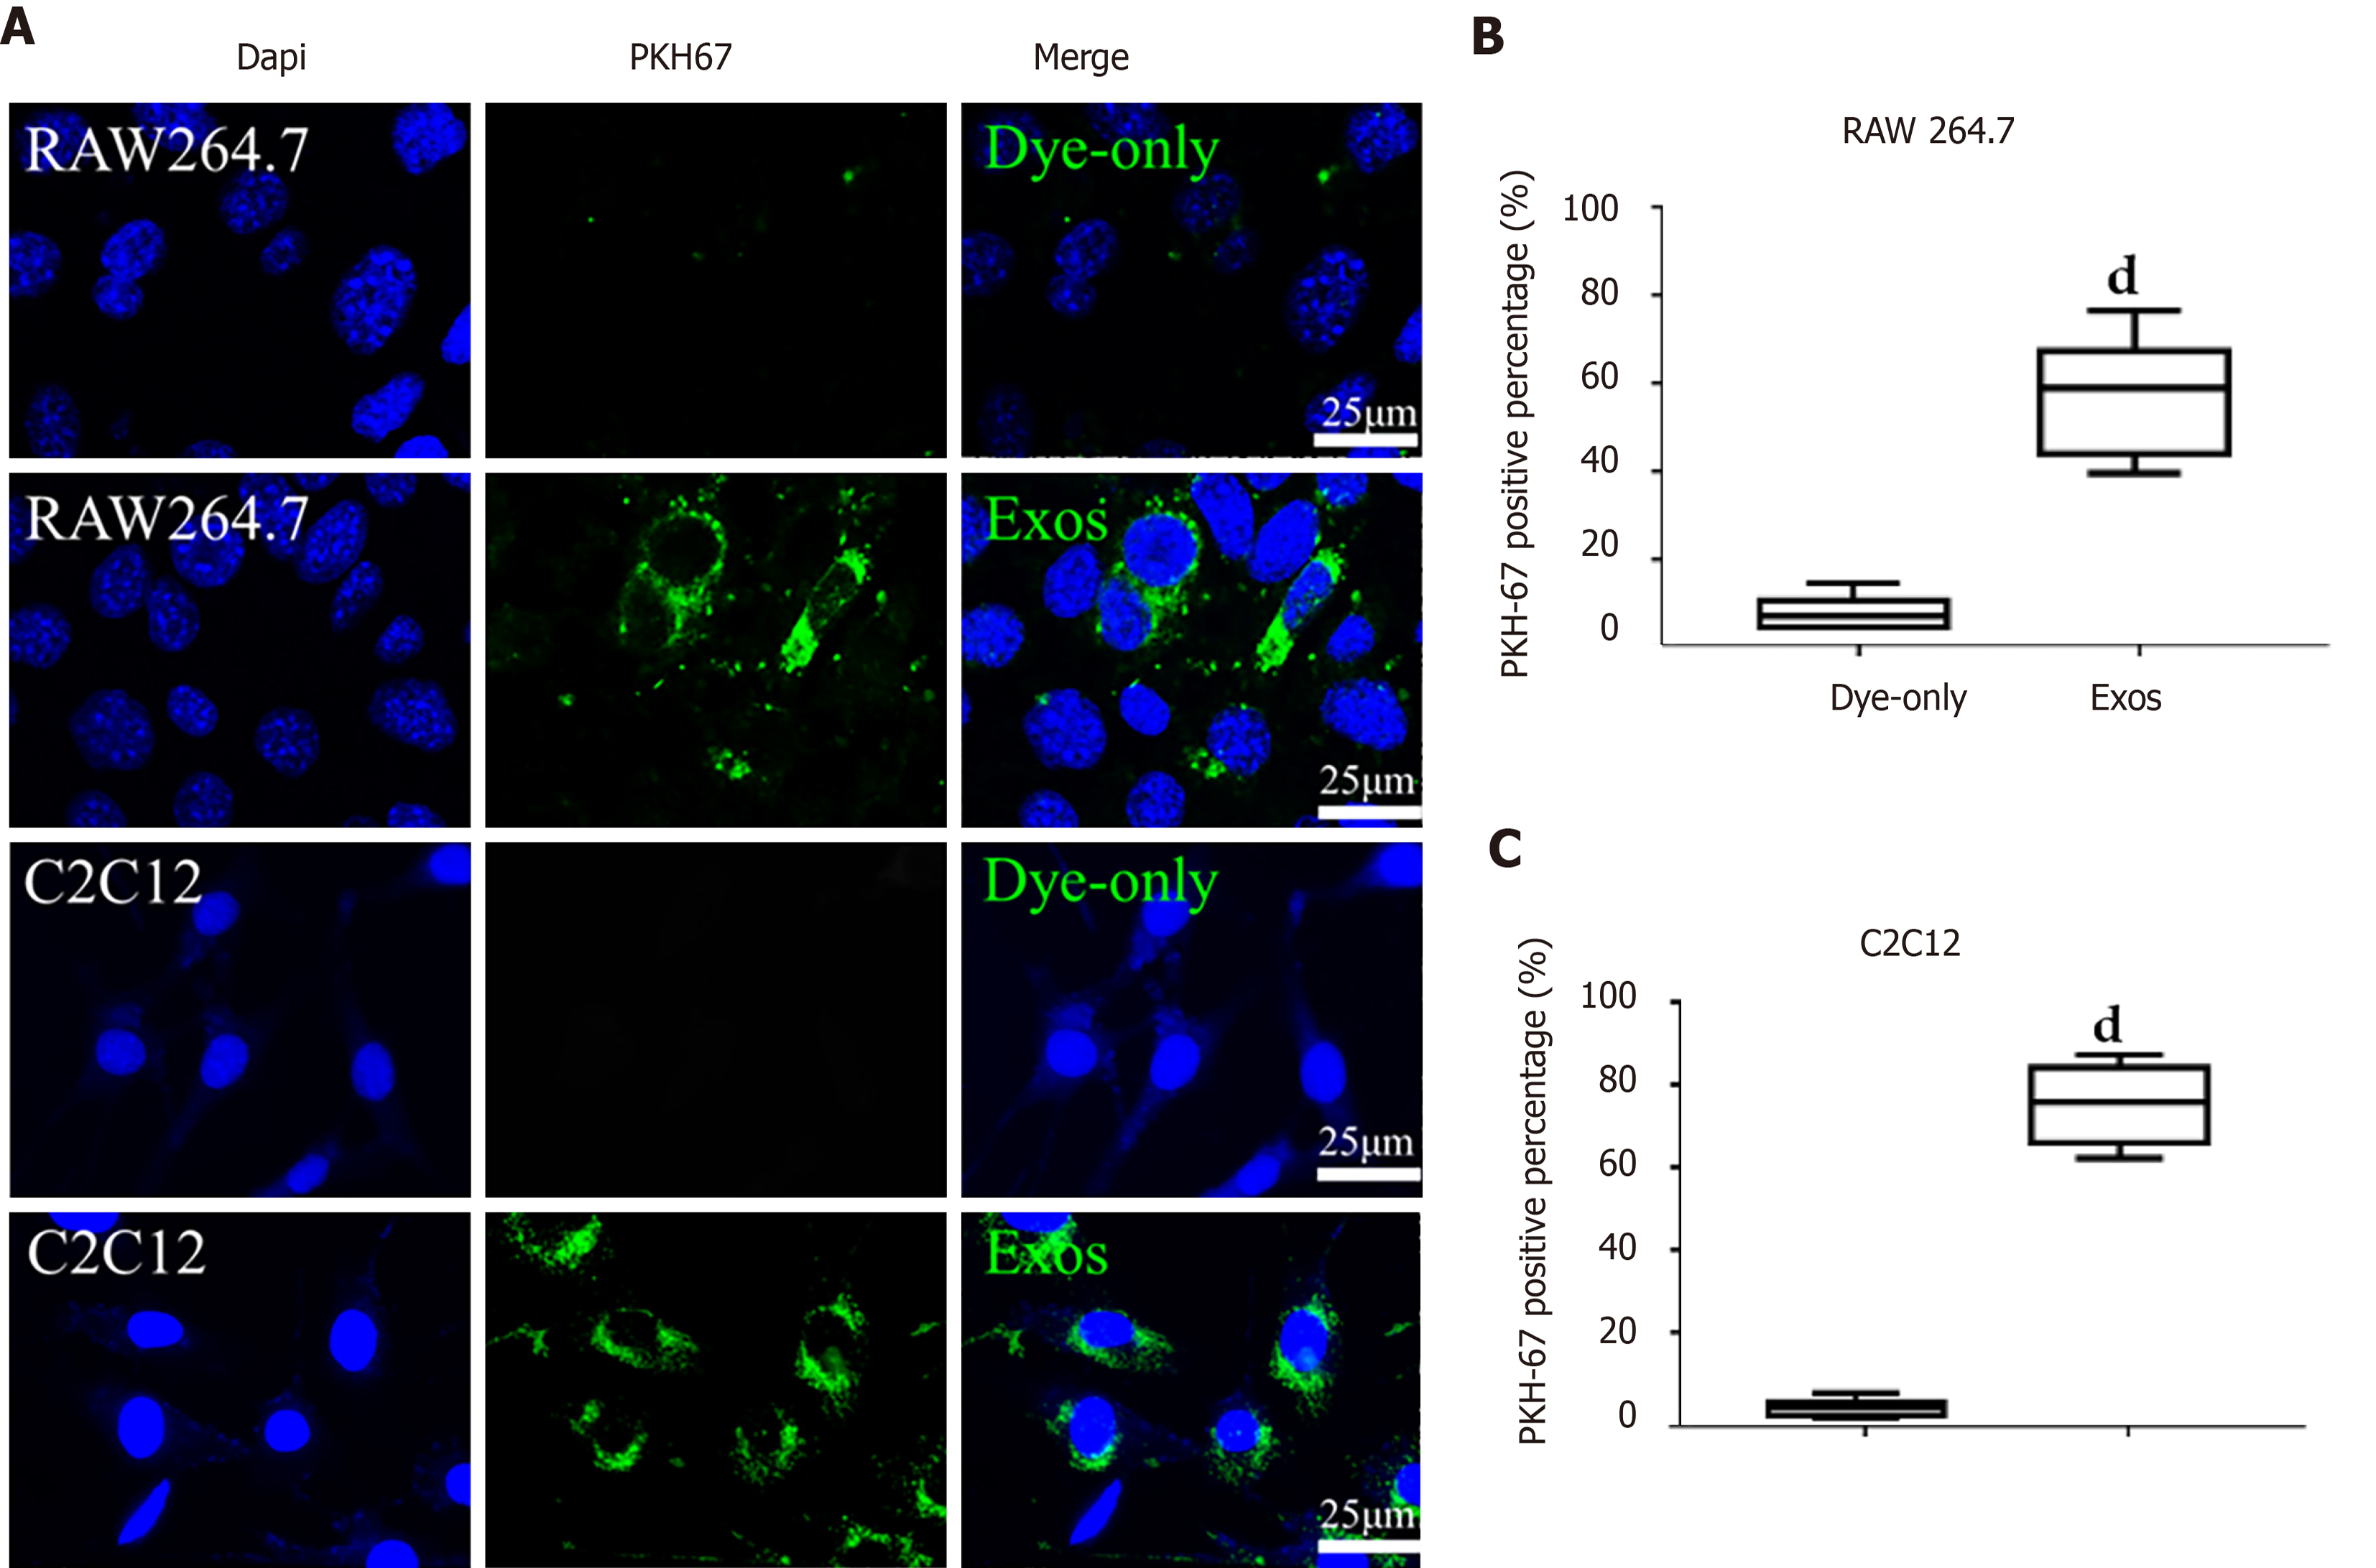
Figure 3 C2C12-Exos were taken up by C2C12 and RAW264.
7 cells in vitro. A: Representative images of the uptake of PKH67-labeled exosomes (green) by RAW264.7 cells or C2C12 cells (DAPI blue) and fluorescence uptake by negative control samples. Dye-only, only PKH67 incubated with RAW264.7 cells and C2C12 cells; scale bar = 25 μm; B and C: The percentage of PKH67 positive cells in RAW264.7 or C2C12 is presented. dP < 0.0001, n = 6.
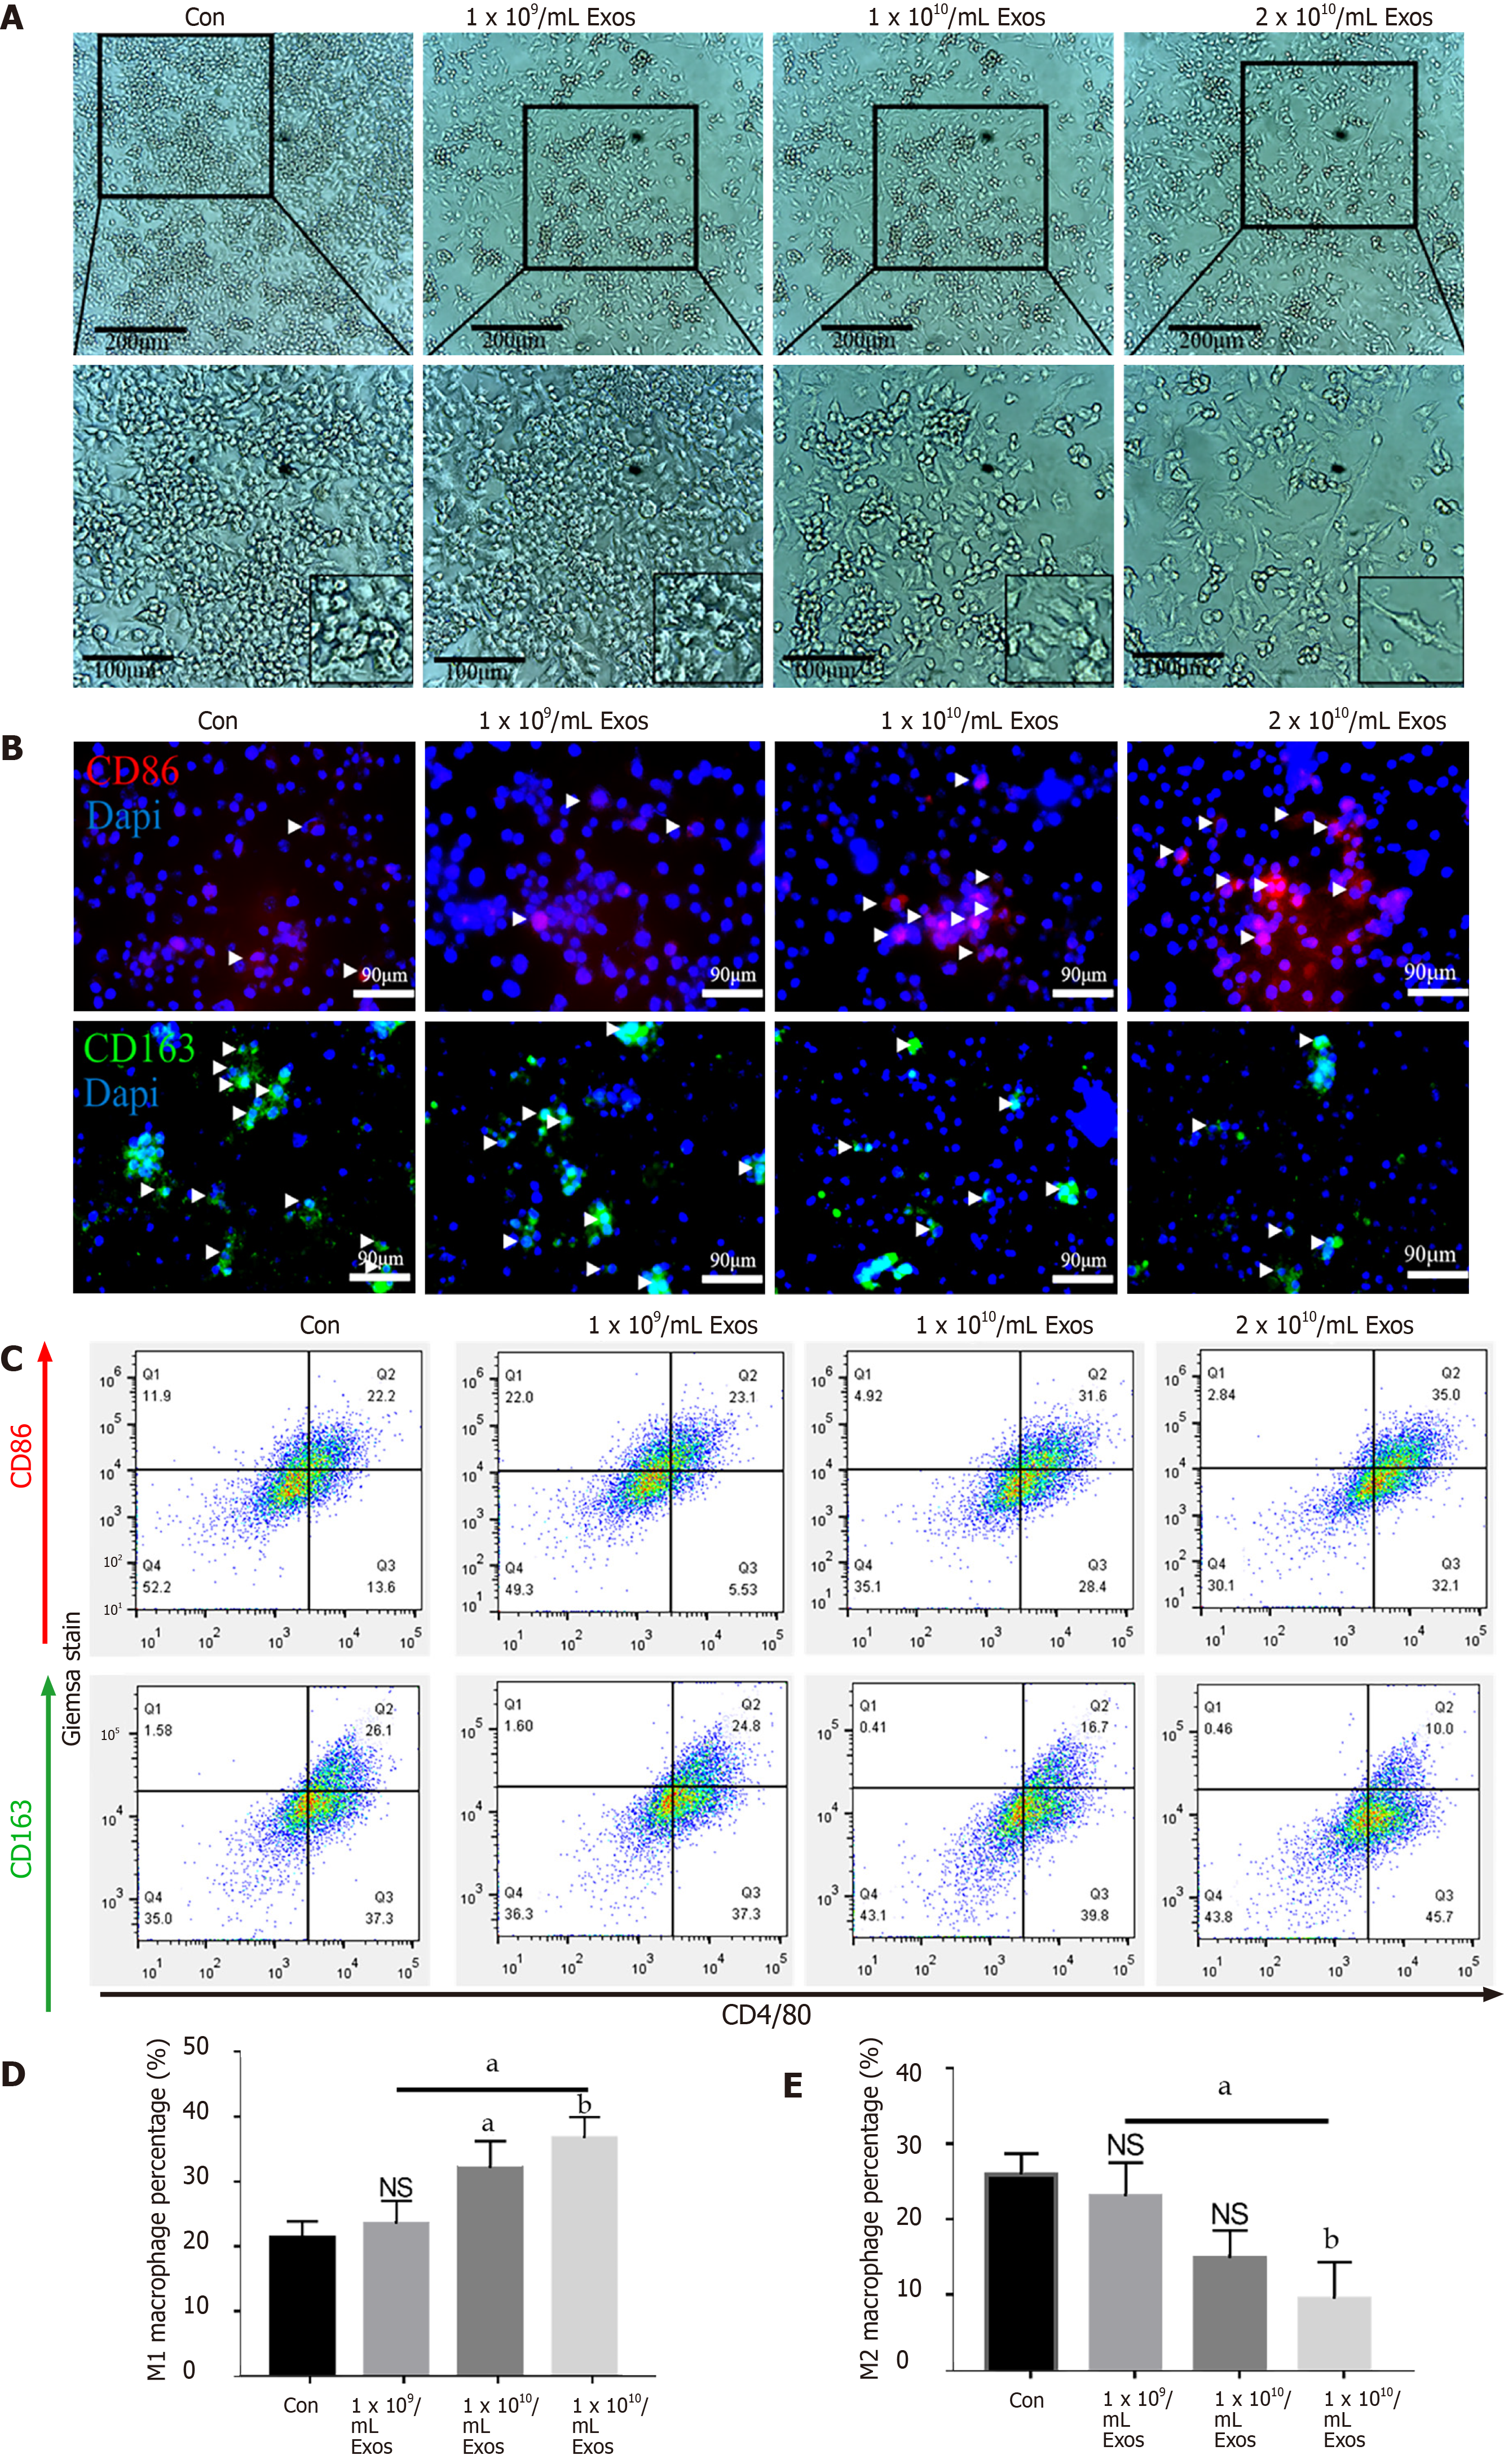
Figure 4 IF-C2C12-Exos induced M1 macrophage polarization in vitro.
A: Images of macrophages cultured with different concentrations of C2C12-Exos for 2 d (1 × 10⁹, 1 × 10¹⁰, 2 × 10¹⁰/medium). Scale bar = 200 μm or 100 μm; B: Immunofluorescence localization of CD86 (red), marker of M1 and CD206 (green), marker of M2 after culture with different concentrations of C2C12-Exos for 2 d. Scale bar = 90 μm. Arrows indicate CD206 or CD86 positive cells; C: Representative flow cytometry plots showing the percentages of M1 (CD86 + CD4/80+) and M2 (CD163 + CD4/80+) phenotype in macrophages after culture with different concentrations of C2C12-Exos for 24 h; D: Quantification of flow cytometry data (n = 3); E: M2 macrophages percentage. Data are presented as mean ± SD. aP < 0.05; bP < 0.01. NS: Not significant.
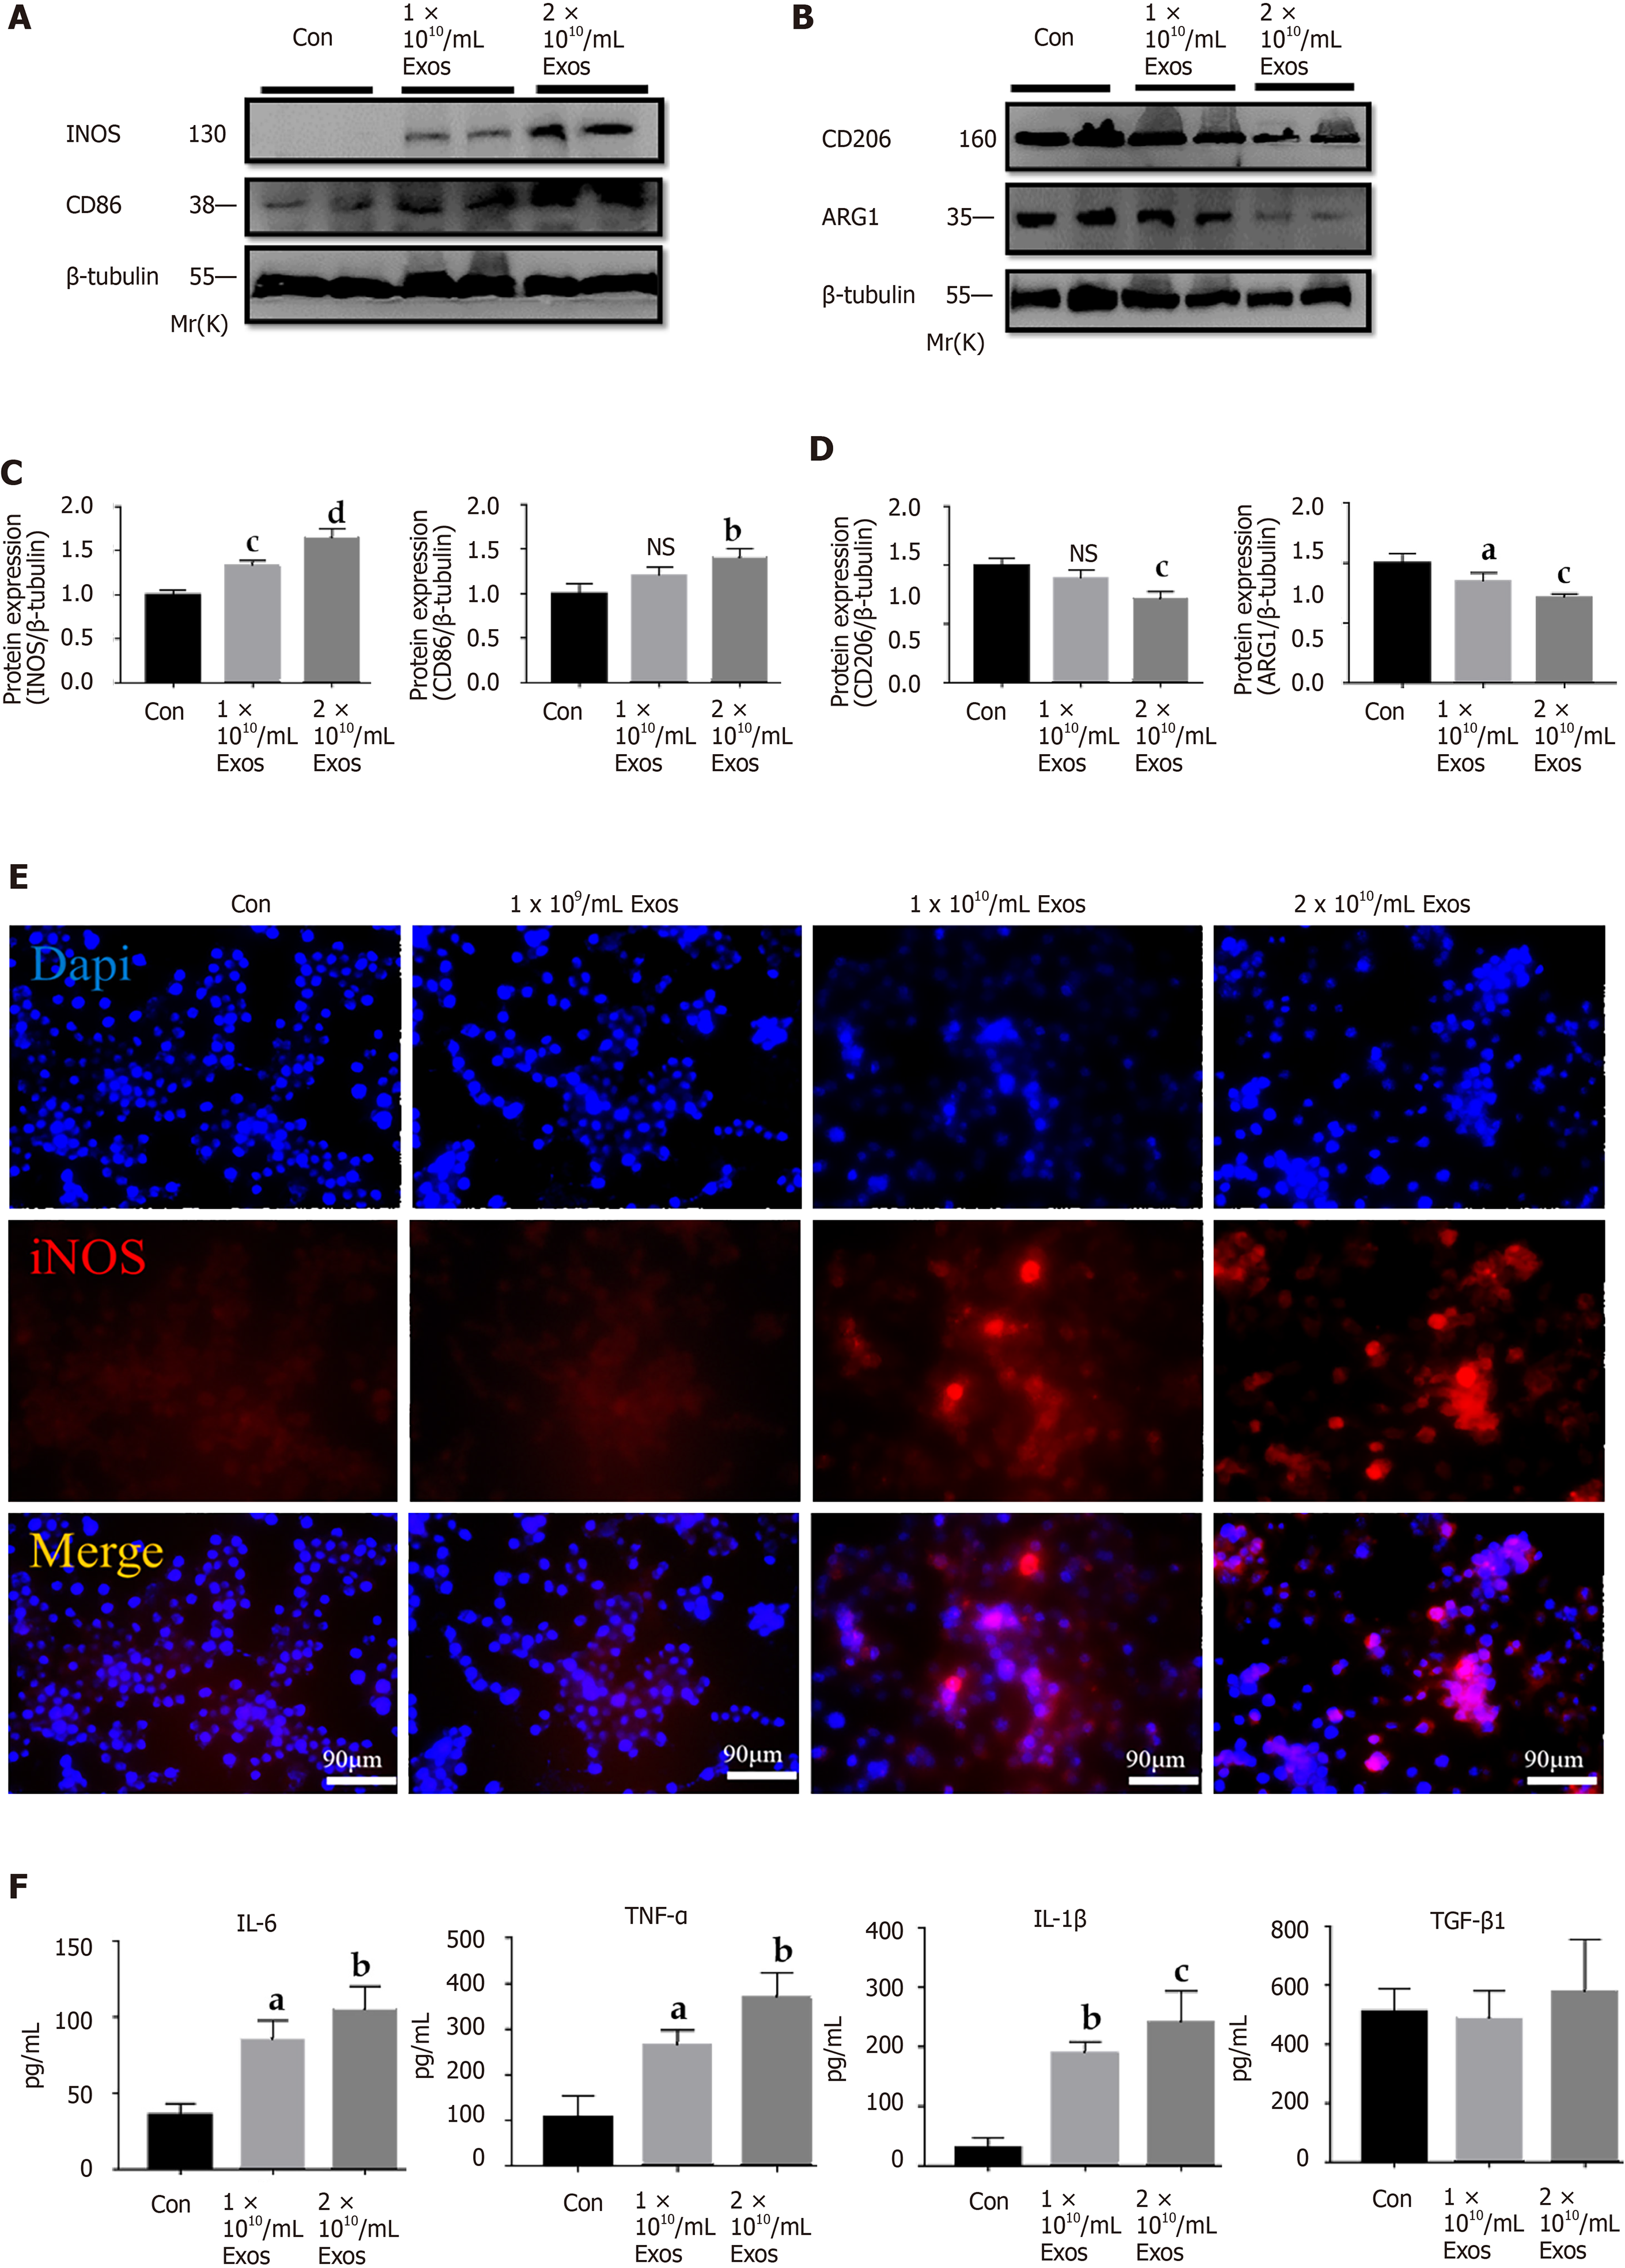
Figure 5 IF-C2C12-Exos induced inflammatory reactions of macrophages in vitro.
A-D: iNOS, CD86, CD206, and Arg1 protein levels in macrophages were determined by western blot after culturing with different concentrations of C2C12-Exos for 24 h (1 × 10¹⁰, 2 × 10¹⁰/medium). (n = 4). Data are expressed as the mean ± SD. aP < 0.05, bP < 0.01, cP < 0.001, dP < 0.0001; E: Immunofluorescence localization and relative expression of iNOS, a marker of inflammatory level, in macrophage medium after culture with different concentrations of C2C12-Exos for 24 h. Scale bar = 90 μm; F: The concentration of cytokine interleukin (IL)-6, transforming growth factor-β, tumor necrosis factor-α, and IL-1β in supernatants of macrophage cells after culture with IF-C2C12-Exos or phosphate-buffered saline for 24 h measured by ELISA (n = 3). aP < 0.05, bP < 0.01, cP < 0.001. PBS: Phosphate-buffered saline. IL: Interleukin; TGF-β: Transforming growth factor-β; TNF-α: Tumor necrosis factor-α; NS: Not significant.
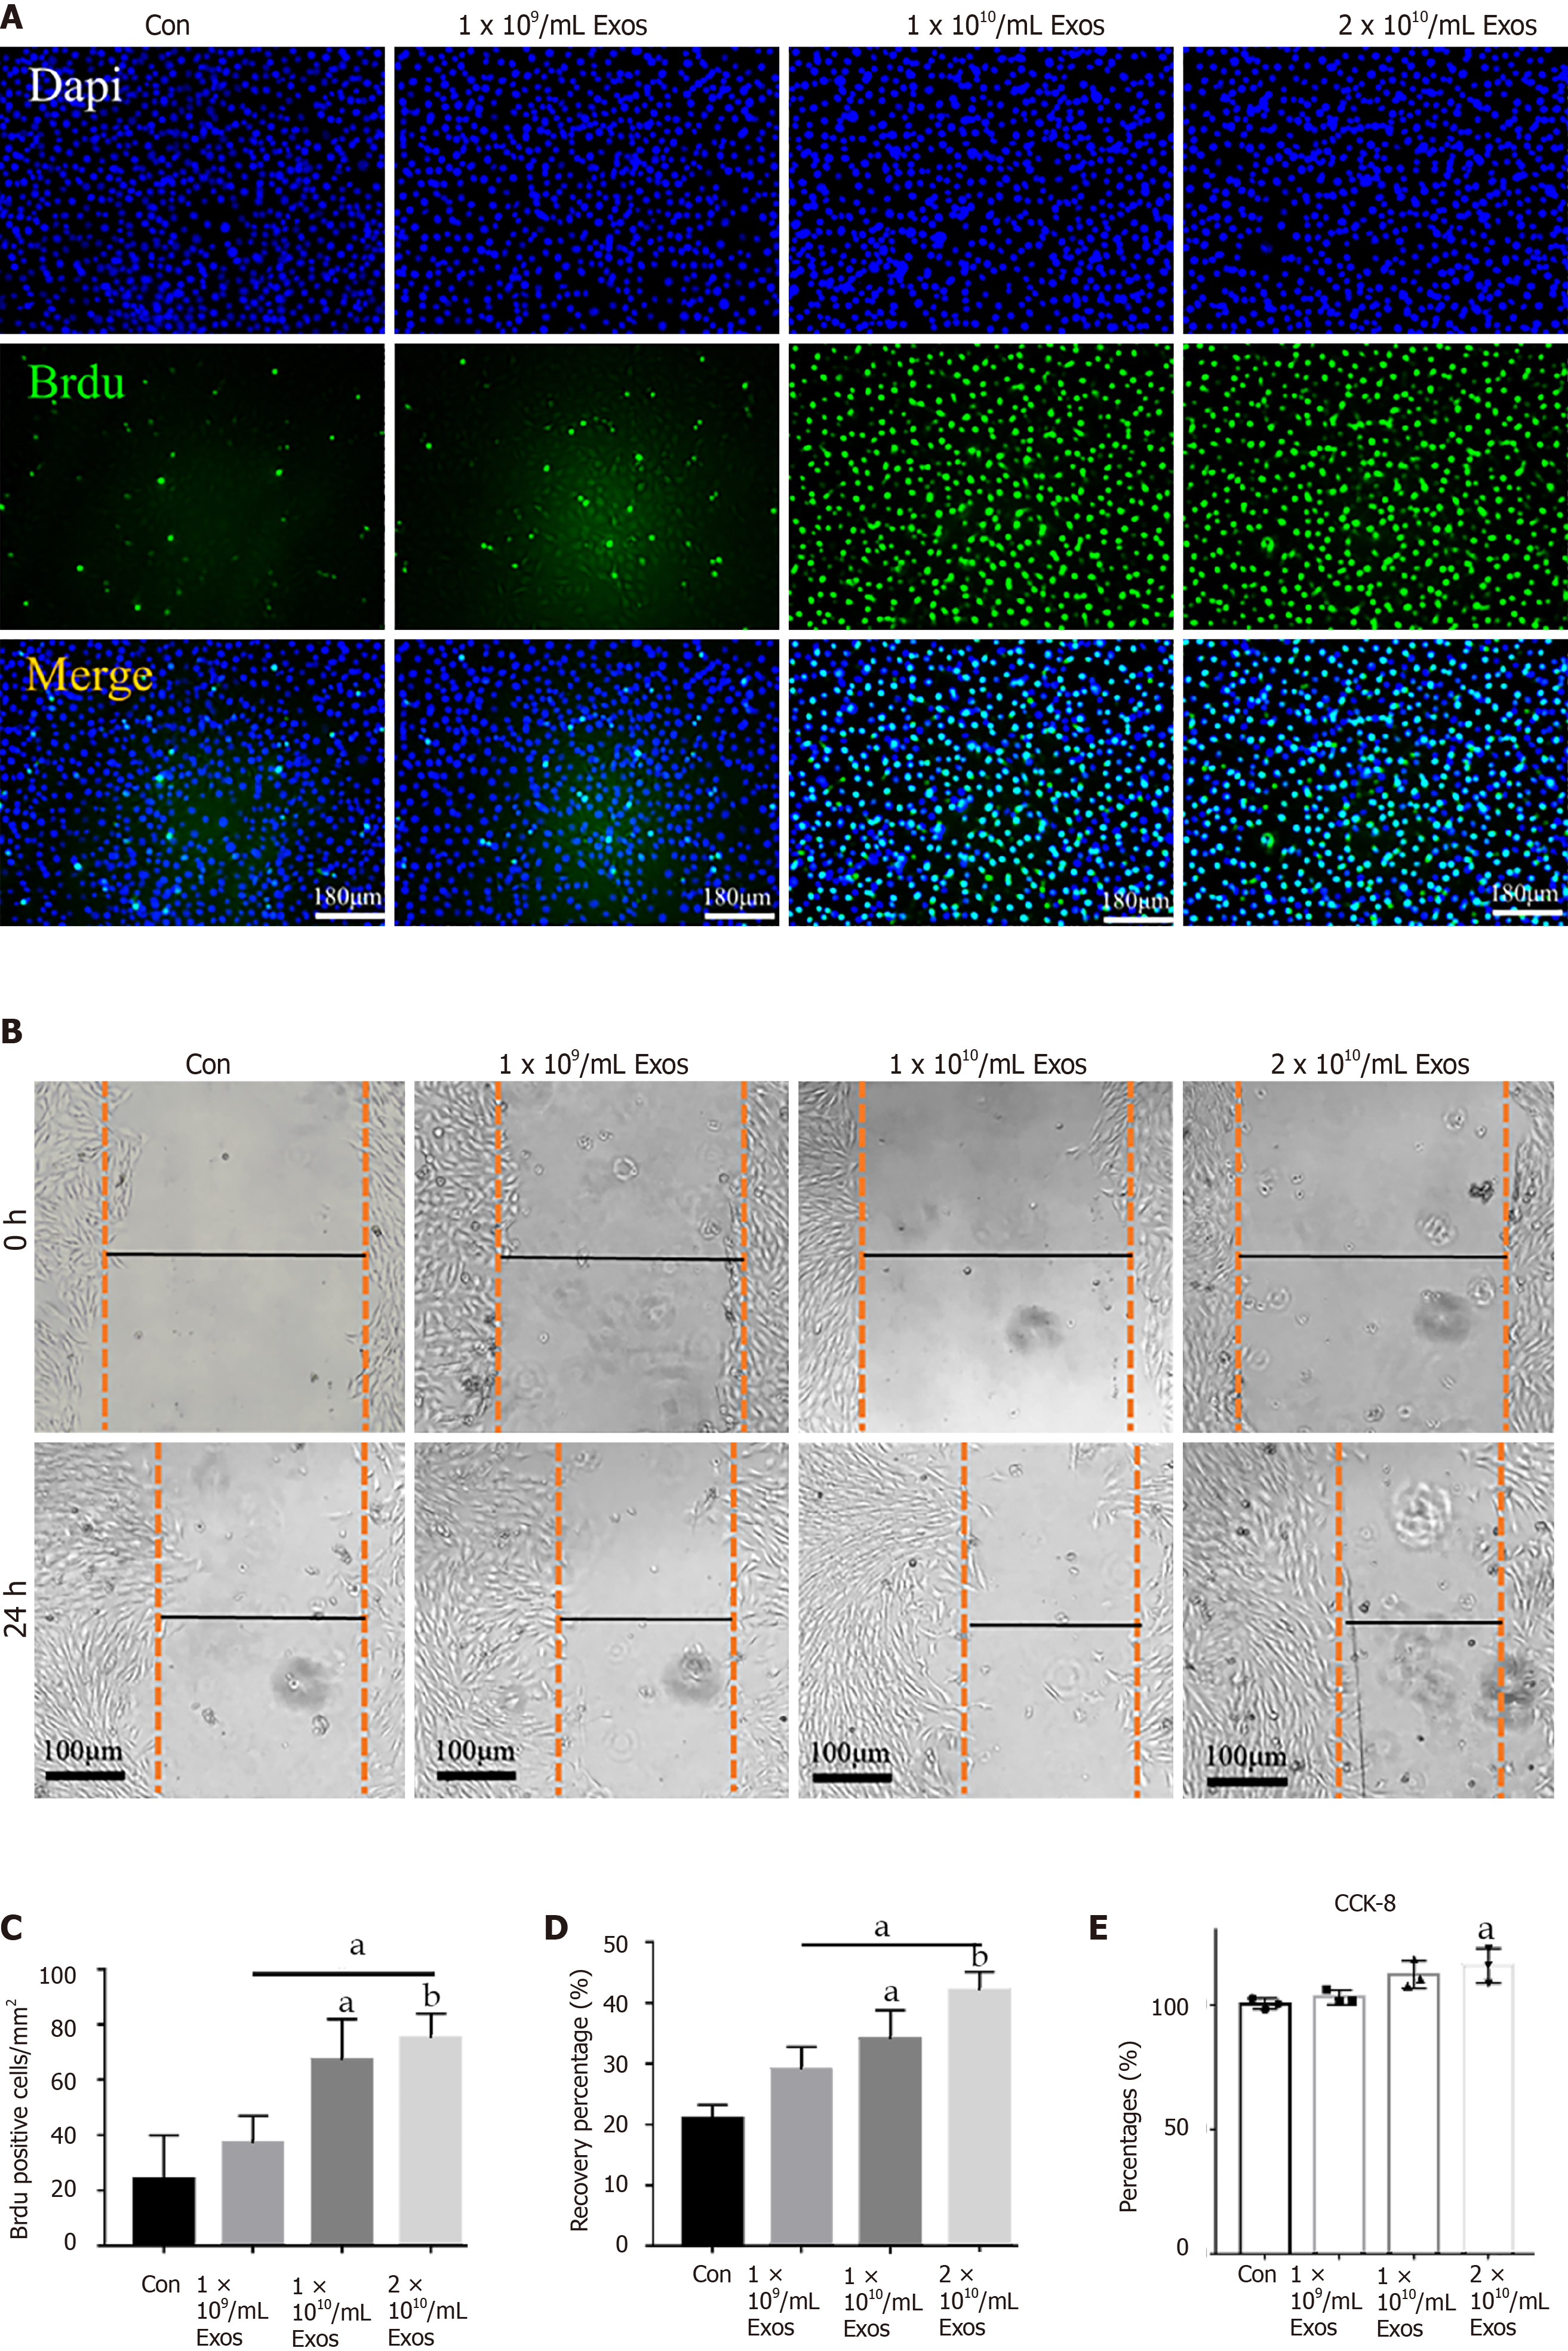
Figure 6 IF-C2C12-Exos stimulated C2C12 proliferation in vitro.
A: Cell proliferation ability of C2C12 was determined using the BrdU incorporation assay after 24 h IF-C2C12-Exos incubation. Green signal = BrdU. Scale bar = 180 μm; B: The cell migration ability of C2C12 was determined by the wound-healing assay after 24 h IF-C2C12-Exos incubation; C and D: Quantification of BrdU and wound-healing data (n = 3). Data are presented as mean ± SD. aP < 0.05, bP < 0.01; E: Cell proliferation ability of C2C12 was further determined using the CCK-8 assay. Data are presented as mean ± SD. aP < 0.05.
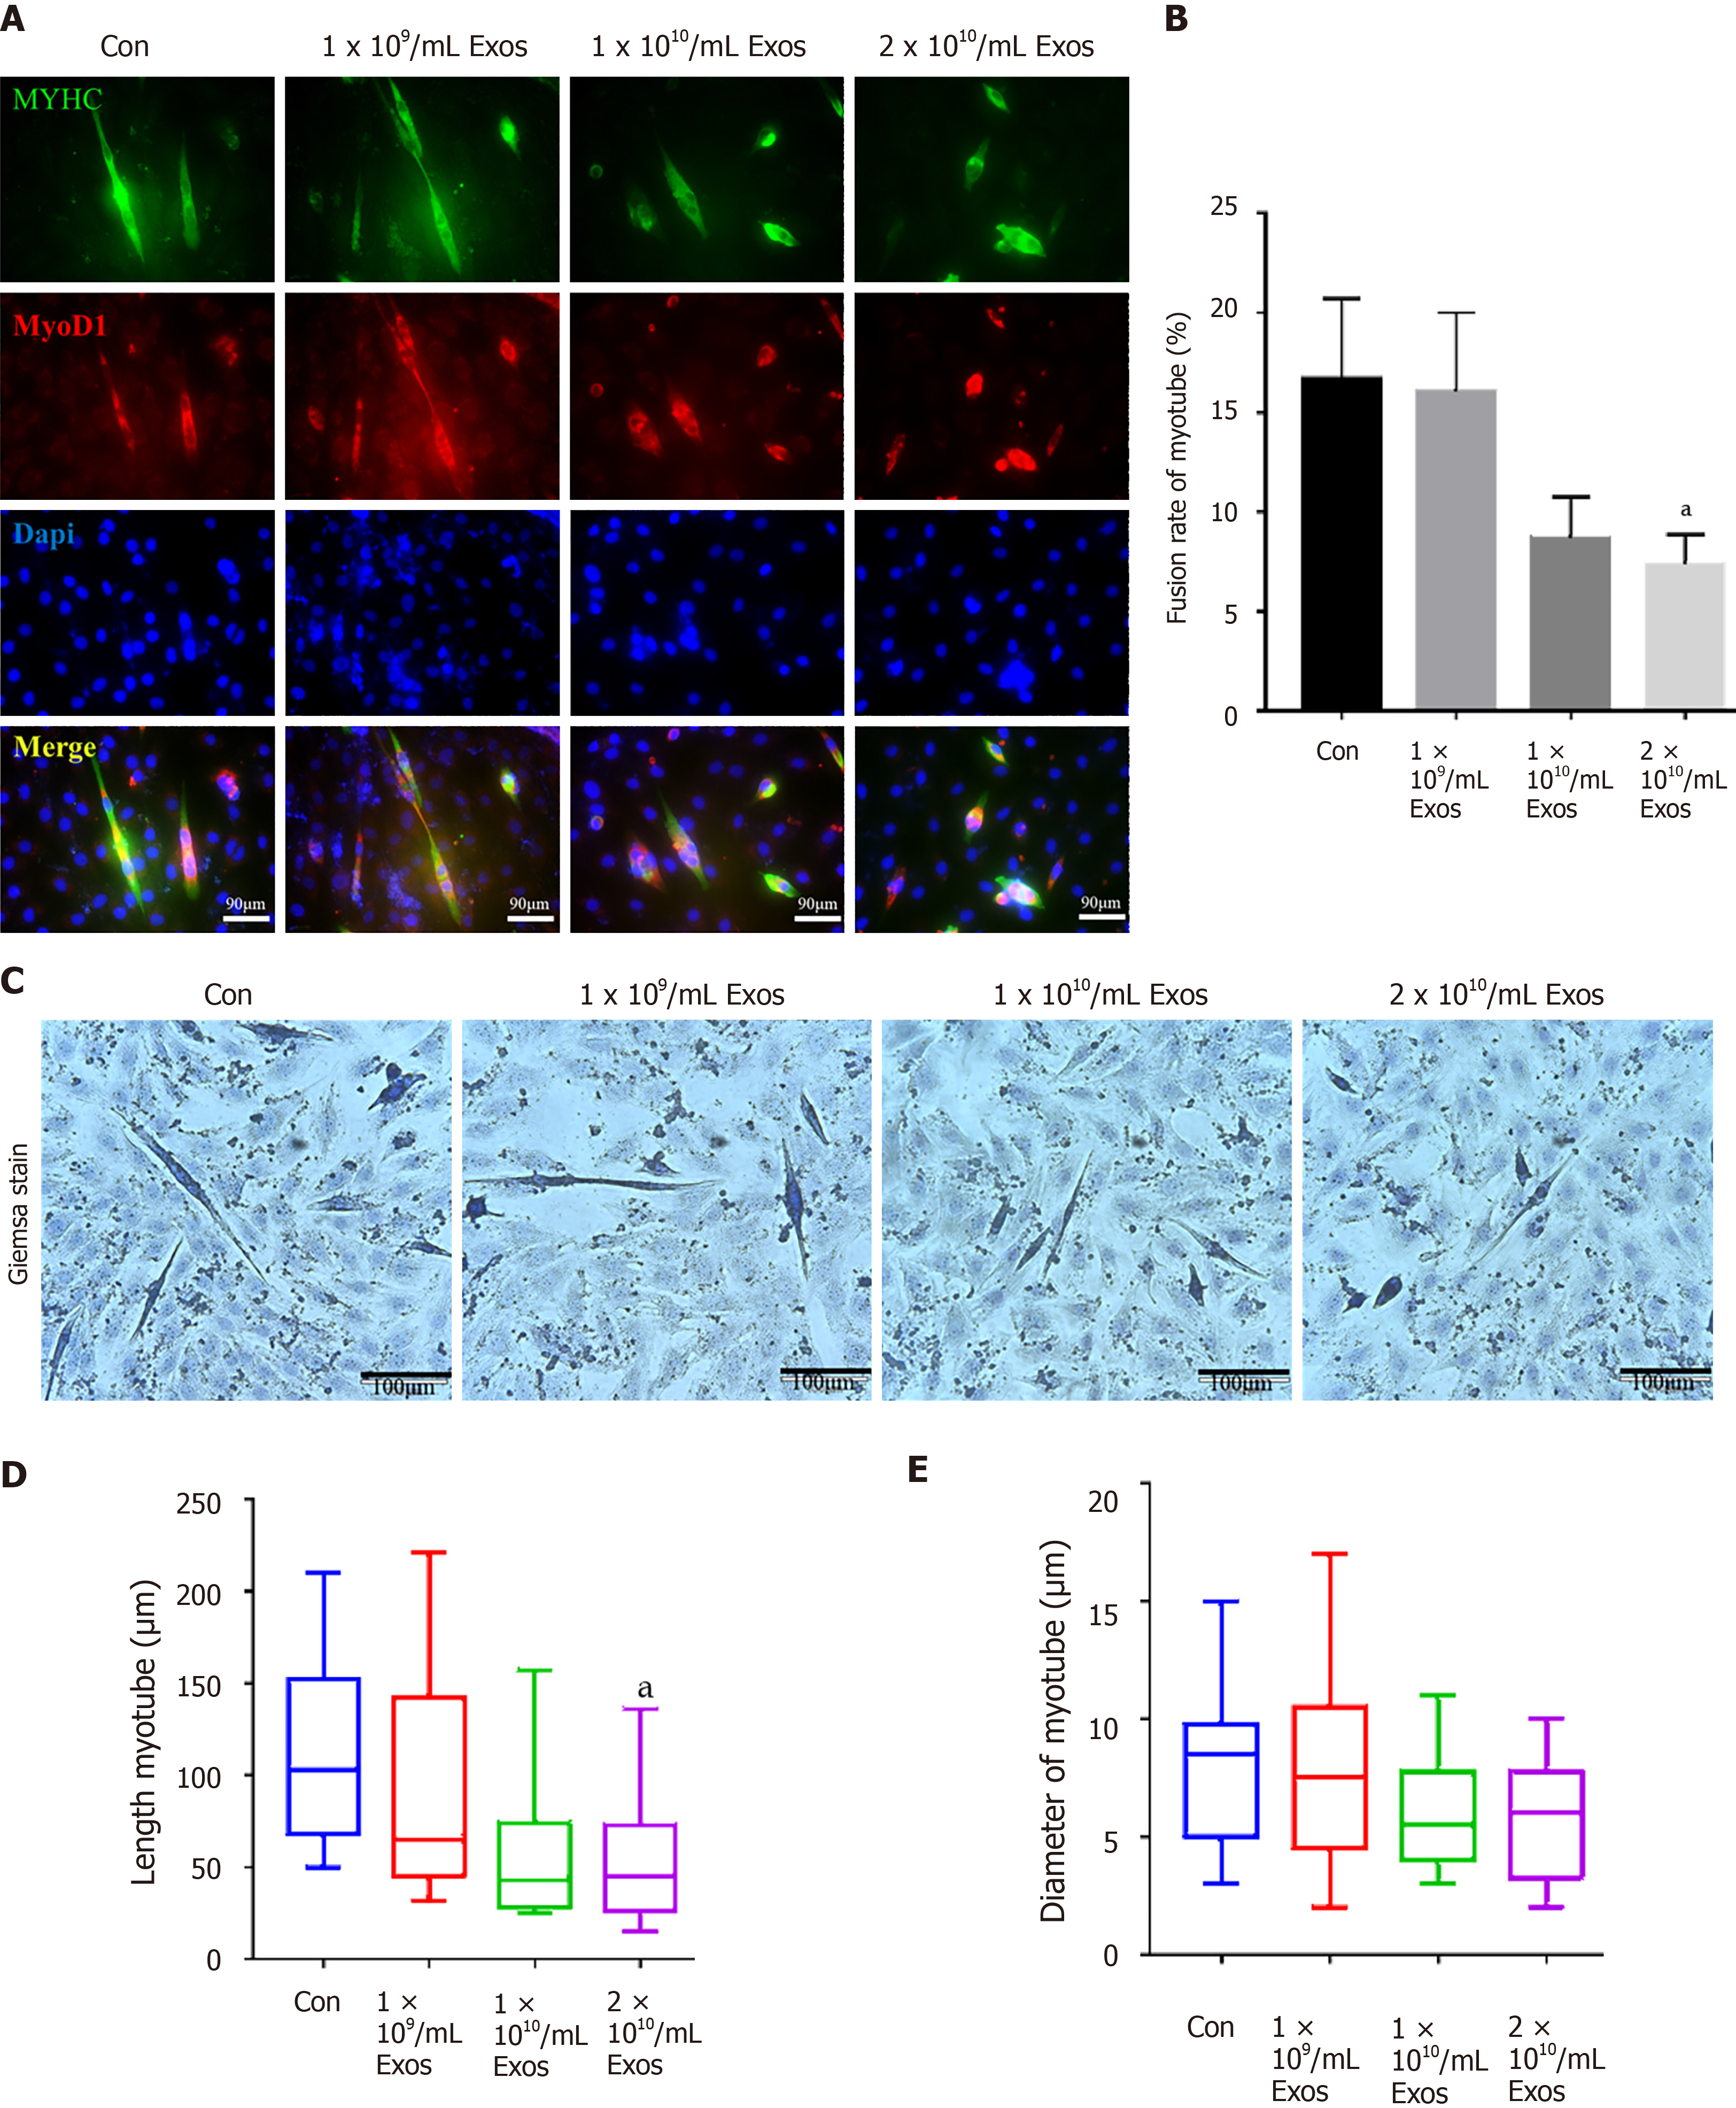
Figure 7 IF-C2C12-Exos impaired early C2C12 muscle differentiation in vitro.
A: Immunofluorescence was used to detect relative expression and distribution of MYHC and Myod1 on day 2 after different treatments. Green, red, and blue signals represent MYHC, Myod1, and nucleus, respectively. Scale bar = 90 μm; B, D and E: Quantification of myotube length, diameter, and fusion rate. Data are presented as mean ± SD. n = 12 or 3. aP < 0.05; C: Representative images of myotube after culture with different concentrations of IF-C2C12-Exosomes for 24 h by Giemsa staining (2 d 2% horse-serum incubation). Scale bar = 100 μm.
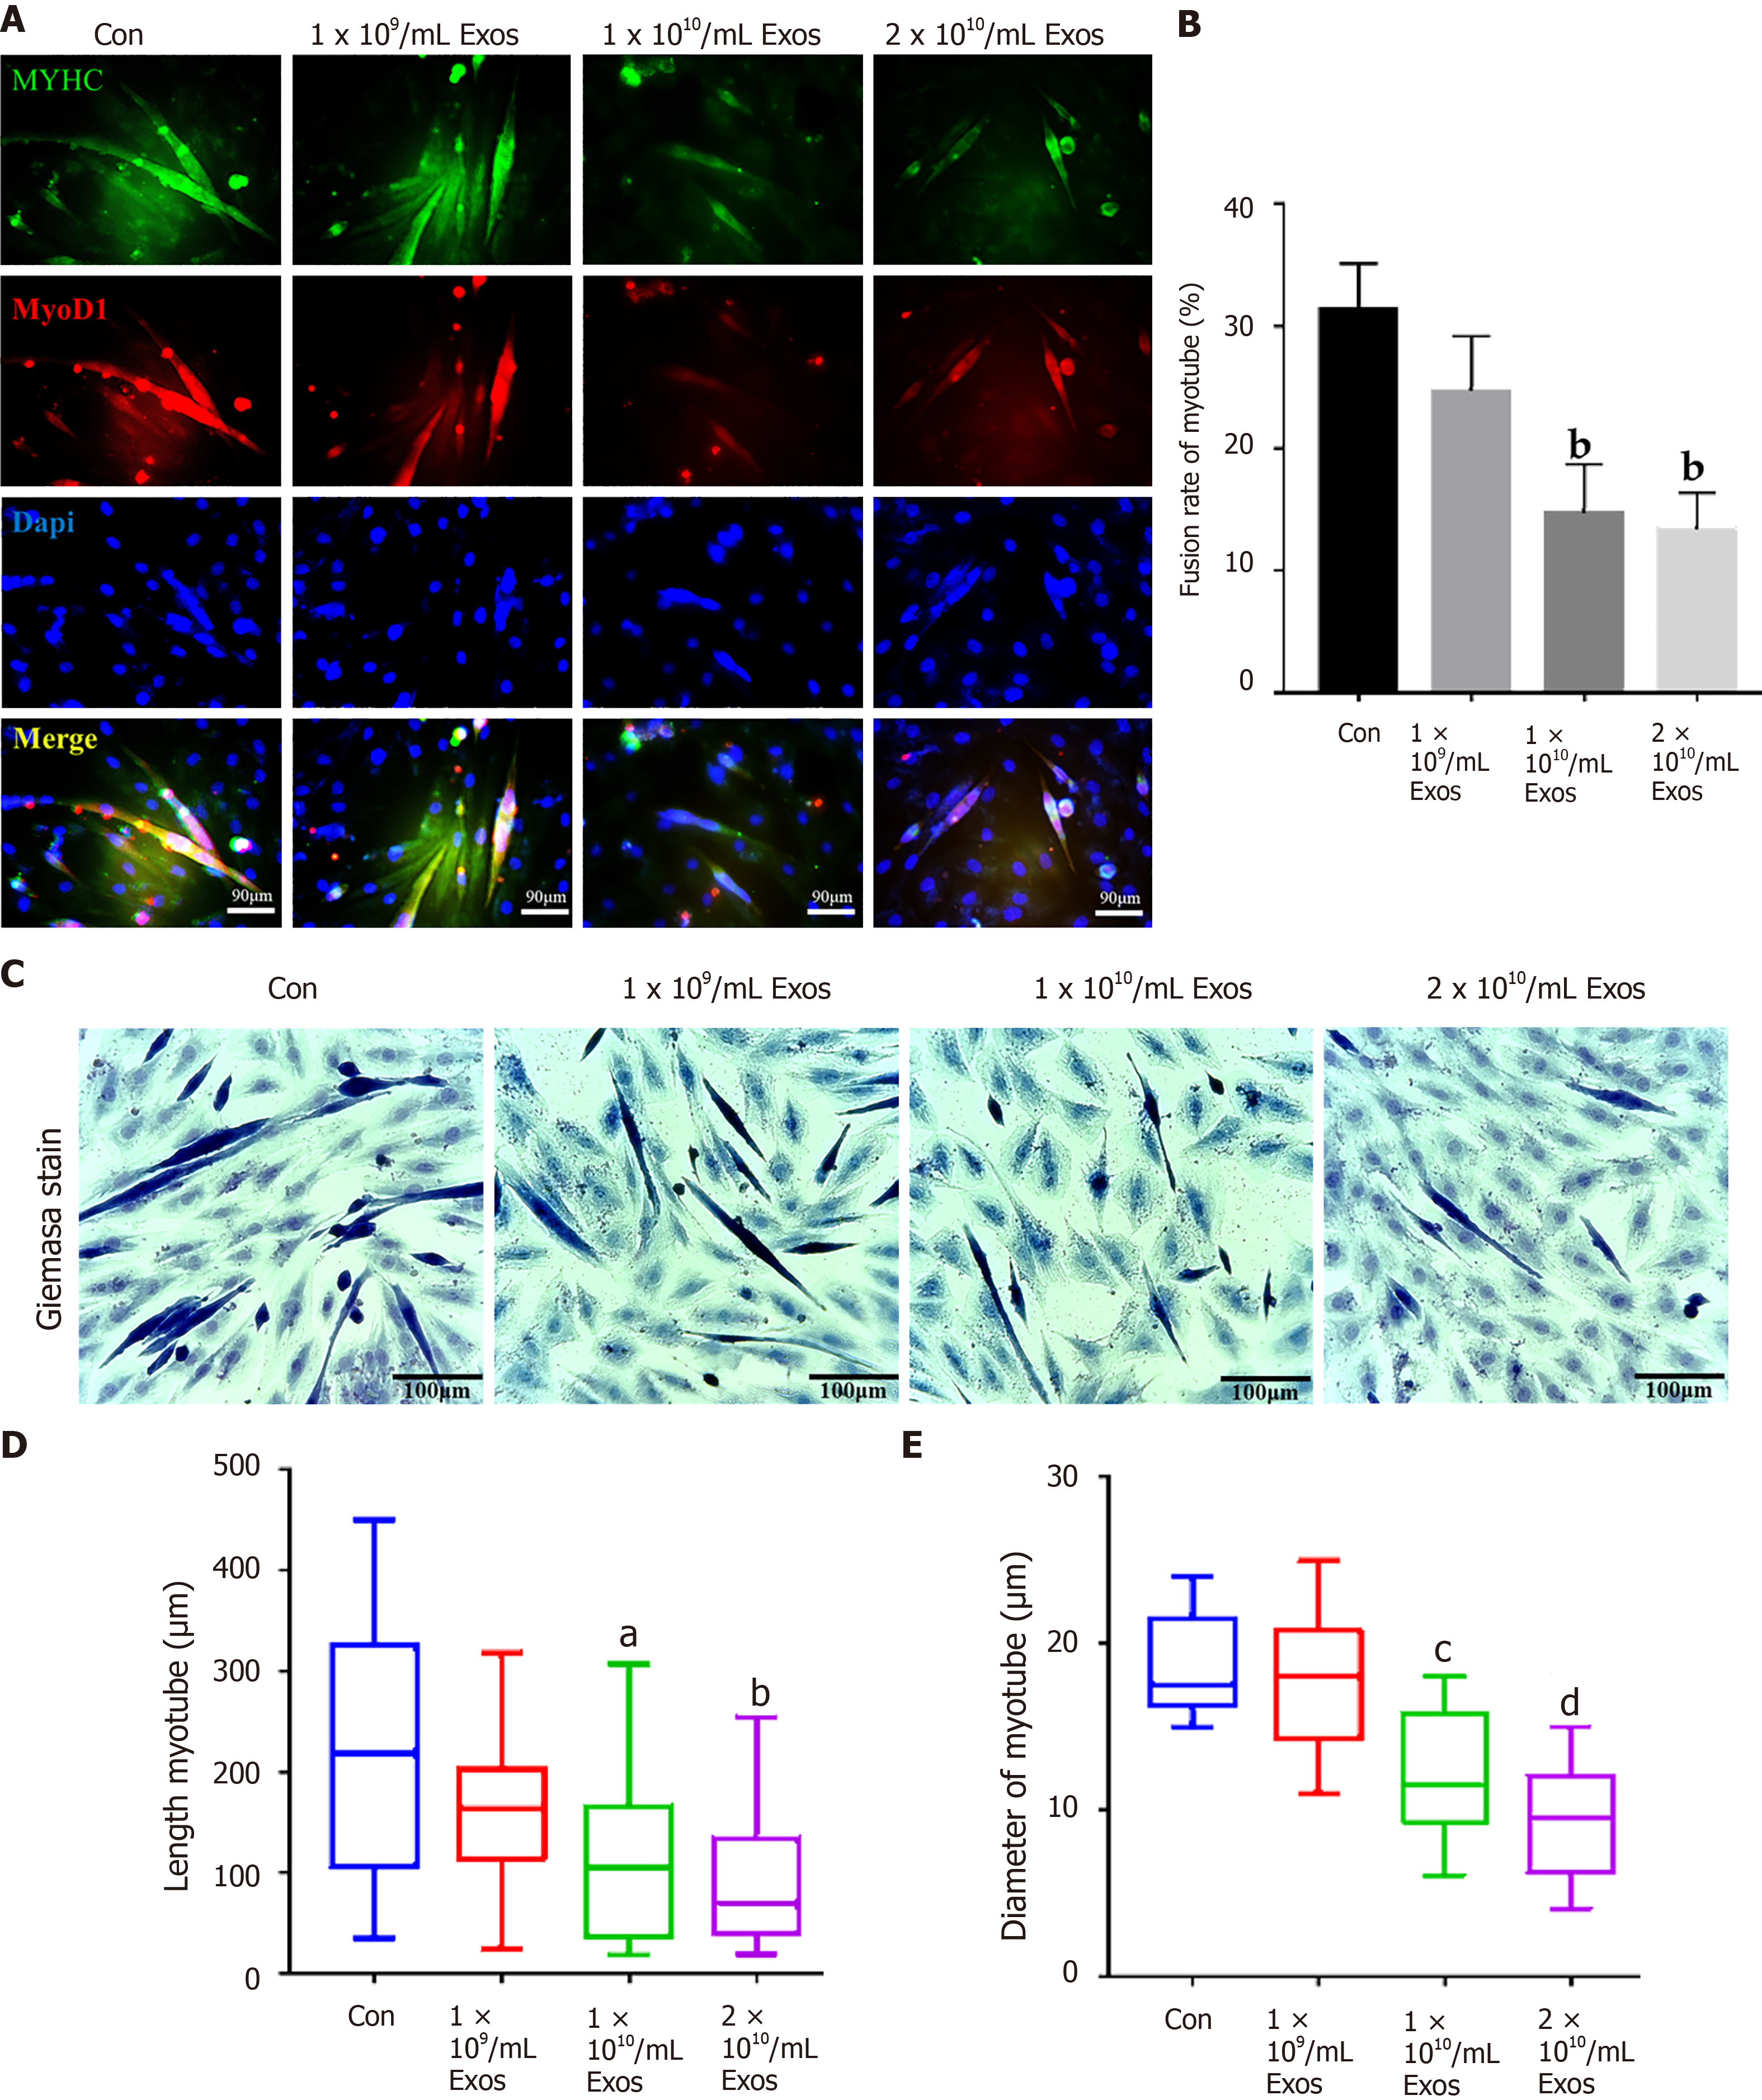
Figure 8 IF-C2C12 Exos impaired C2C12 muscle differentiation in vitro.
A: Immunofluorescence was used to detect relative expression and distribution of MYHC and Myod1 on day 4 after different treatments. Green, red, and blue signals represent MYHC, Myod1, and nucleus, respectively. Scale bar = 90 μm; B, D and E: Quantification of myotube length, diameter, and fusion rate. Data are presented as mean ± SD. n = 12 or 3. aP < 0.05, bP < 0.01, cP < 0.001, dP < 0.0001; C: Representative images of myotube after culture with different concentrations of IF-C2C12-Exosomes for 24 h by Giemsa staining (4 d 2% horse-serum incubation). Scale bar = 100 μmT.
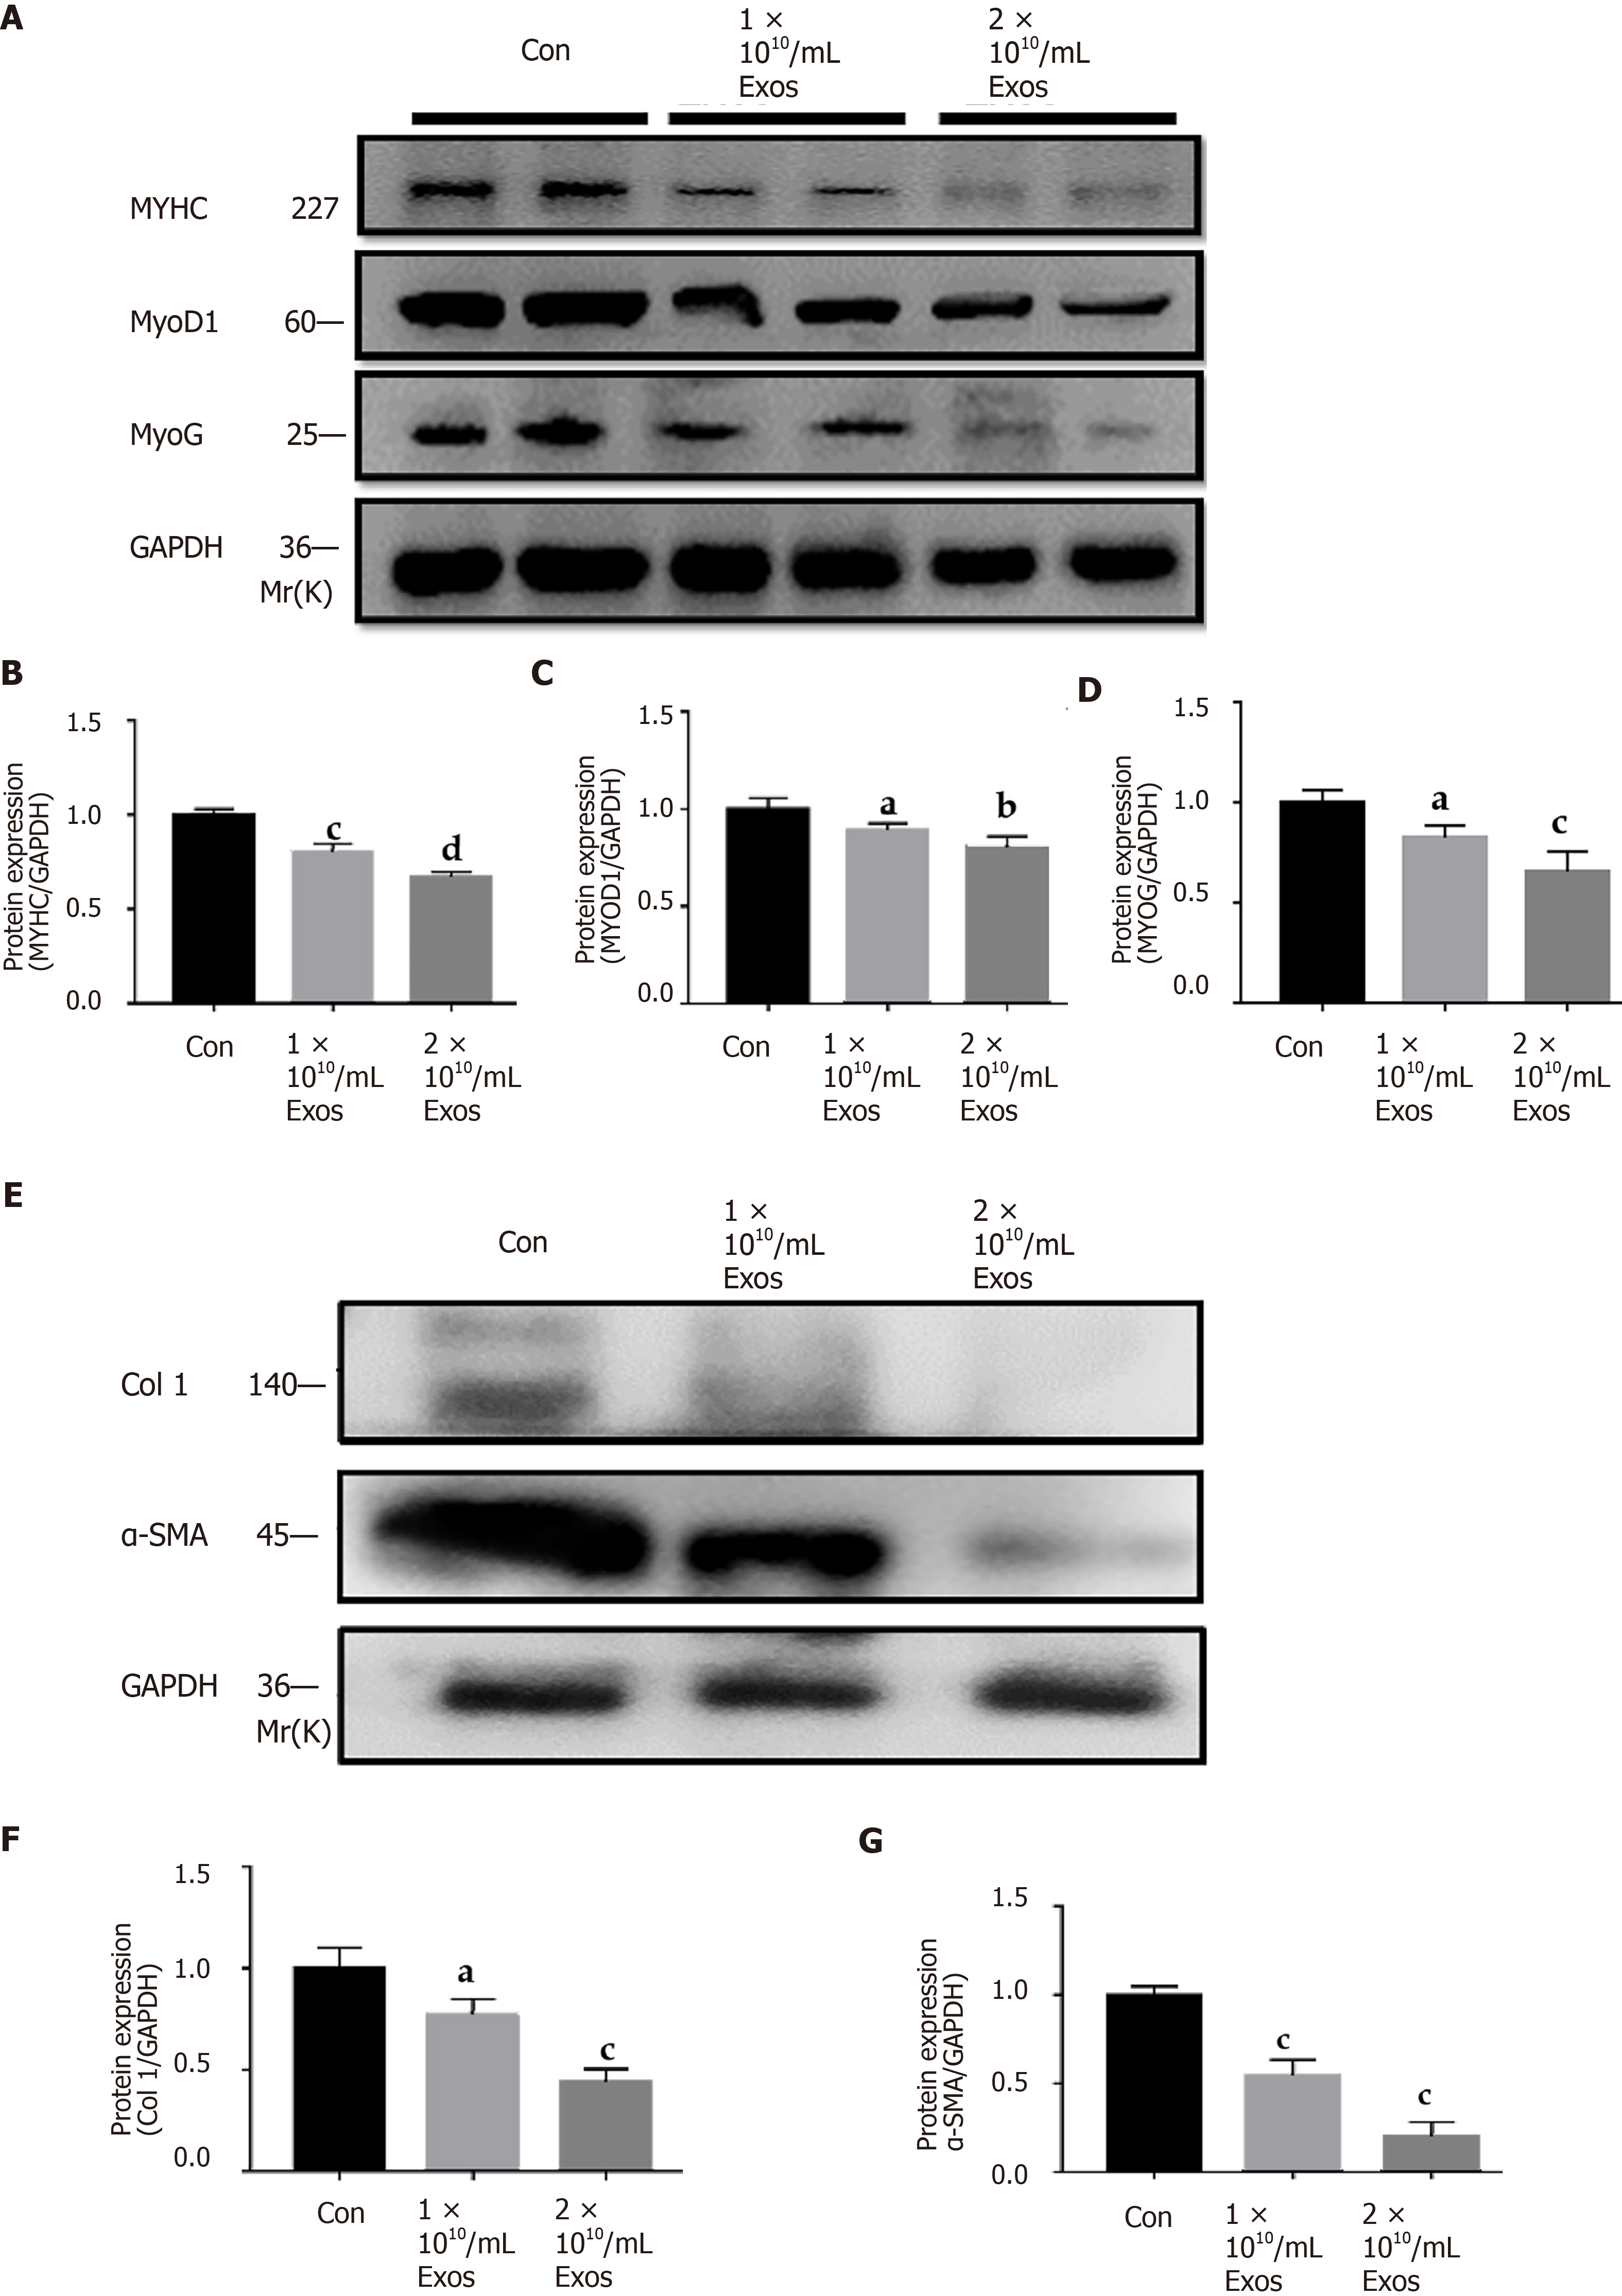
Figure 9 IF-C2C12 Exos down-regulated C2C12 fibrogenic/myogenic differentiation-related proteins in vitro.
A-D: MYHC, MYOD1, and MYOG protein levels in C2C12 medium were determined by western blot after incubation with different concentrations of C2C12-Exos for 24 h (1 × 10⁹, 1 × 10¹⁰, 2 × 10¹⁰/medium) (n = 4); E-G: Col 1 and α-smooth muscle actin. Data are presented as mean ± SD. aP < 0.05, bP < 0.01, cP < 0.001, dP < 0.0001. α-SMA: α-smooth muscle actin.
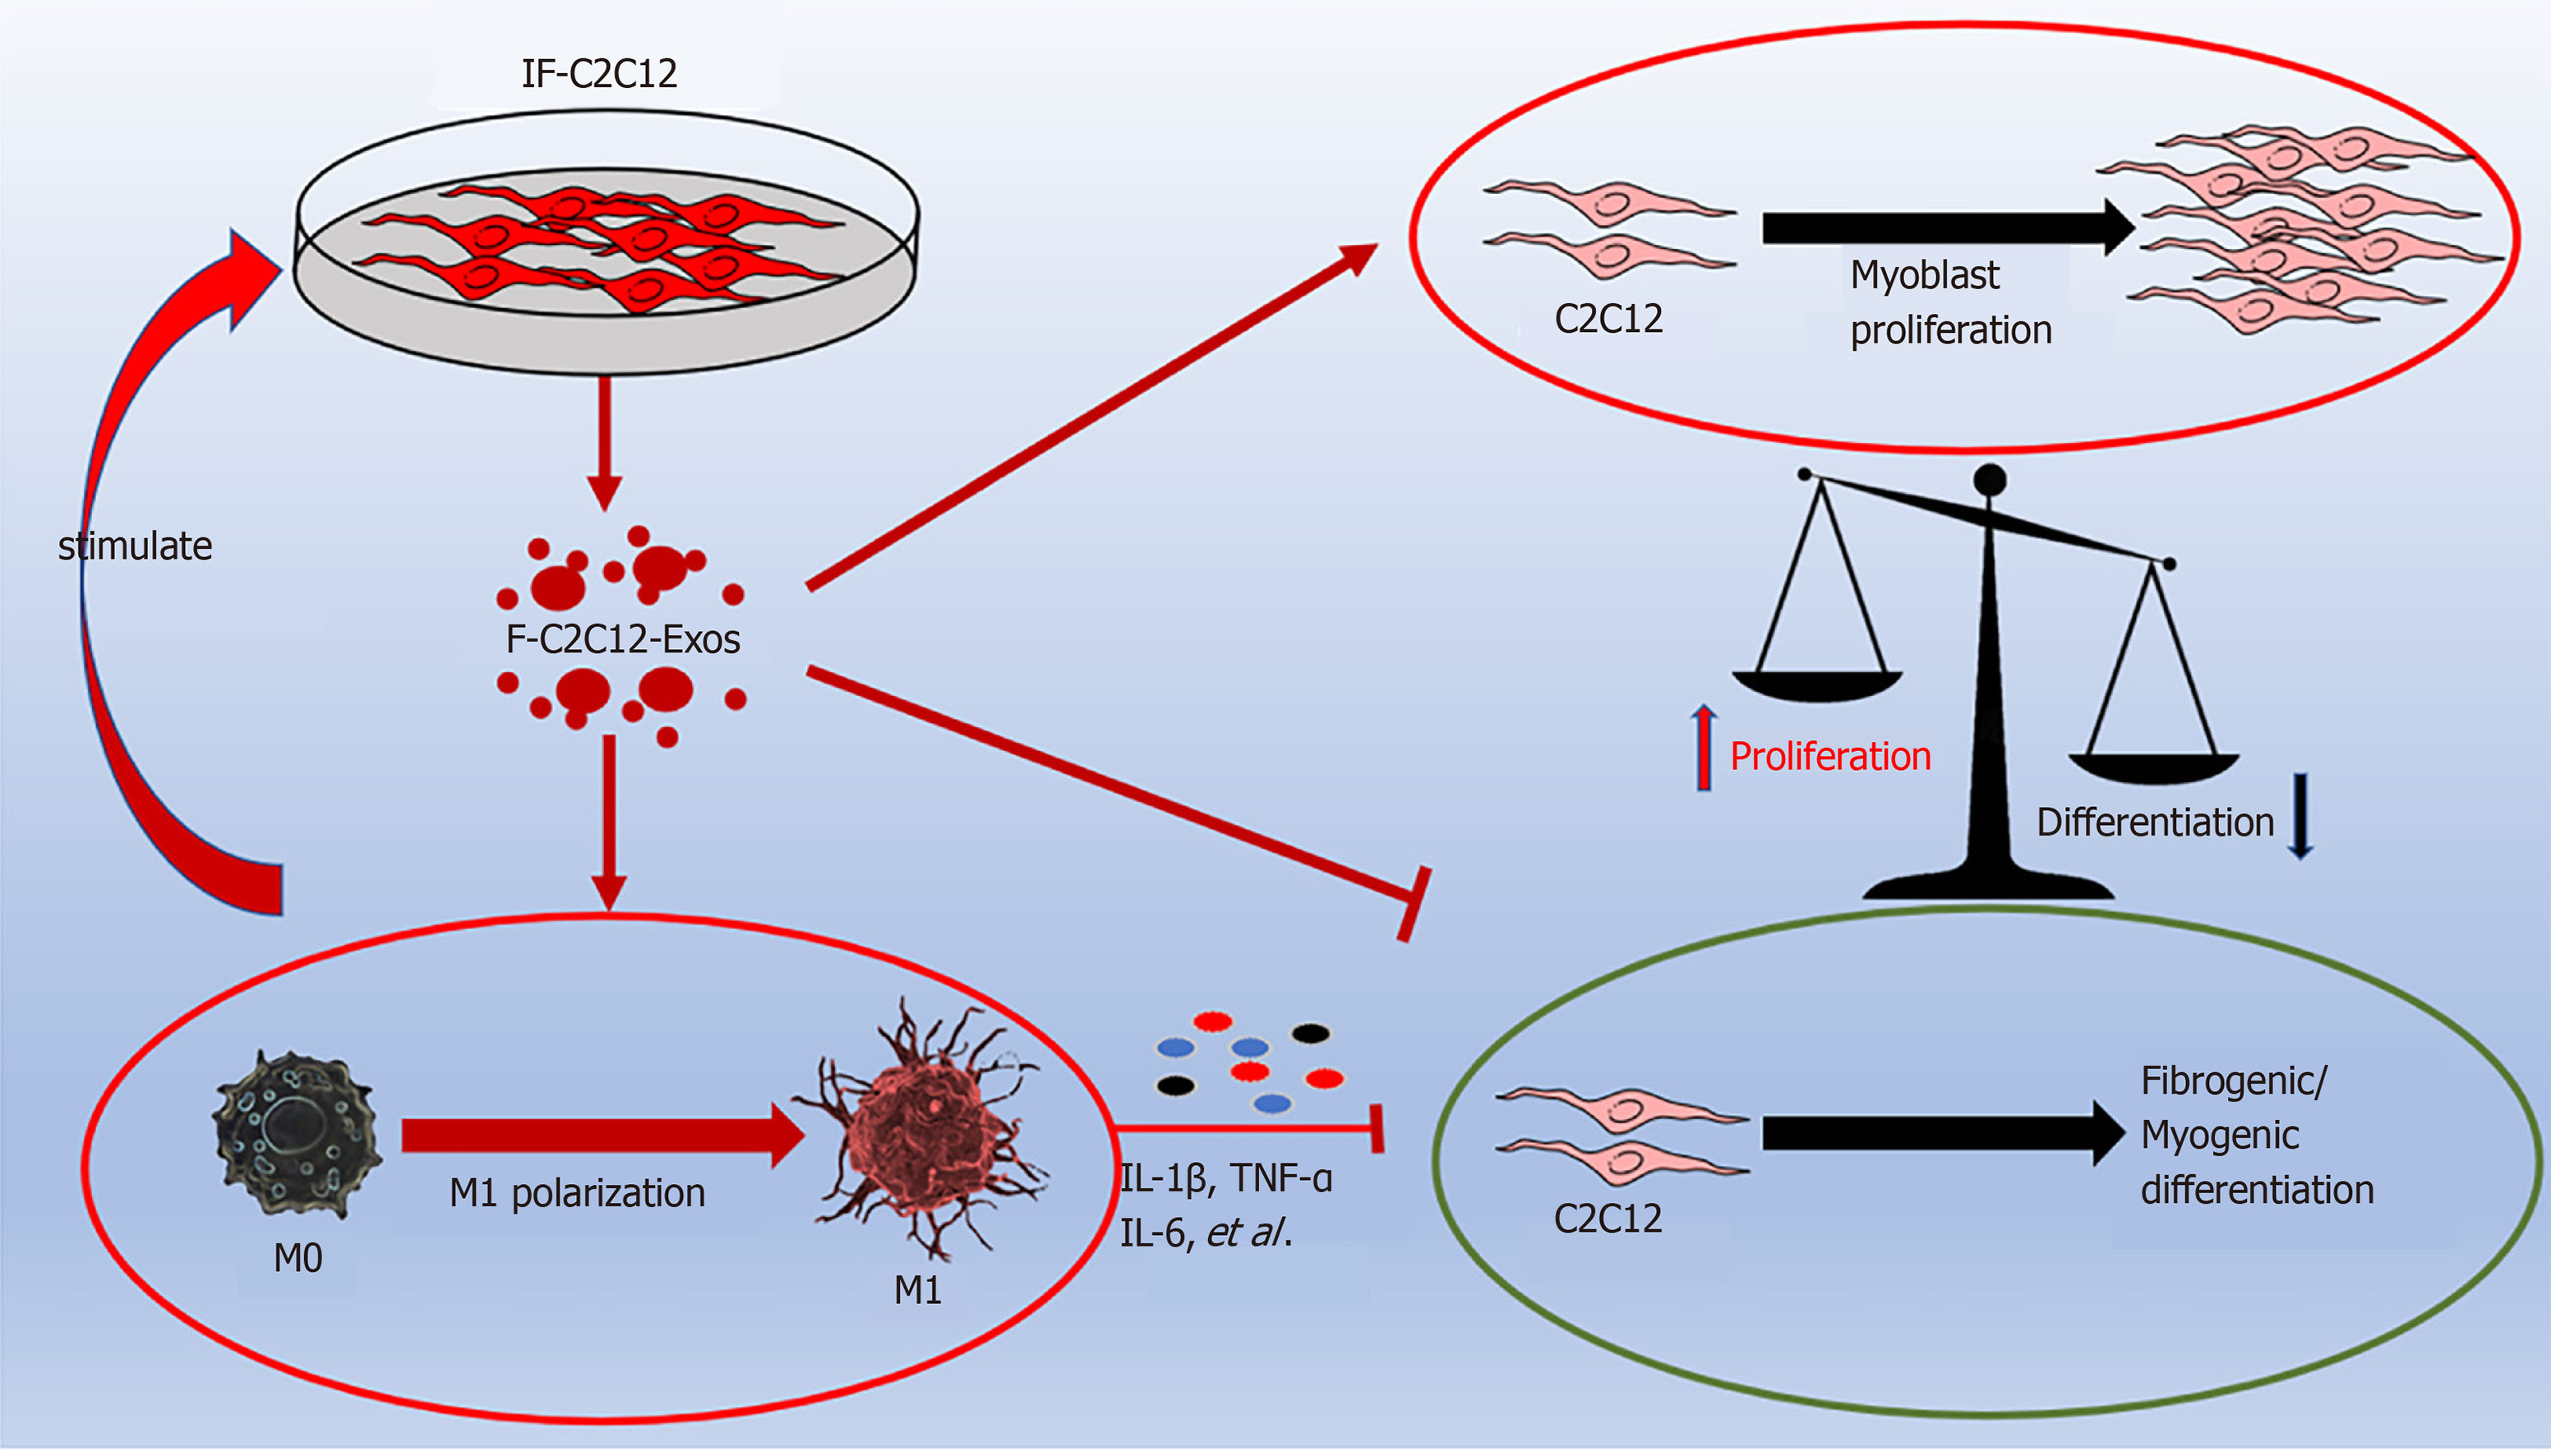
Figure 10 Graphic abstract.
IF-C2C12-Exos promoted M1 macrophage polarization and myoblast proliferation, and inhibited myoblast fibrogenic/myogenic differentiation. IL: Interleukin; TNF-α: Tumor necrosis factor-α.
- Citation: Luo ZW, Sun YY, Lin JR, Qi BJ, Chen JW. Exosomes derived from inflammatory myoblasts promote M1 polarization and break the balance of myoblast proliferation/differentiation. World J Stem Cells 2021; 13(11): 1762-1782
- URL: https://www.wjgnet.com/1948-0210/full/v13/i11/1762.htm
- DOI: https://dx.doi.org/10.4252/wjsc.v13.i11.1762


