Copyright
©The Author(s) 2025.
World J Gastroenterol. Oct 21, 2025; 31(39): 110751
Published online Oct 21, 2025. doi: 10.3748/wjg.v31.i39.110751
Published online Oct 21, 2025. doi: 10.3748/wjg.v31.i39.110751
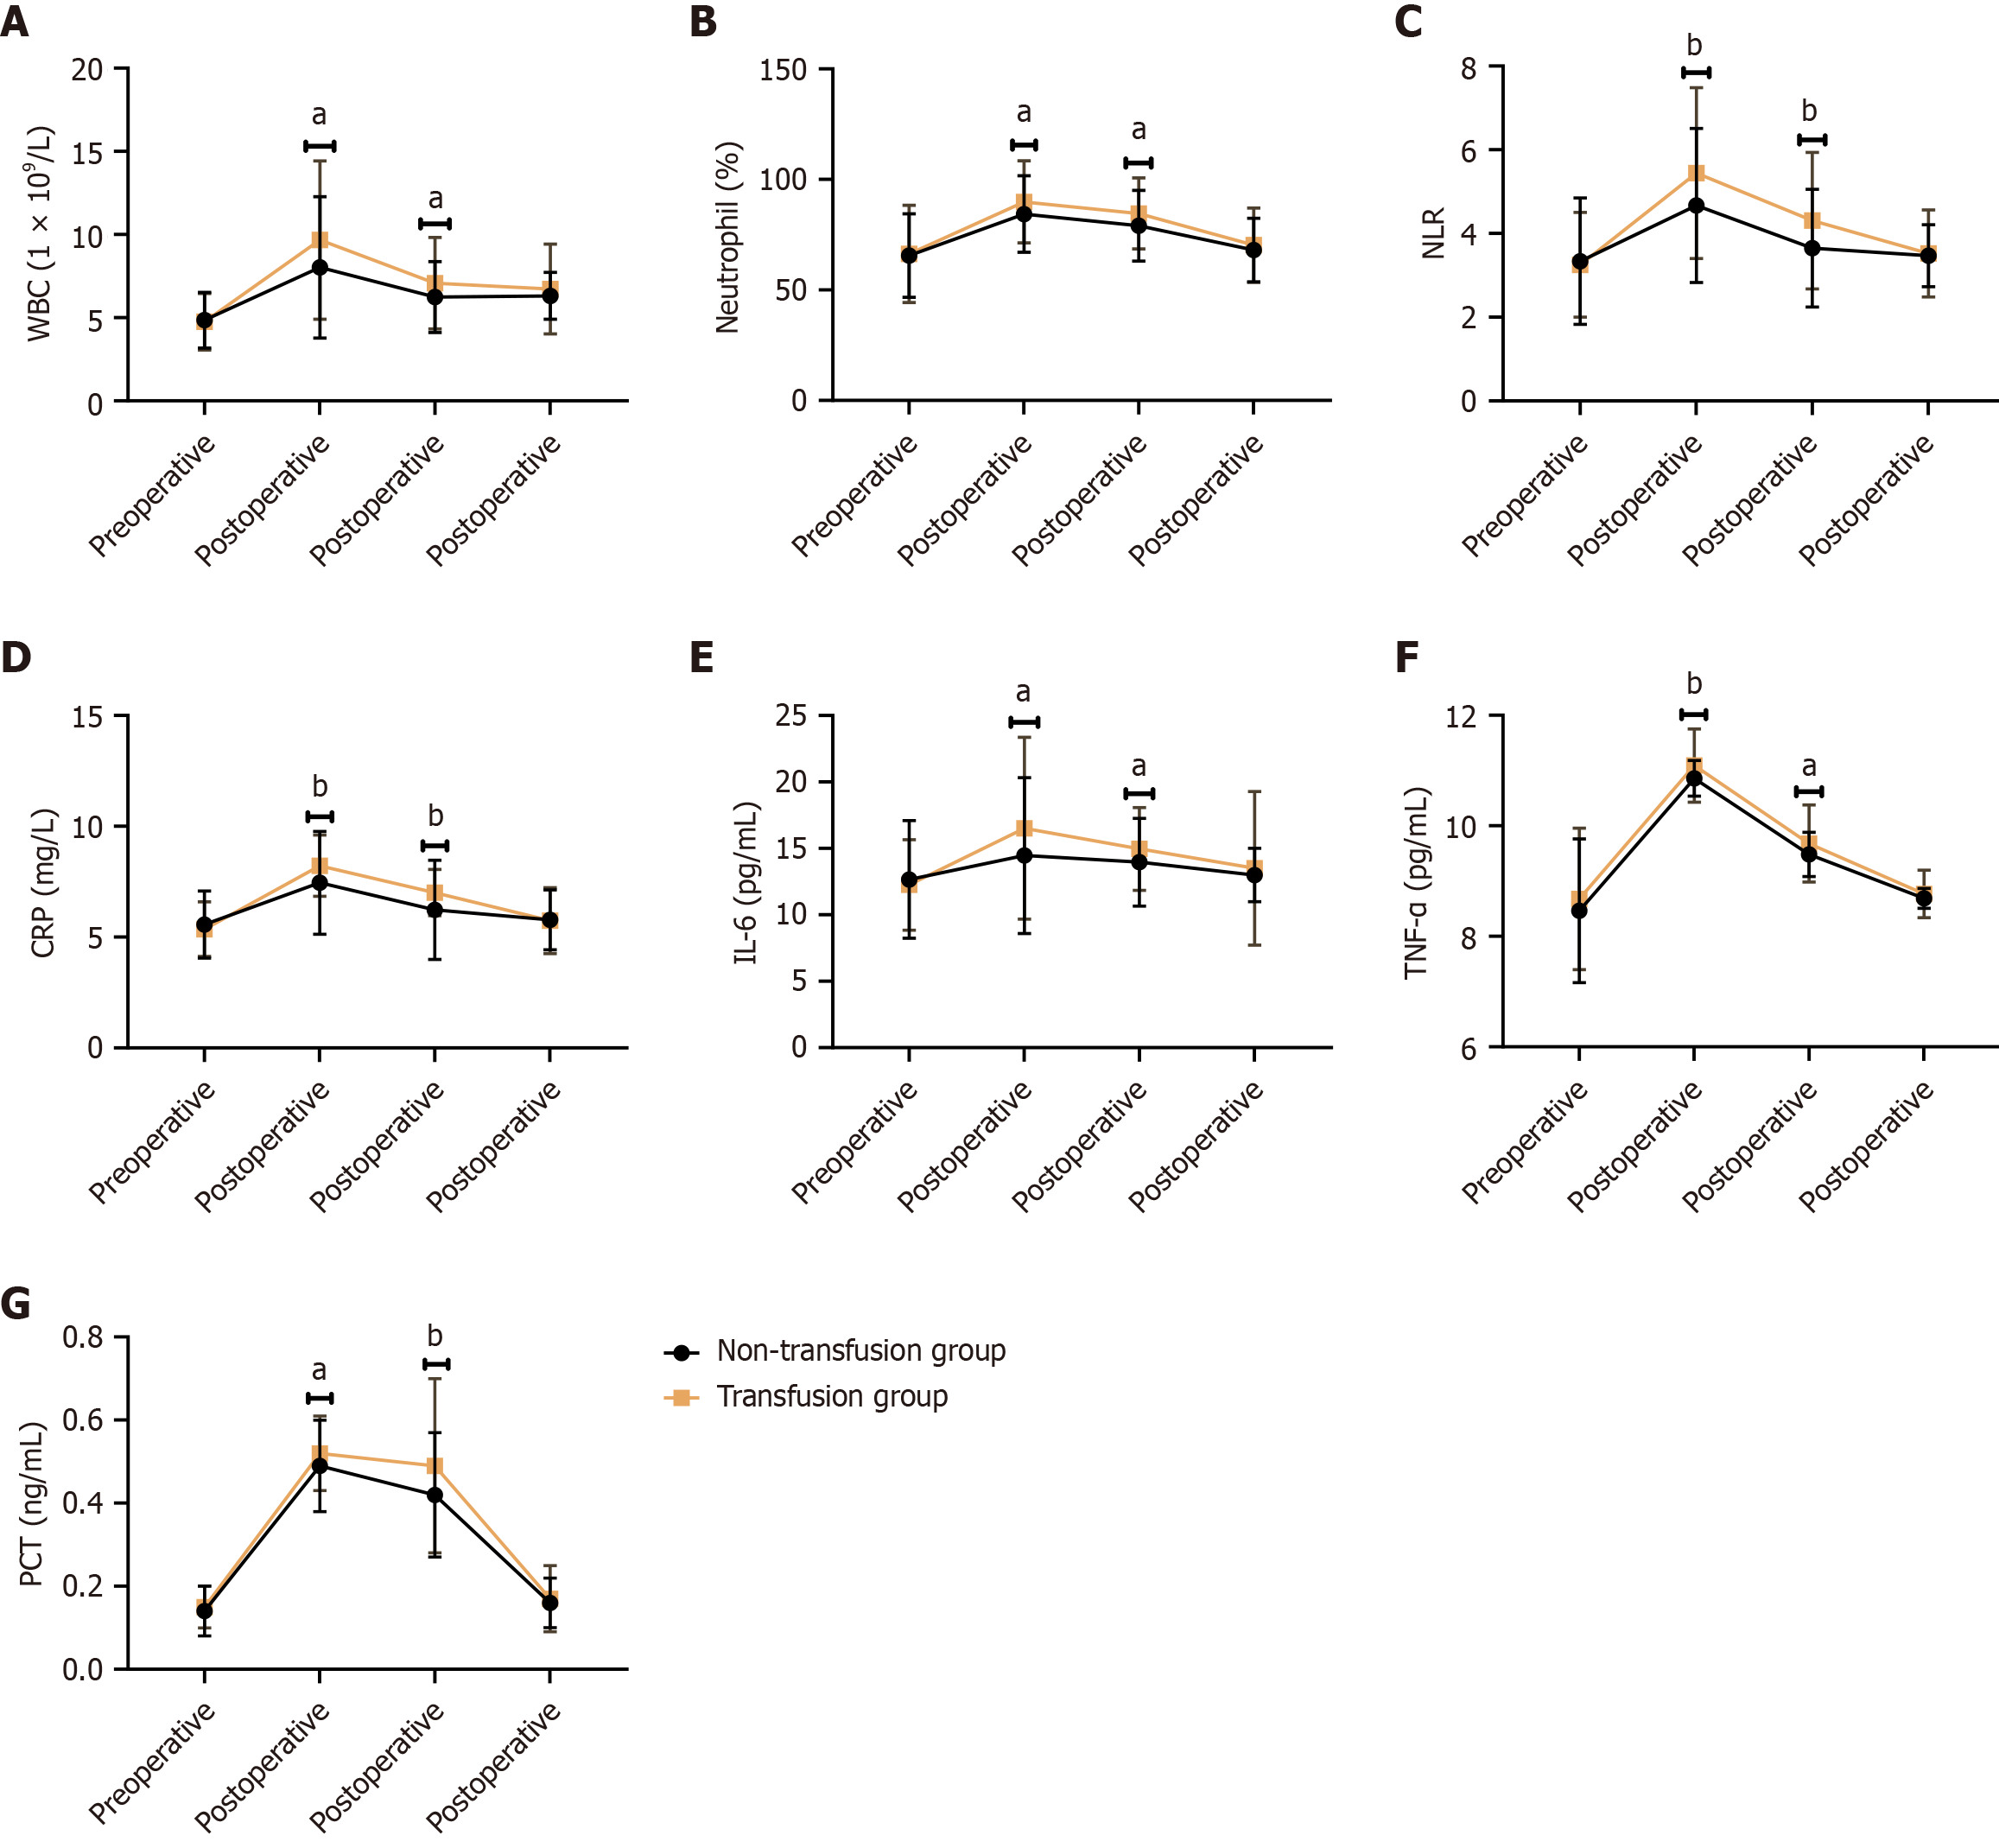
Figure 1 Comparison of inflammatory markers between two groups.
A: White blood cell count; B: Neutrophil; C: Neutrophil/Lymphocyte ratio; D: C-reactive protein; E: Interleukin-6; F: Tumor necrosis factor-alpha; G: Procalcitonin. aP < 0.05. bP < 0.01. WBC: White blood cell count; NLR: Neutrophil/Lymphocyte ratio; CRP: C-reactive protein; IL-6: Interleukin-6; TNF-α: Tumor necrosis factor-alpha; PCT: Procalcitonin.
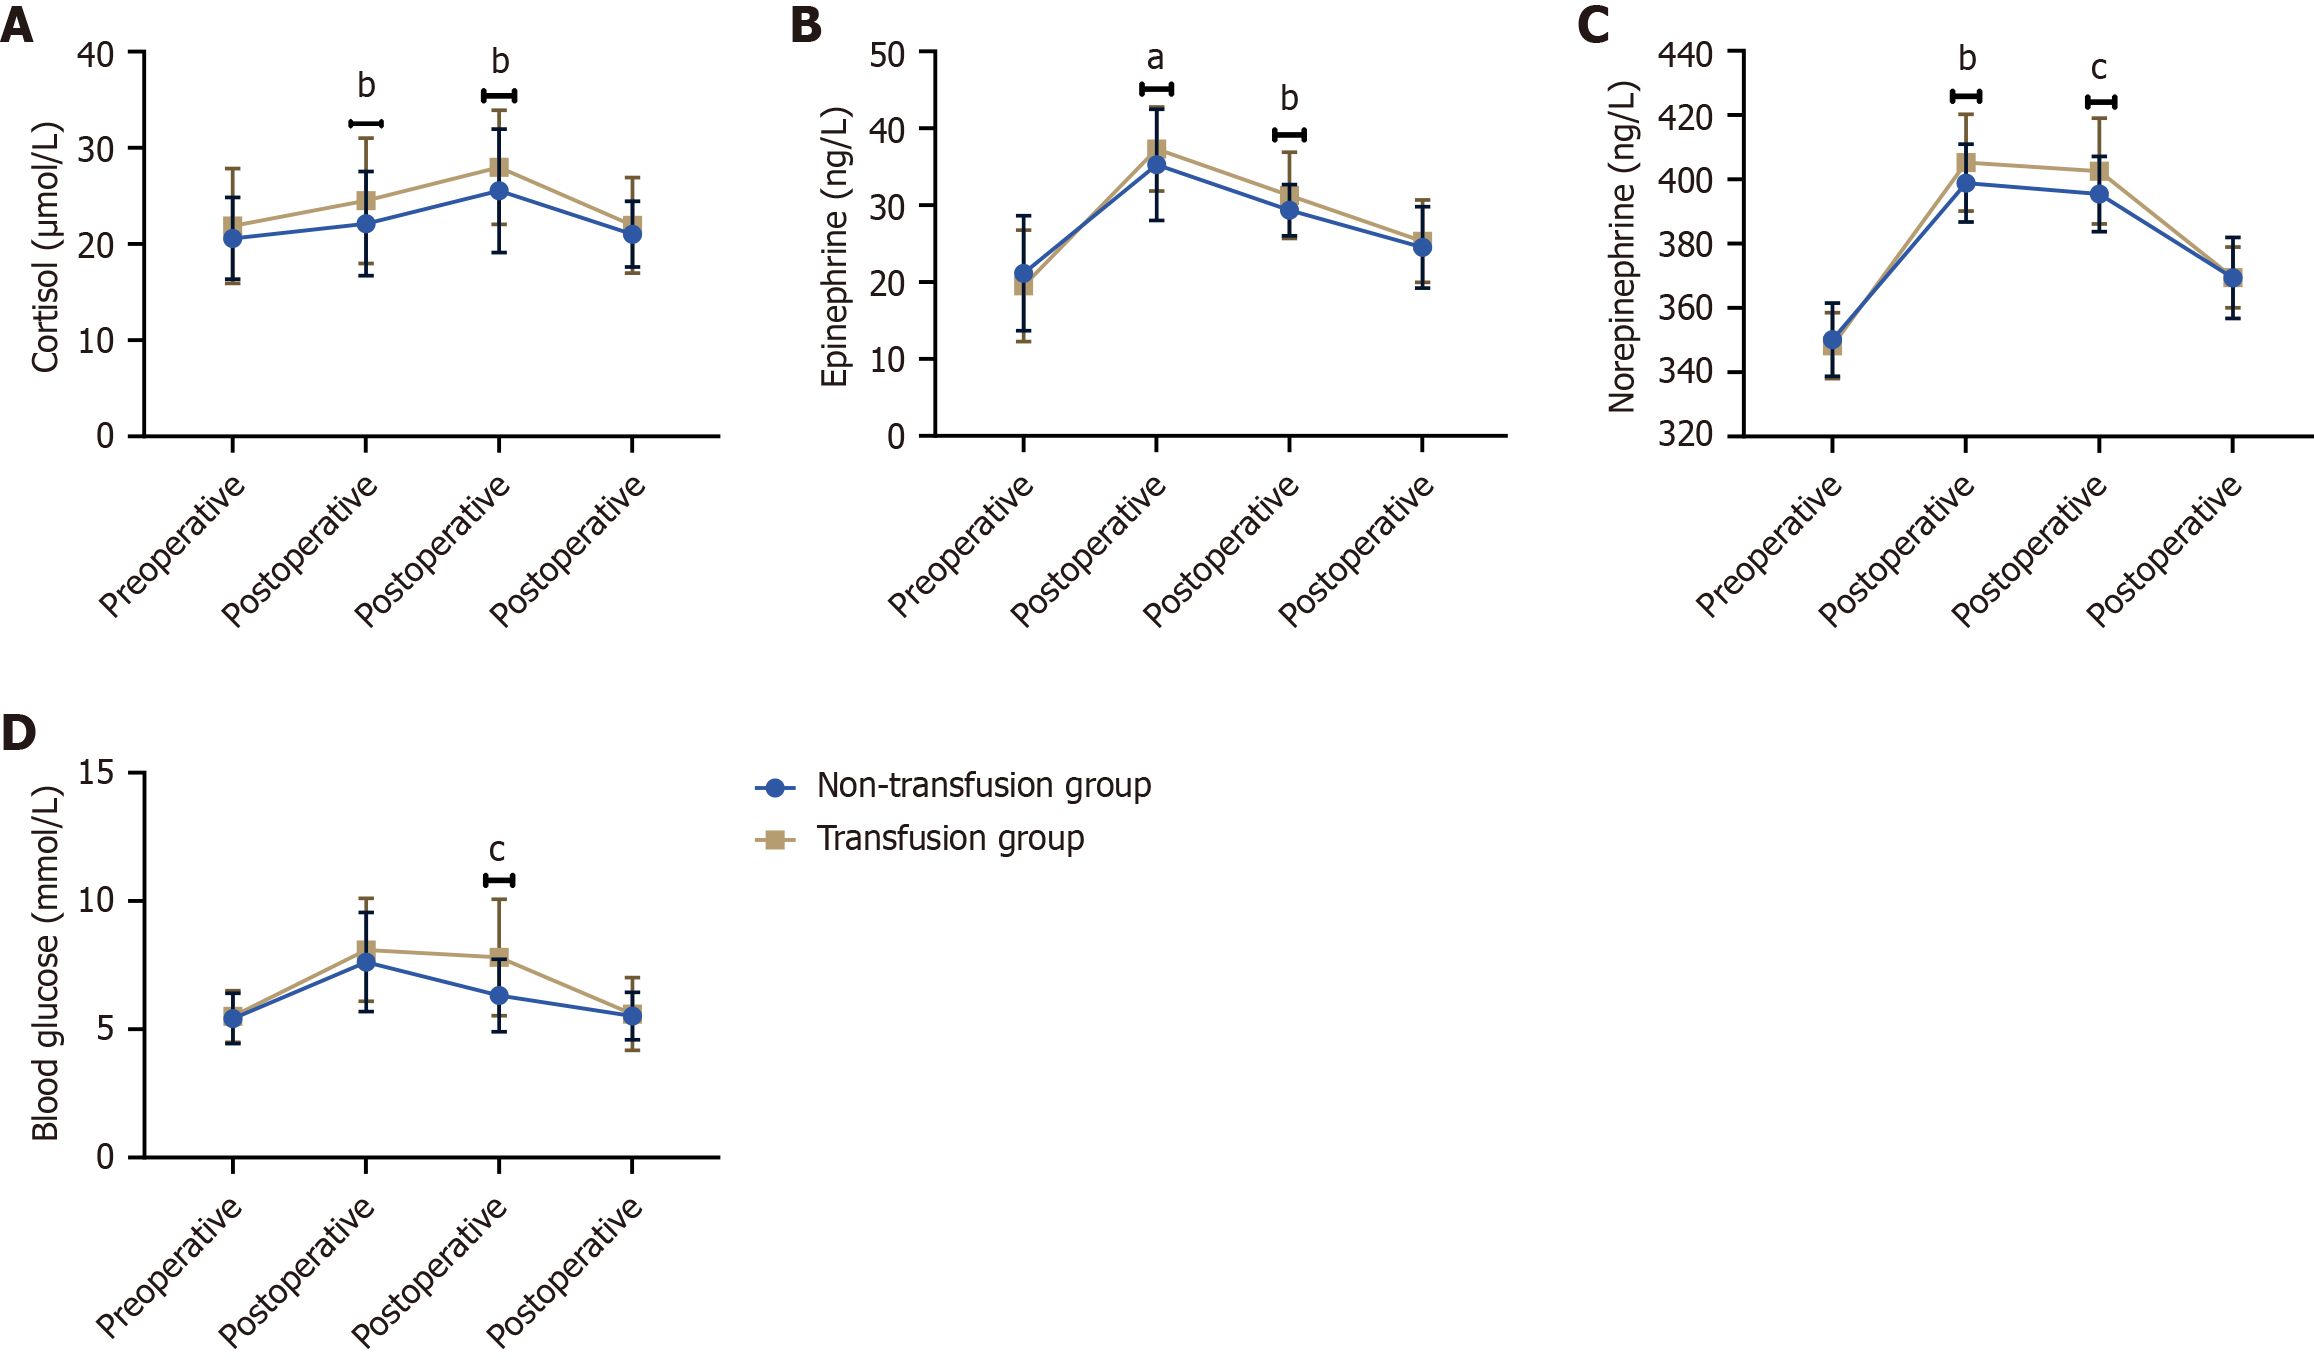
Figure 2 Comparison of stress markers between two groups.
A: Cortisol; B: Epinephrine; C: Norepinephrine; D: Blood glucose. aP < 0.05. bP < 0.01. cP < 0.001.
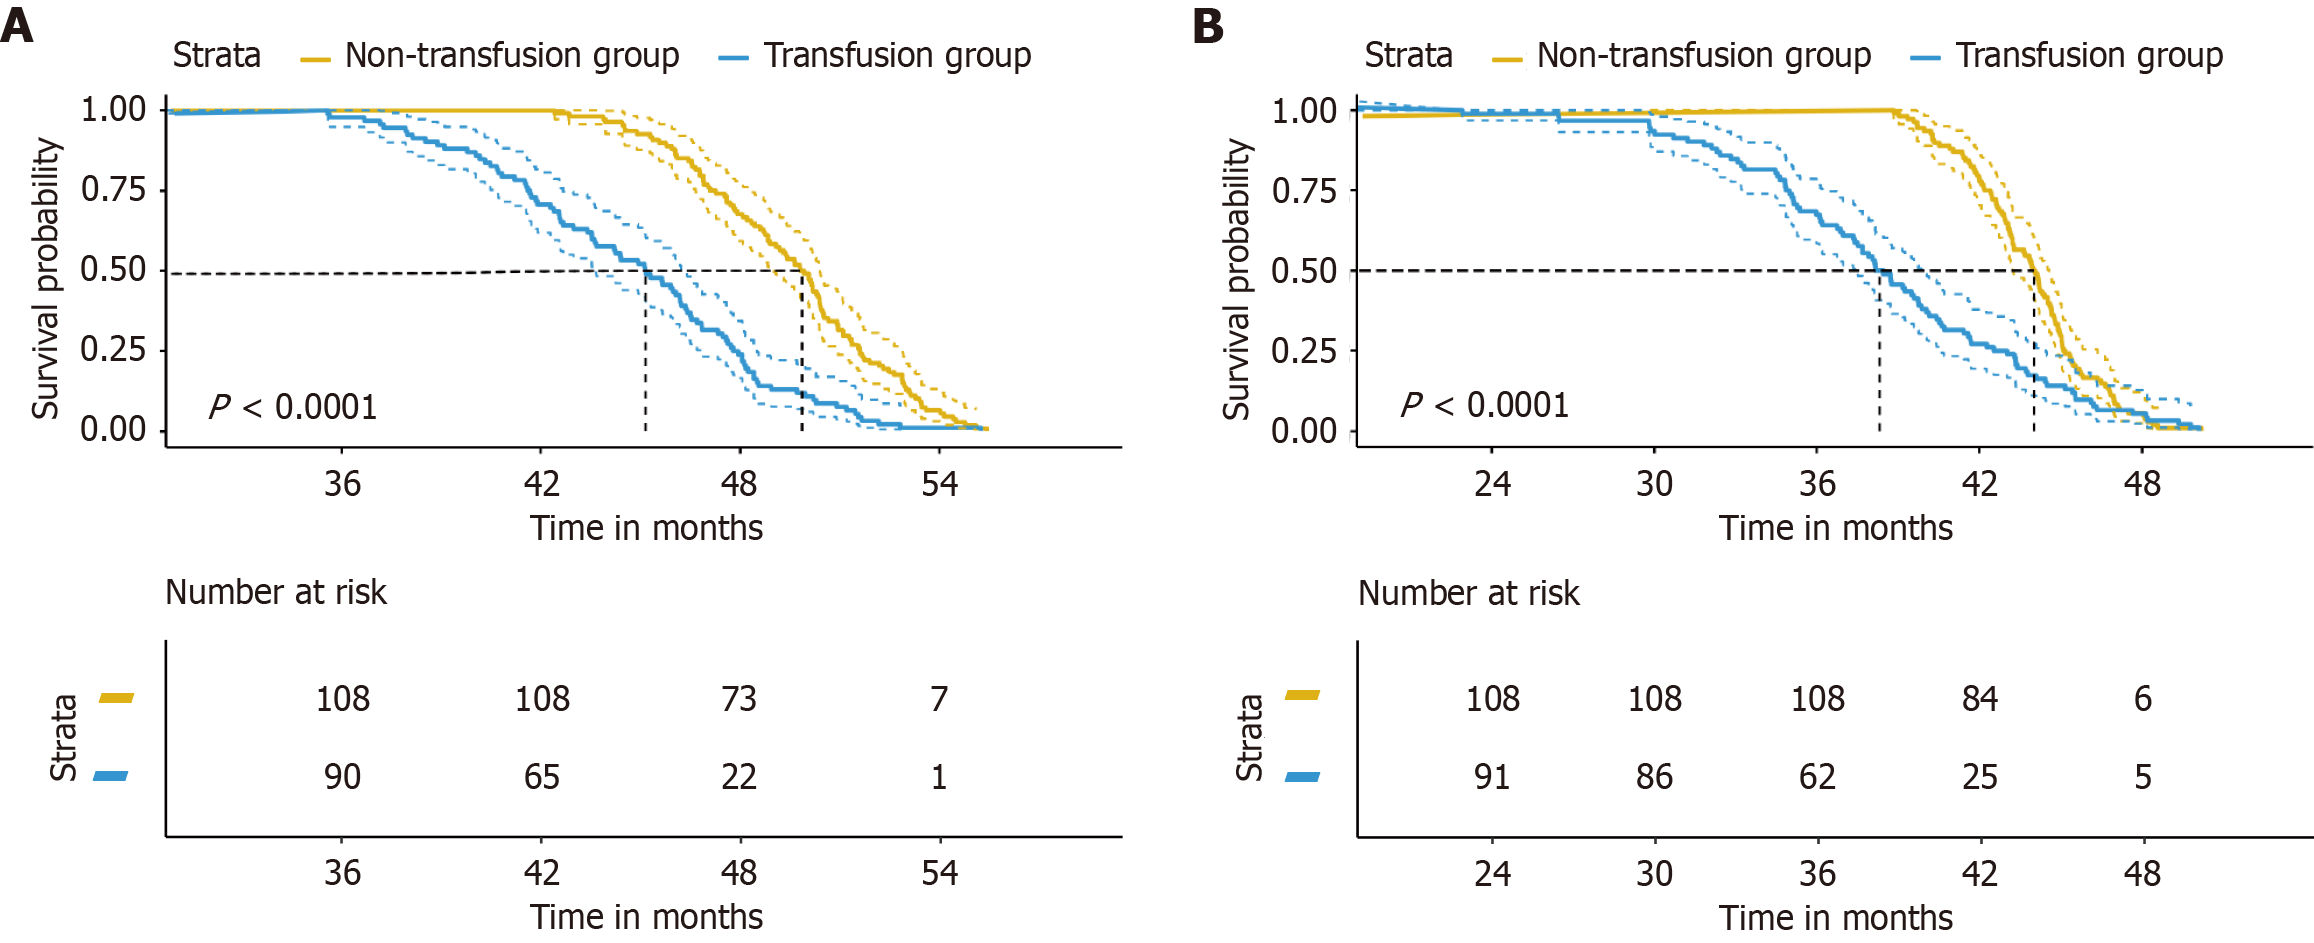
Figure 3 Postoperative survival analysis between the transfusion group and non-transfusion group.
A: Overall survival; B: Disease-free survival.
- Citation: Chen YQ, Chen JH, Zhang YX, Fu LL, Luo XS. Influence of blood transfusion on postoperative inflammation, stress markers, and prognosis in patients with gastric cancer. World J Gastroenterol 2025; 31(39): 110751
- URL: https://www.wjgnet.com/1007-9327/full/v31/i39/110751.htm
- DOI: https://dx.doi.org/10.3748/wjg.v31.i39.110751


