Copyright
©The Author(s) 2025.
World J Gastroenterol. Oct 7, 2025; 31(37): 110786
Published online Oct 7, 2025. doi: 10.3748/wjg.v31.i37.110786
Published online Oct 7, 2025. doi: 10.3748/wjg.v31.i37.110786
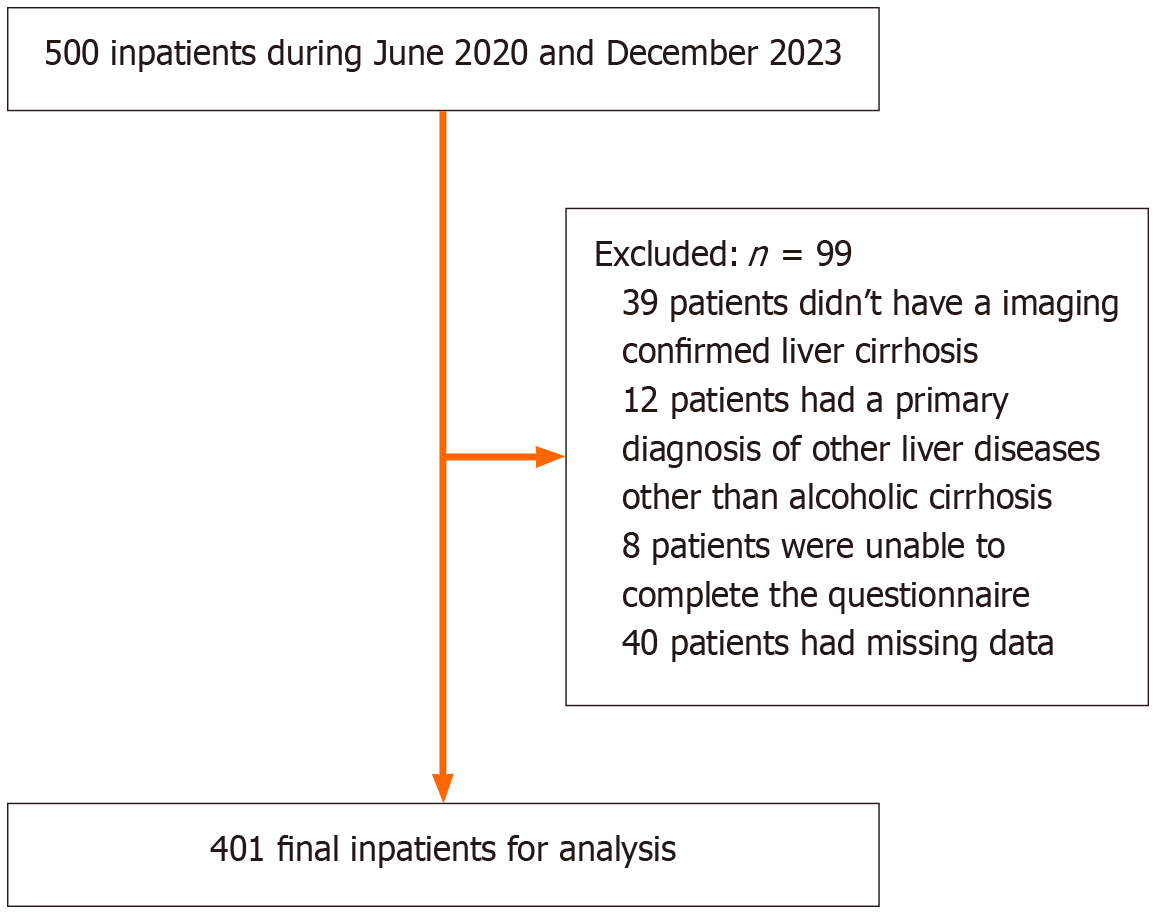
Figure 1
The flowchart of eligible patients.
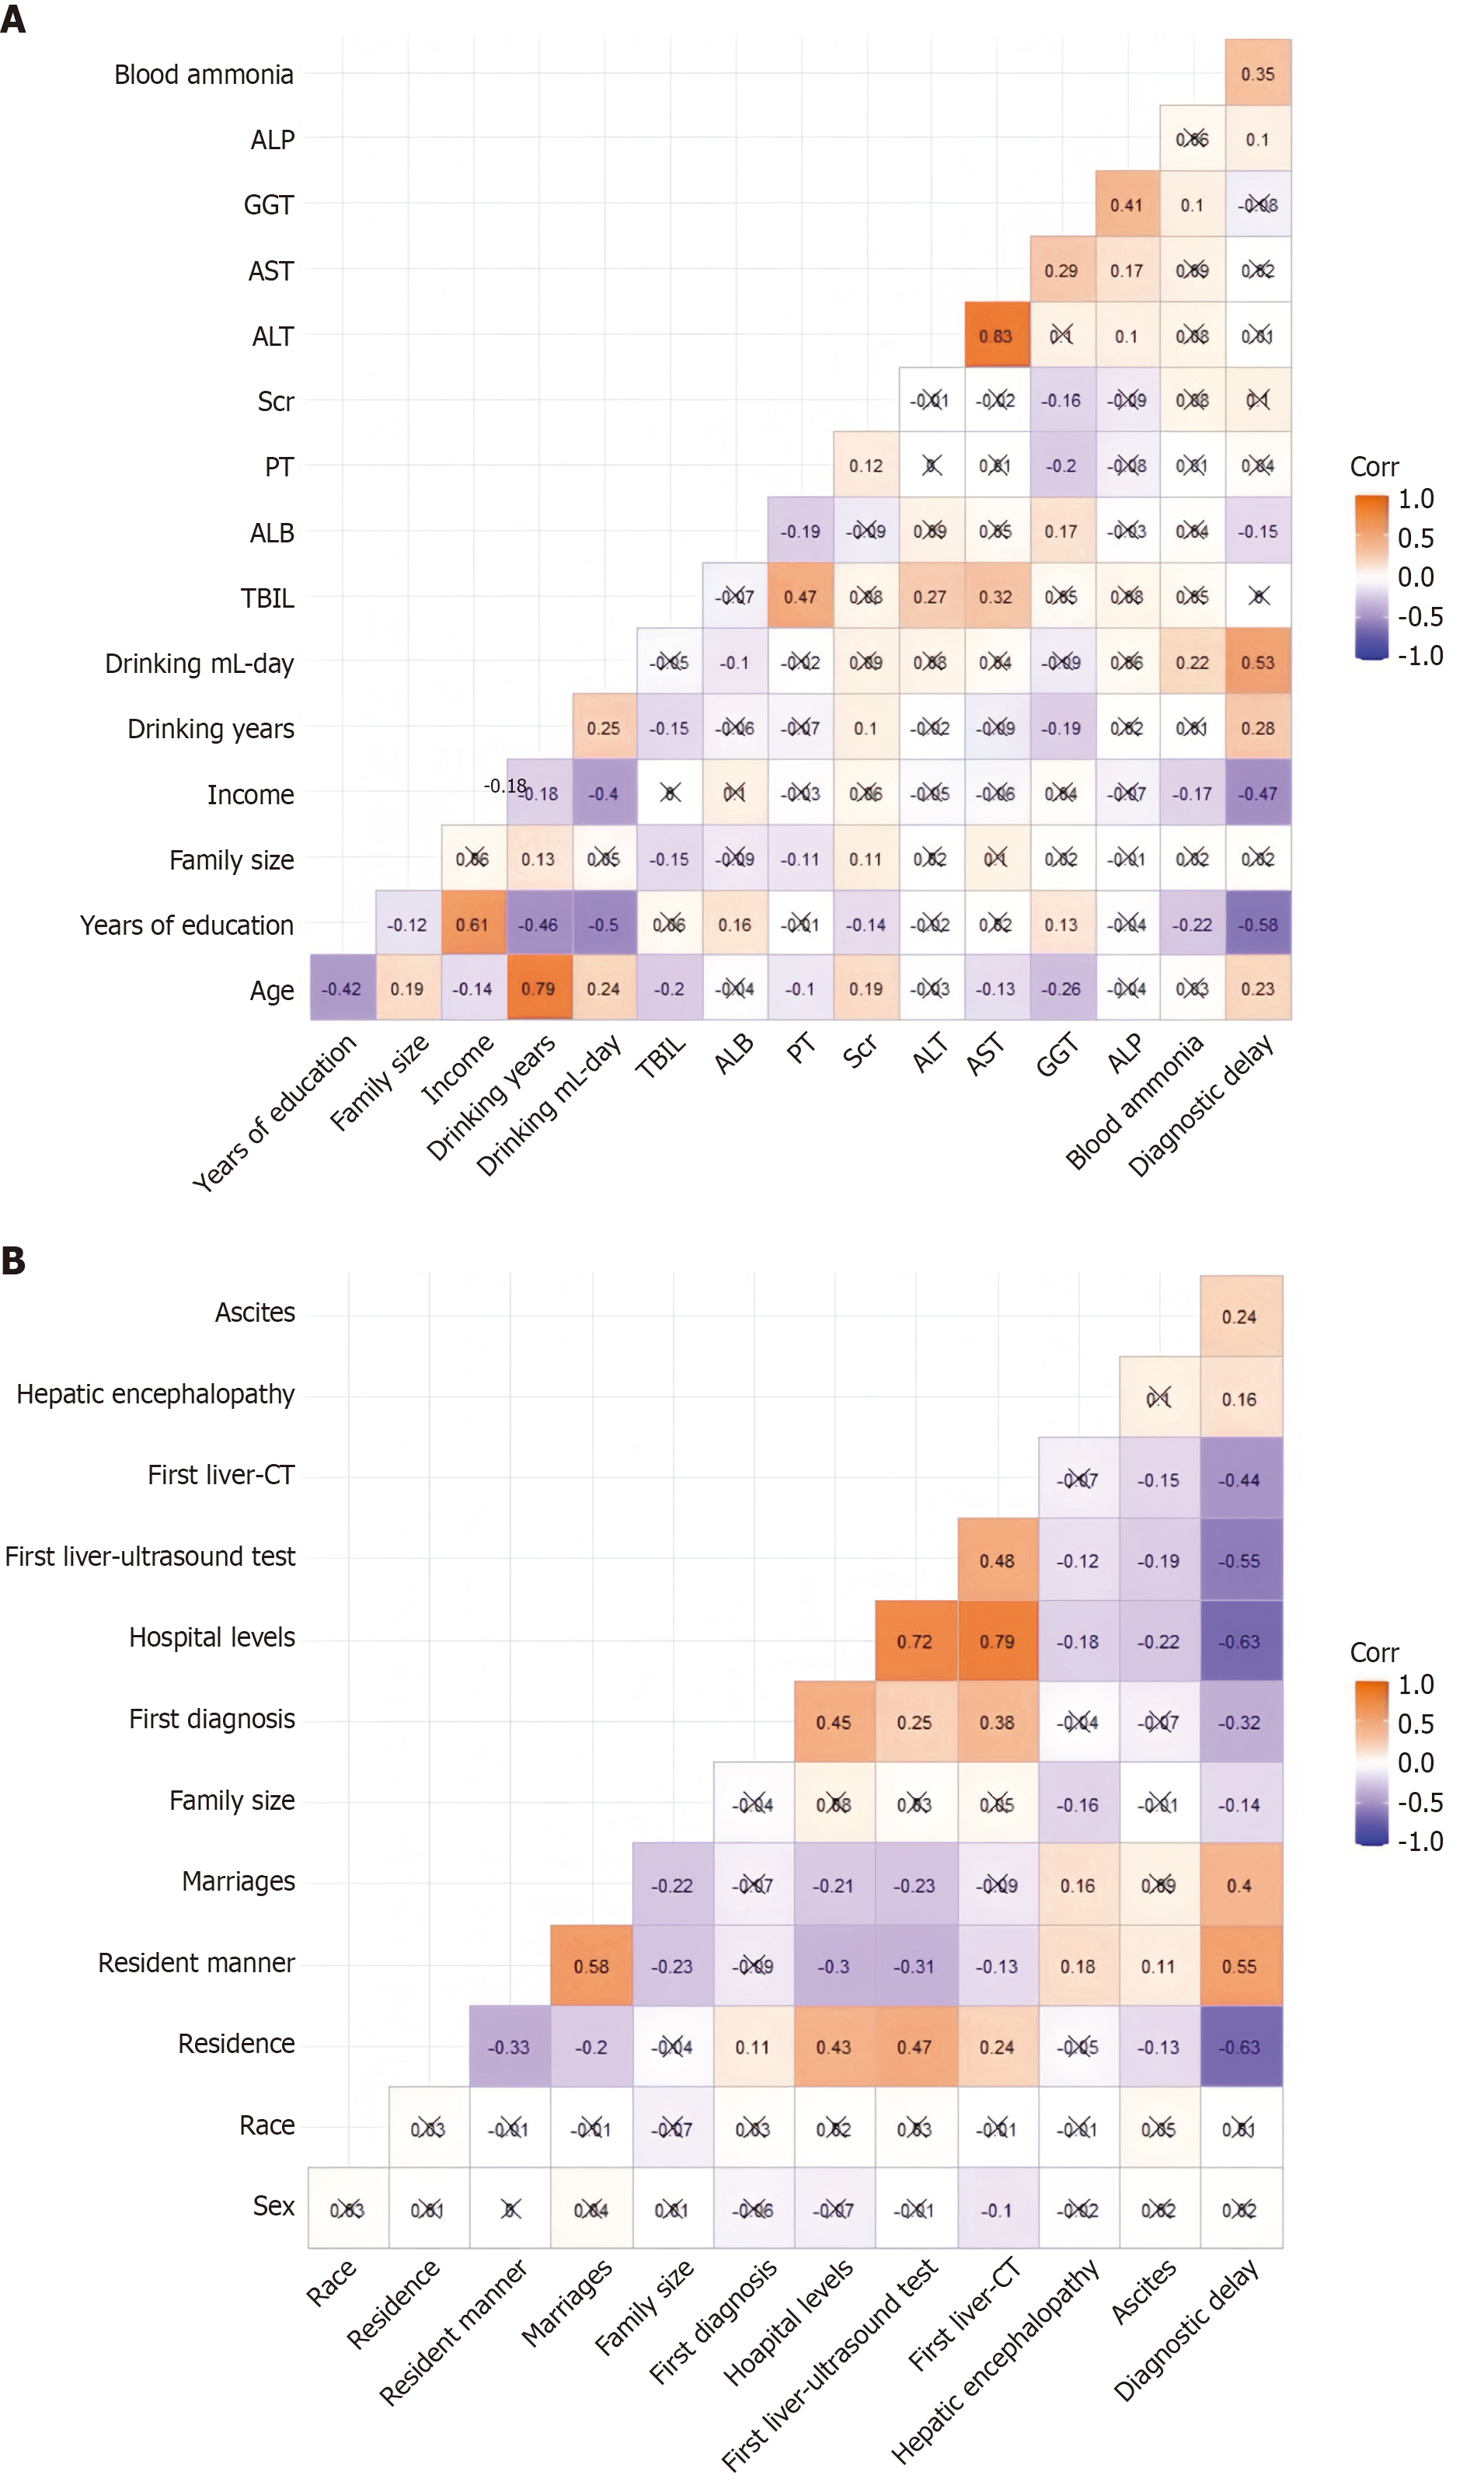
Figure 2 Correlation analysis between diagnostic delay and demographics and clinical characteristics.
A: Numerical variables; B: Categorical variable. ALP: Alkaline phosphatase; GGT: Glutamyl transpeptidase; AST: Glutamic oxaloacetic transaminase; ALT: Glutamic-pyruvic transaminase; Scr: Serum creatinine; PT: Prothrombin time; ALB: Albumin; TBIL: Total bilirubin; CT: Computed tomography.
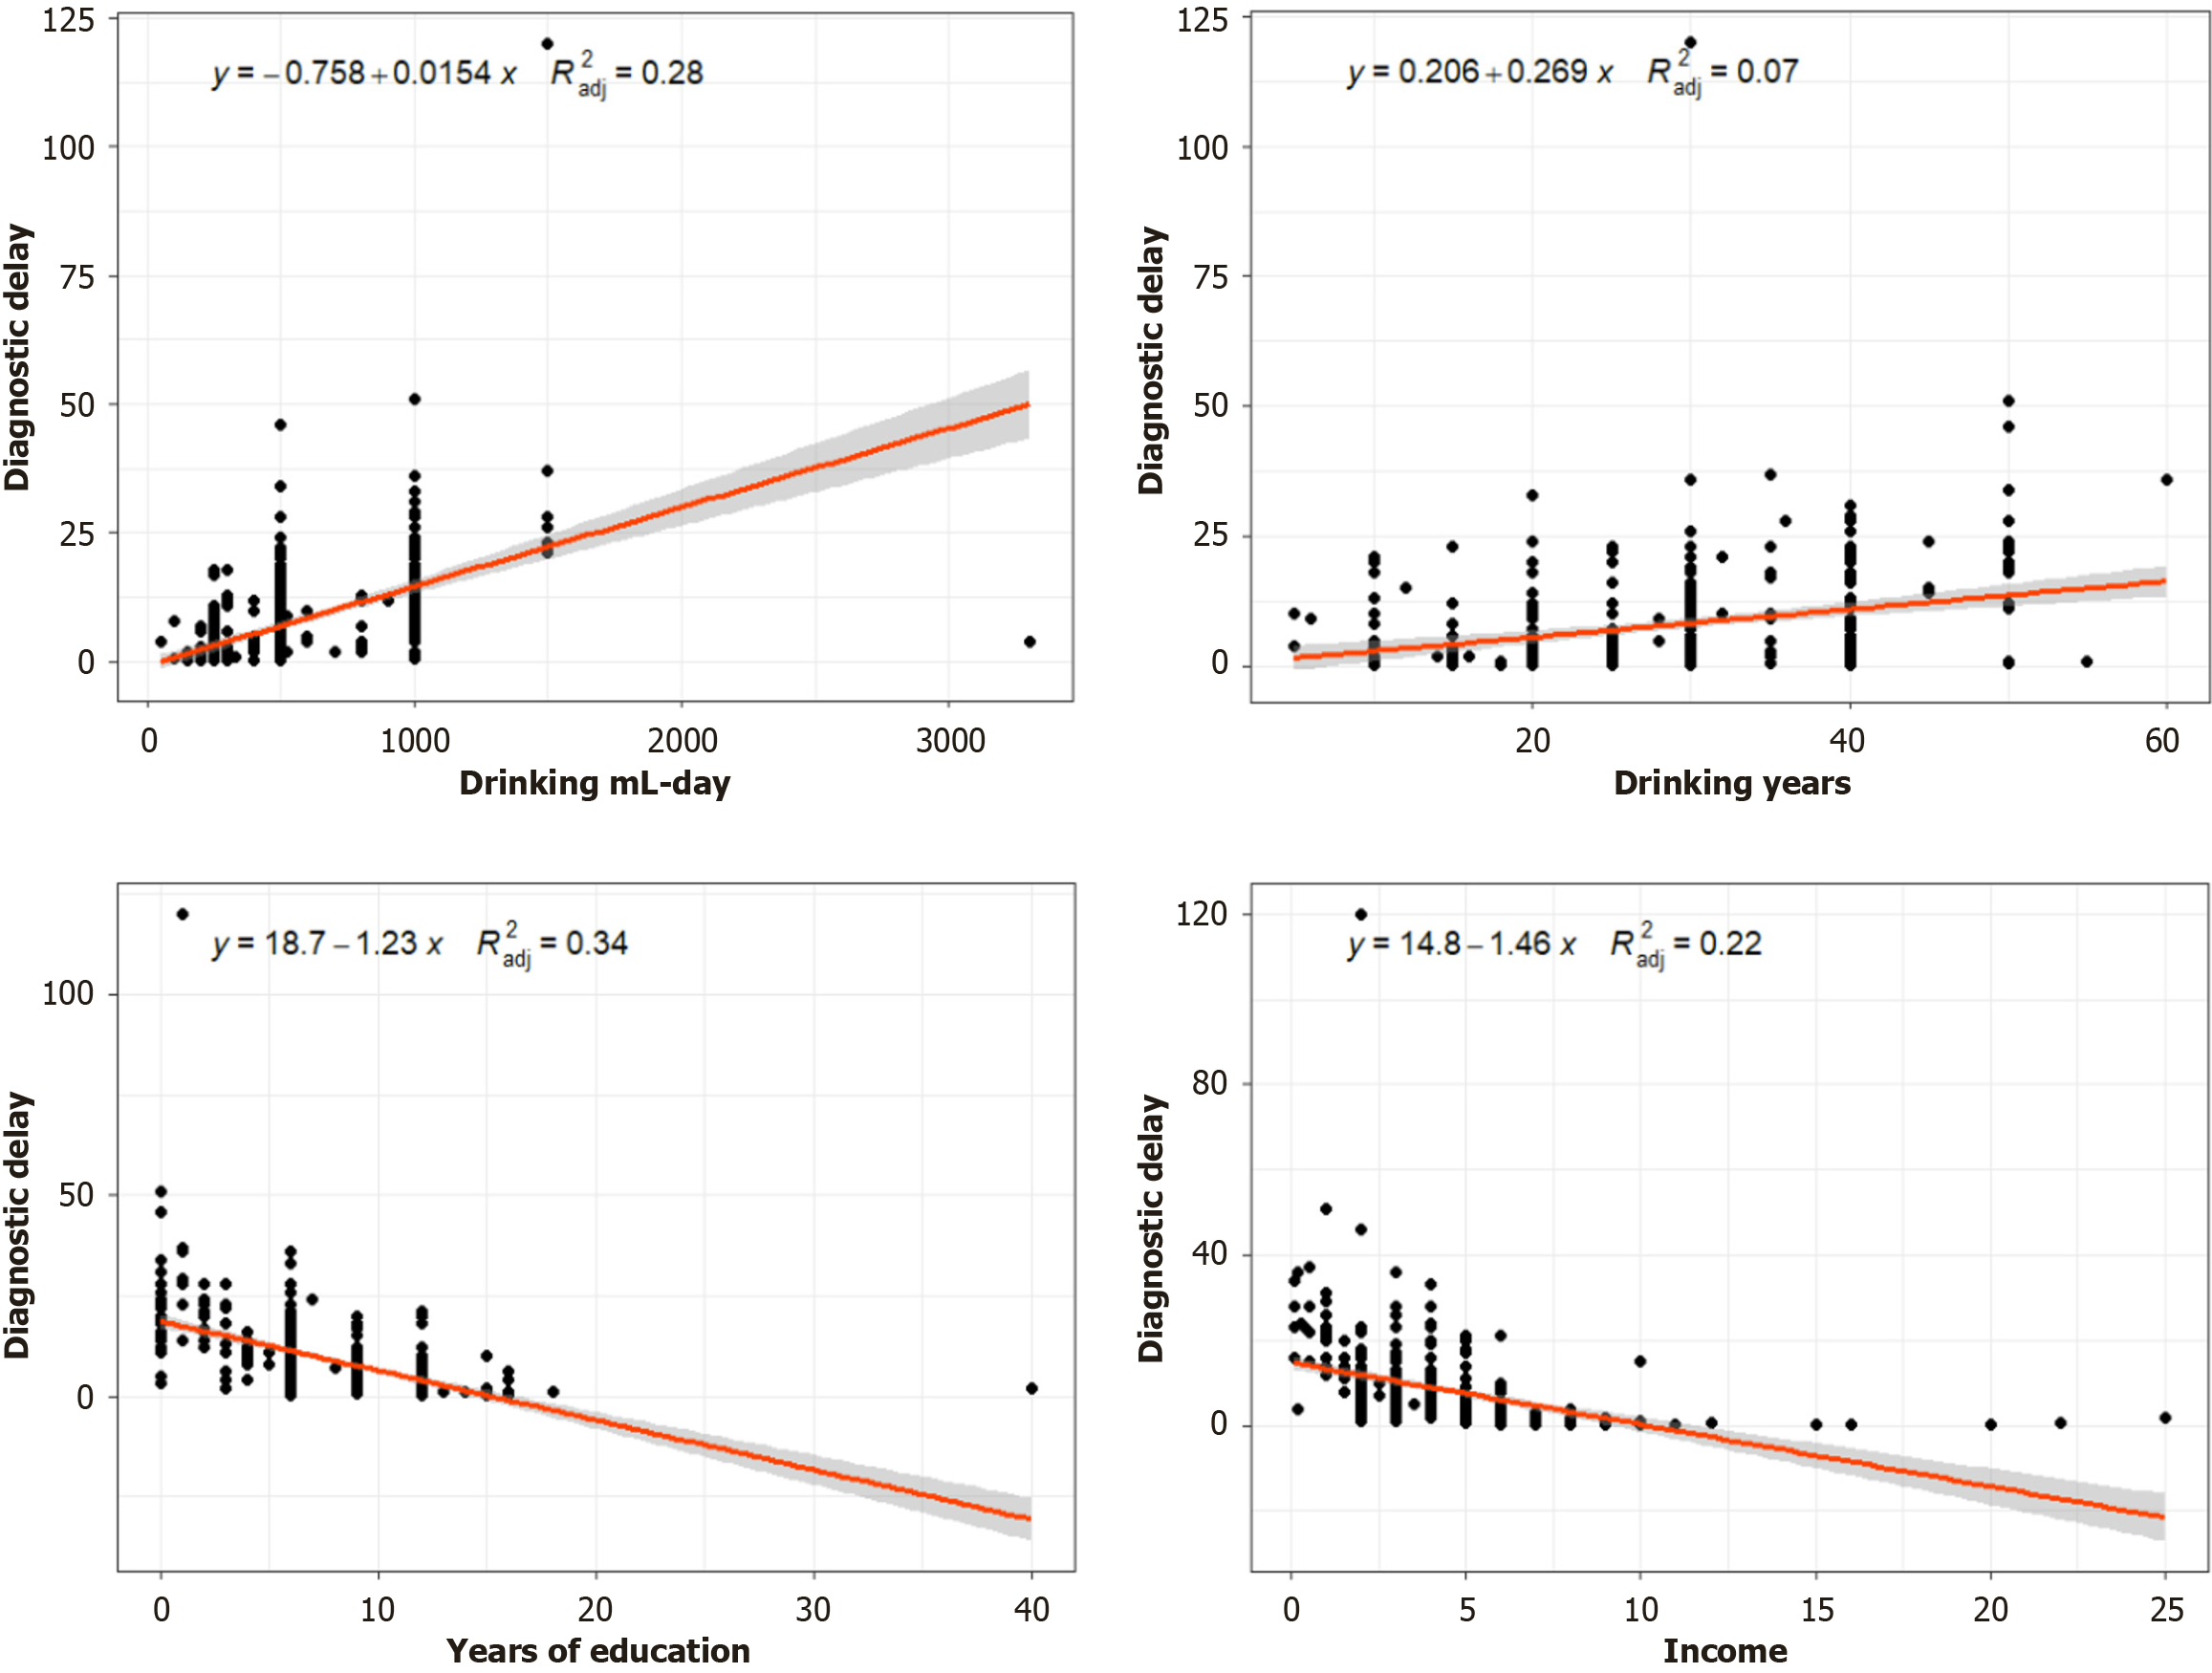
Figure 3
Univariate linear regression analysis of drinking ml-day, drinking years, years of education, and income related to diagnostic delay.
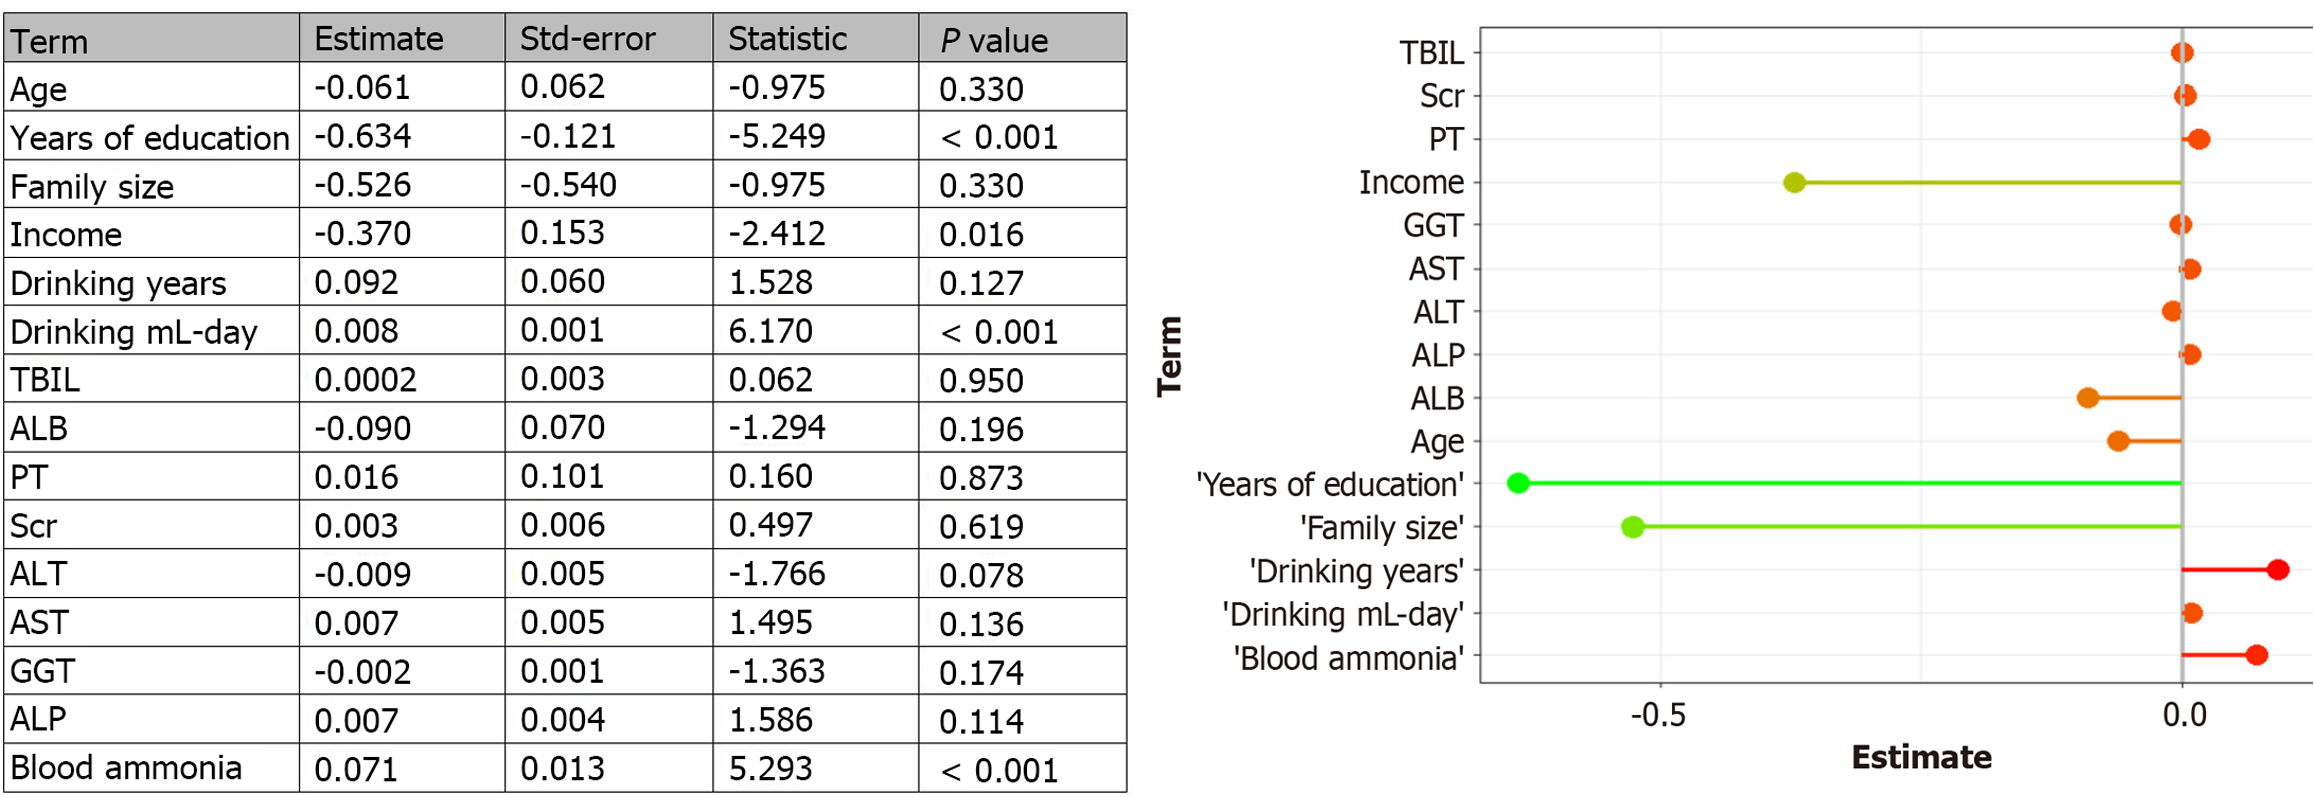
Figure 4 Multivariable linear regression analysis of potential factors related to diagnostic delay.
ALP: Alkaline phosphatase; GGT: Glutamyl transpeptidase; AST: Glutamic oxaloacetic transaminase; ALT: Glutamic-pyruvic transaminase; Scr: Serum creatinine; PT: Prothrombin time; ALB: Albumin; TBIL: Total bilirubin.
- Citation: Dai ZS, Gao Z, He B, Jiang YF. Diagnostic delays in alcoholic cirrhosis: A cross-sectional study of contributing factors. World J Gastroenterol 2025; 31(37): 110786
- URL: https://www.wjgnet.com/1007-9327/full/v31/i37/110786.htm
- DOI: https://dx.doi.org/10.3748/wjg.v31.i37.110786


