Copyright
©The Author(s) 2025.
World J Gastroenterol. Sep 28, 2025; 31(36): 111293
Published online Sep 28, 2025. doi: 10.3748/wjg.v31.i36.111293
Published online Sep 28, 2025. doi: 10.3748/wjg.v31.i36.111293
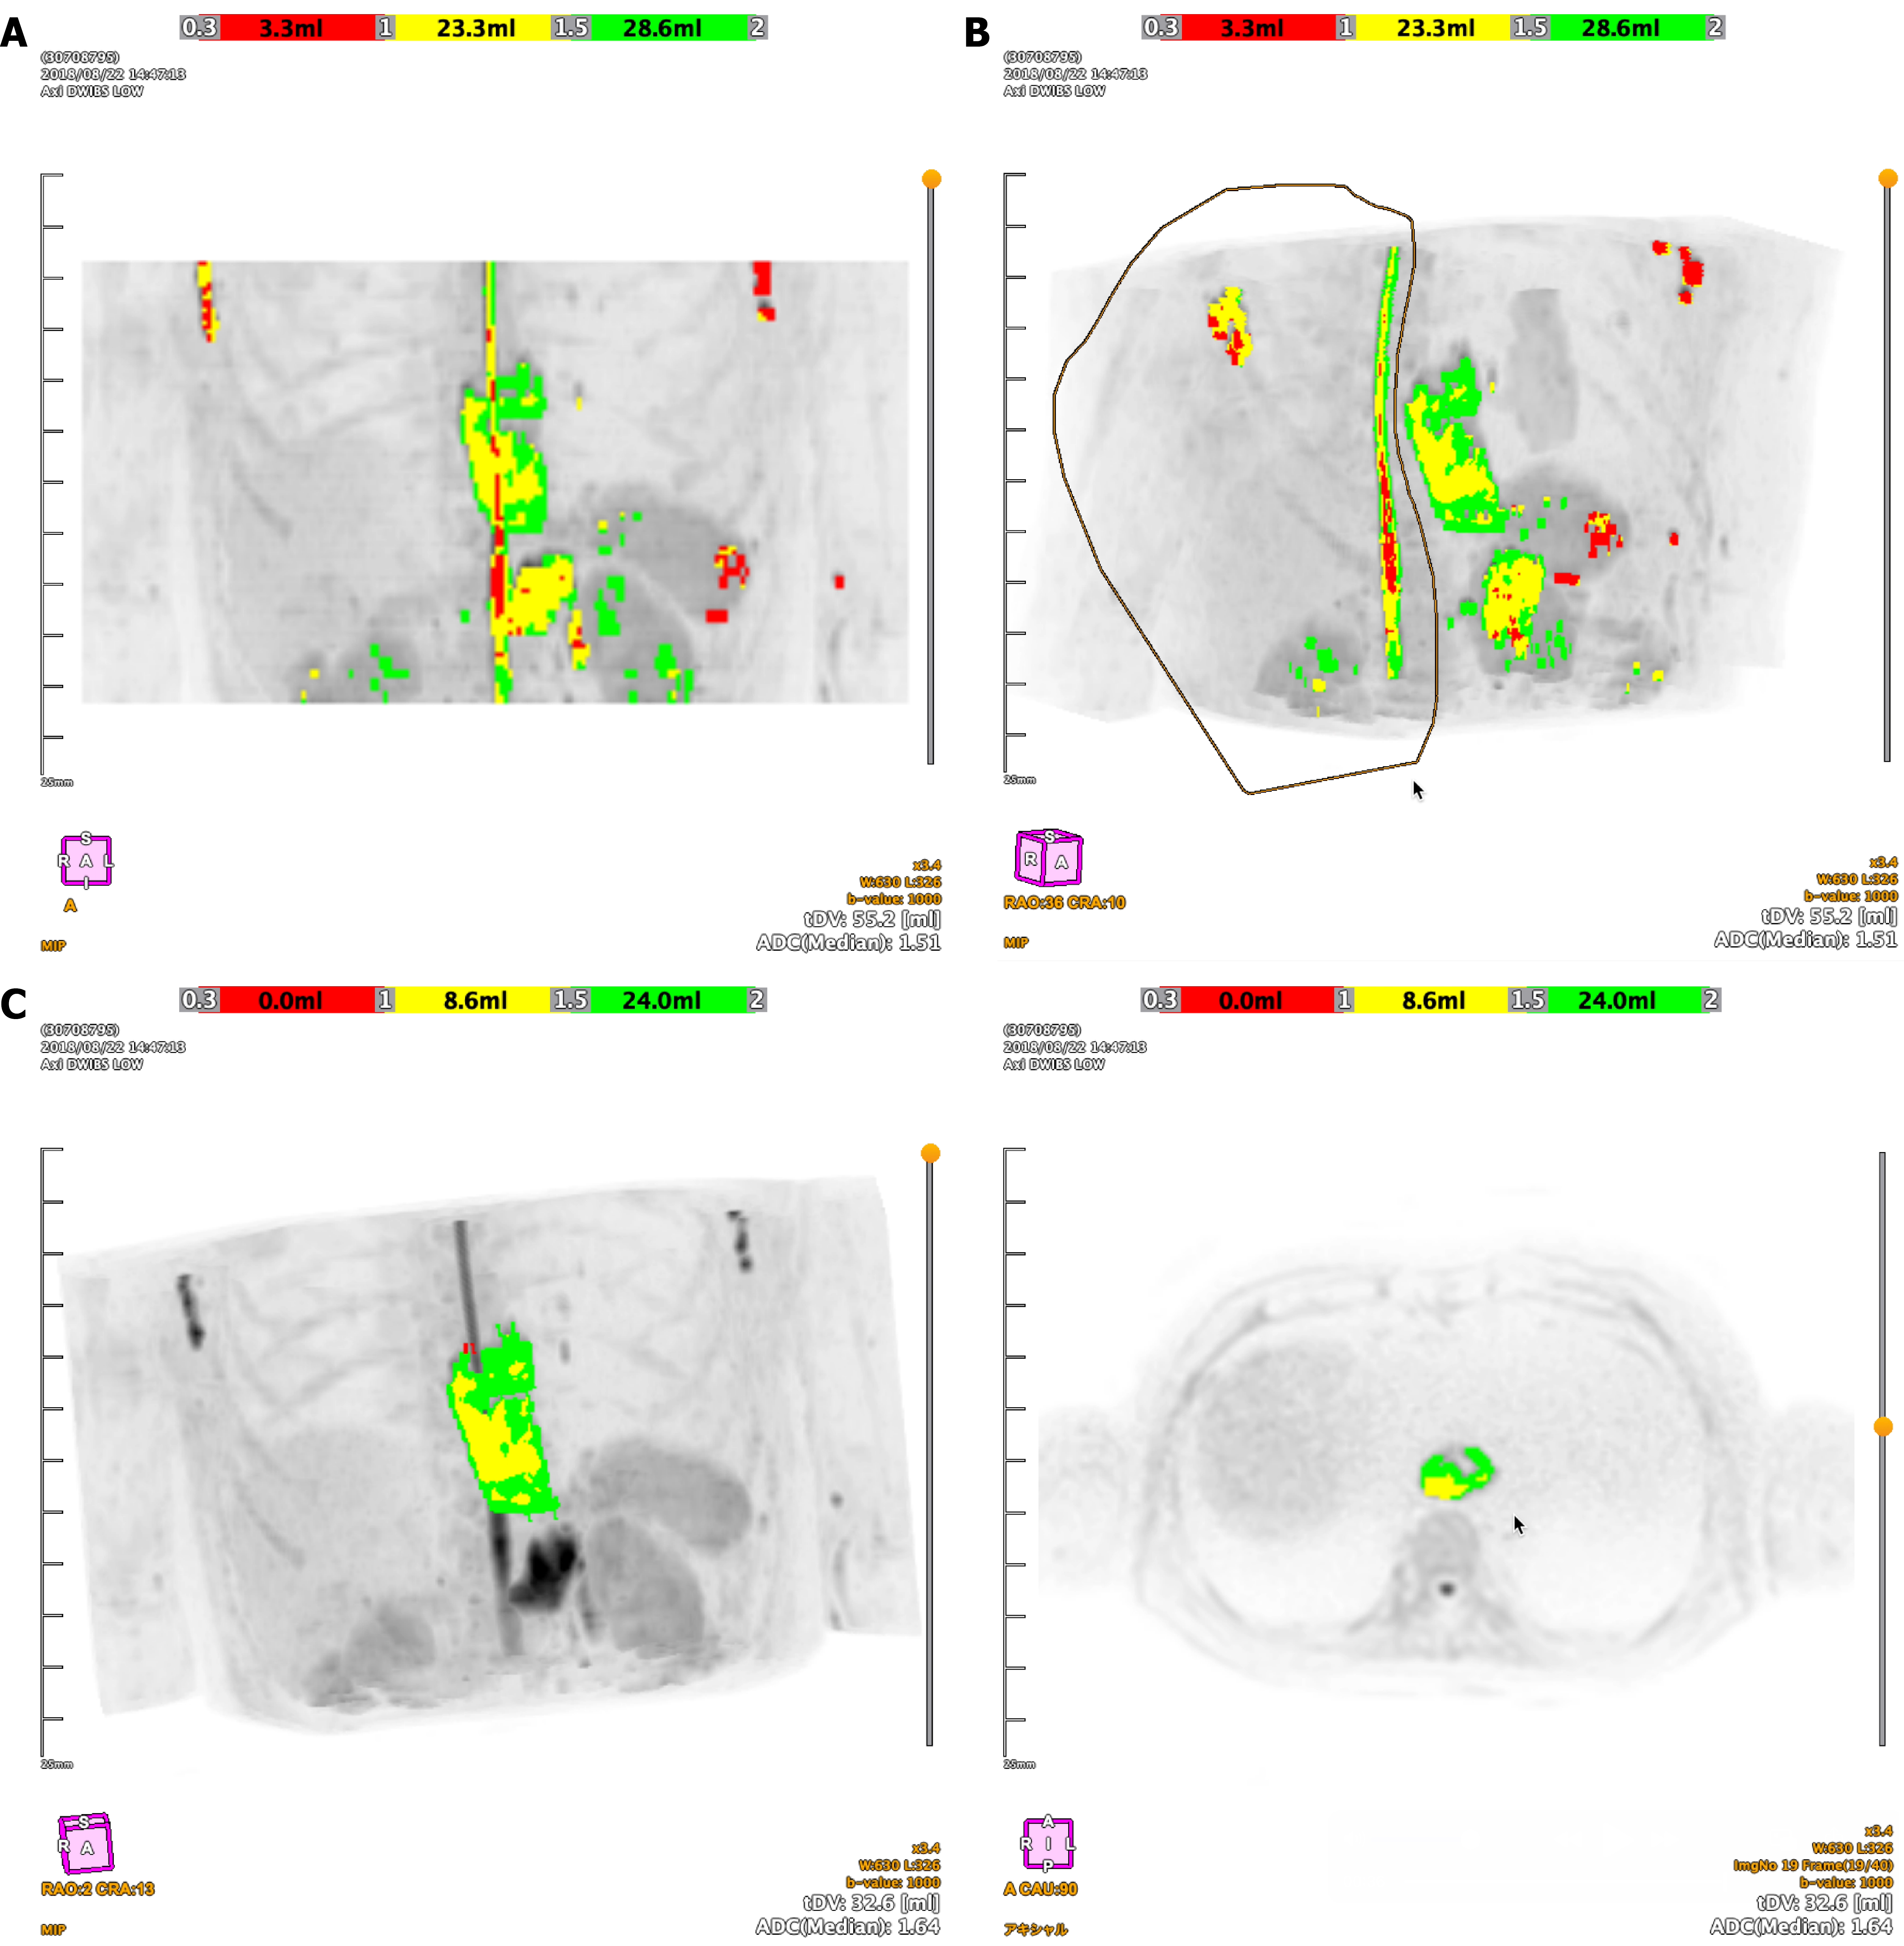
Figure 1 Workflow of semi-automated three dimensions tumor segmentation using BD score software.
A: A maximum intensity projection (MIP) image showing high-signal intensity areas automatically extracted from diffusion-weighted imaging; B: A MIP image demonstrating the manual editing process to exclude non-tumorous hyperintense structures from the initial automated segmentation; C: The final three dimensions tumor volume for radiomics analysis. The color overlay on the MIP (left) and axial (right) images corresponds to apparent diffusion coefficient values: Red (0.3-1.0 × 10⁻³ mm²/second), yellow (1.0-1.5 × 10⁻³ mm²/second), and green (1.5-2.0 × 10⁻³ mm²/second). ADC: Apparent diffusion coefficient; MIP: Maximum intensity projection.
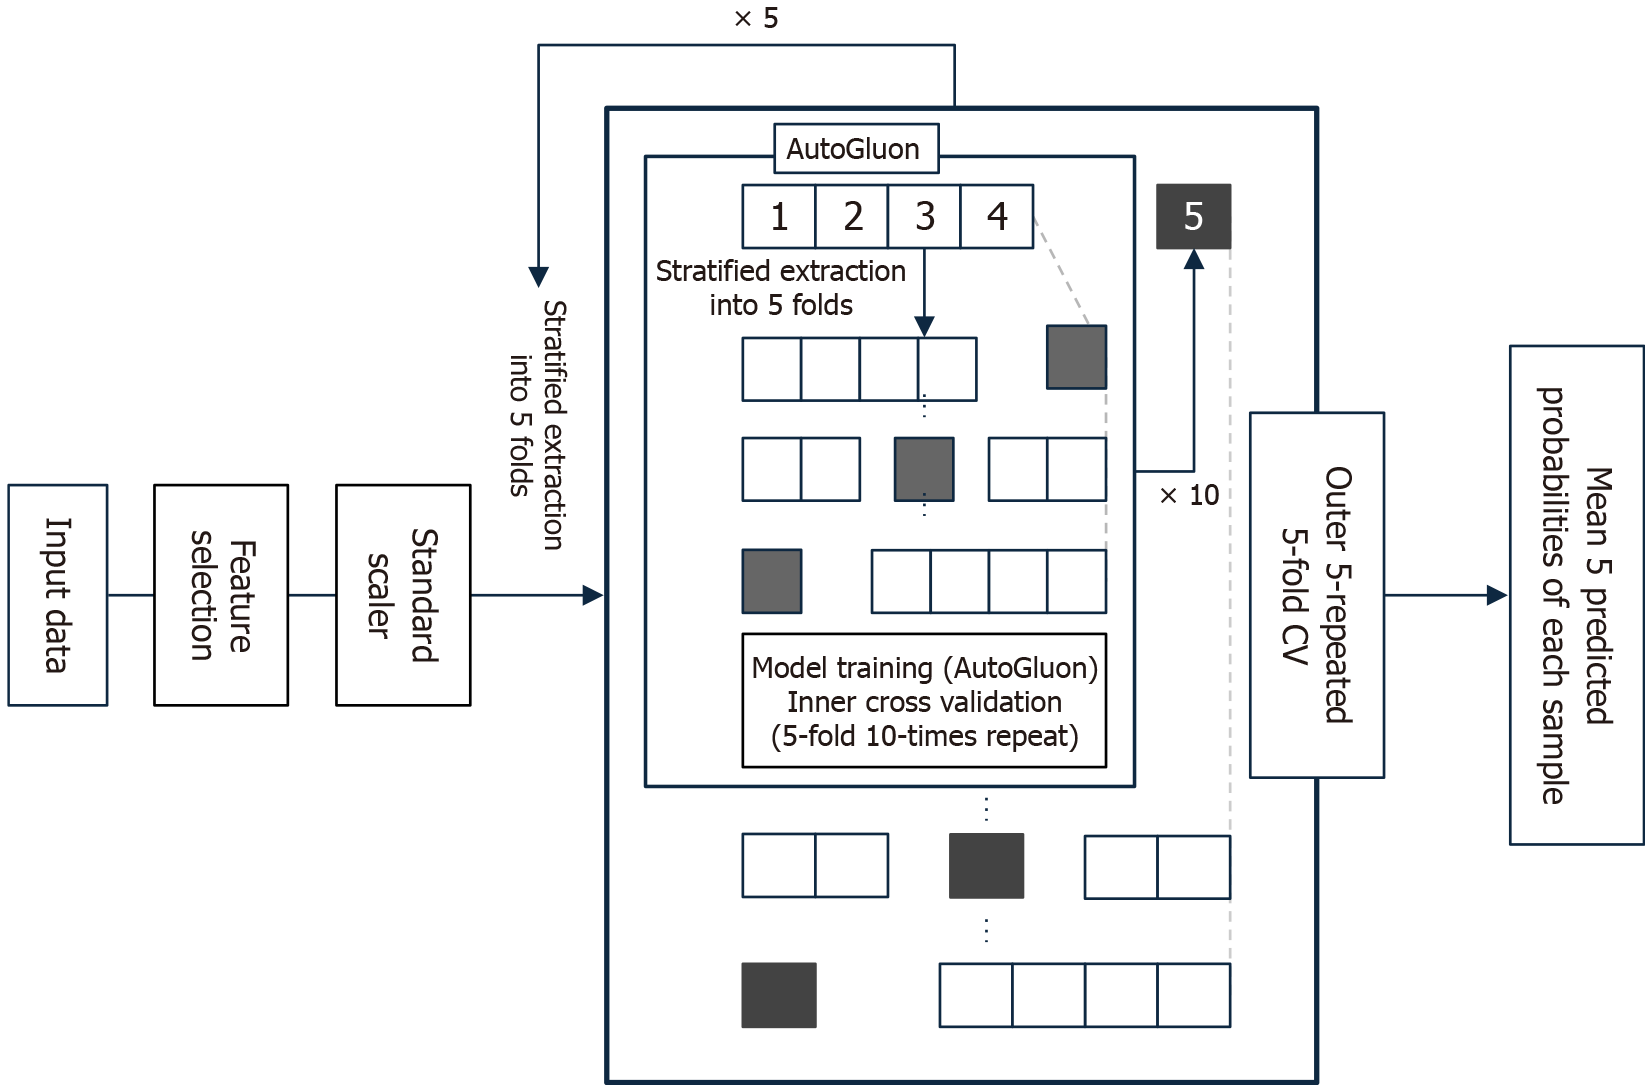
Figure 2 Schematic of the nested cross-validation framework for model development and evaluation.
After feature selection and standardization, a nested cross-validation framework was applied. The outer loop evaluated the model’s generalization performance, while the inner loop used AutoGluon, an automated machine learning framework, for feature selection and hyperparameter tuning. CV: Cross-validation.
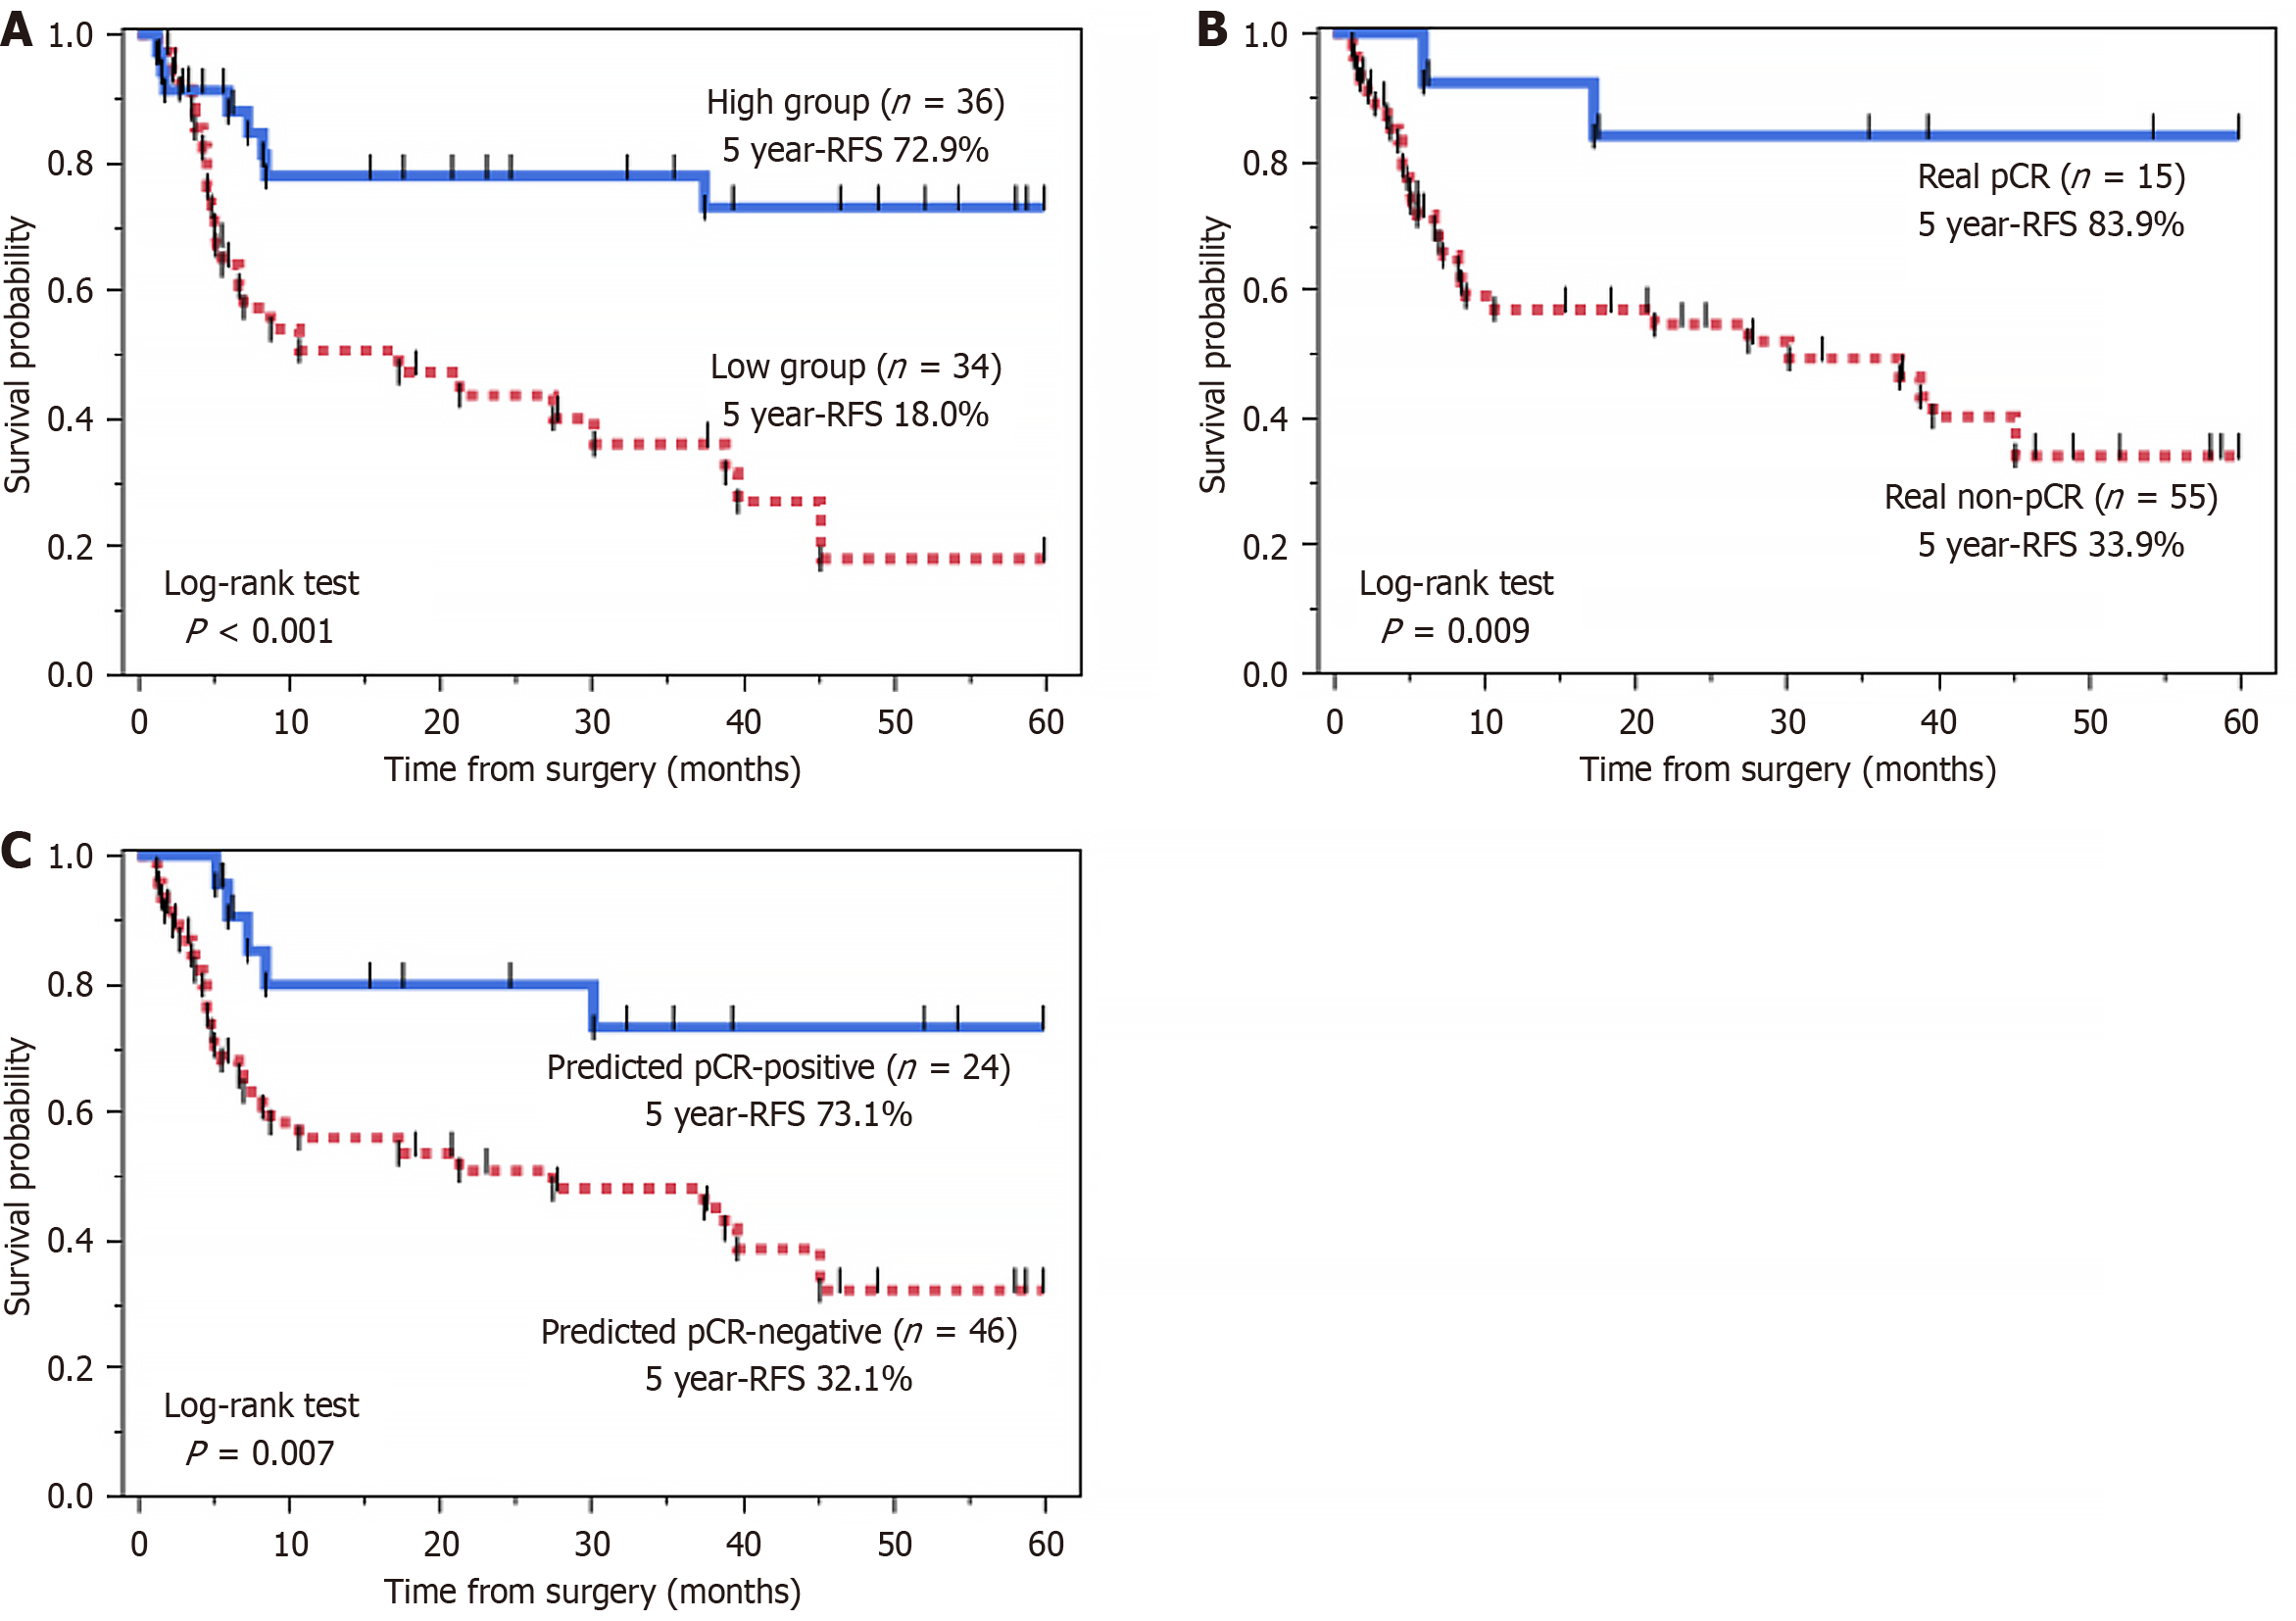
Figure 3 Kaplan-Meier curves for relapse-free survival.
A: Comparison of relapse-free survival (RFS) based on pre-treatment gray-level co-occurrence matrix entropy (b = 1000 second/mm²). The high entropy group (n = 36) showed significantly better RFS than the low entropy group (n = 34) (5-year RFS: 72.9% vs 18.0%, P < 0.001); B: Comparison of RFS based on actual pathological complete response (pCR) status. The real pCR group (n = 15) had significantly better RFS than the real non-pCR group (n = 55) (5-year RFS: 83.9% vs 33.9%, P = 0.009); C: Comparison of RFS based on the artificial intelligence model’s prediction. The predicted pCR-positive group (n = 24) demonstrated significantly better RFS than the predicted pCR-negative group (n = 46) (5-year RFS: 73.1% vs 32.1%, P = 0.007). RFS: Relapse-free survival; pCR: Pathological complete response.
- Citation: Hirata A, Hayano K, Tochigi T, Kurata Y, Shiraishi T, Sekino N, Nakano A, Matsumoto Y, Toyozumi T, Uesato M, Ohira G. Predicting pathological complete response to chemoradiotherapy using artificial intelligence-based magnetic resonance imaging radiomics in esophageal squamous cell carcinoma. World J Gastroenterol 2025; 31(36): 111293
- URL: https://www.wjgnet.com/1007-9327/full/v31/i36/111293.htm
- DOI: https://dx.doi.org/10.3748/wjg.v31.i36.111293


