Copyright
©The Author(s) 2021.
World J Clin Cases. Nov 26, 2021; 9(33): 10208-10221
Published online Nov 26, 2021. doi: 10.12998/wjcc.v9.i33.10208
Published online Nov 26, 2021. doi: 10.12998/wjcc.v9.i33.10208
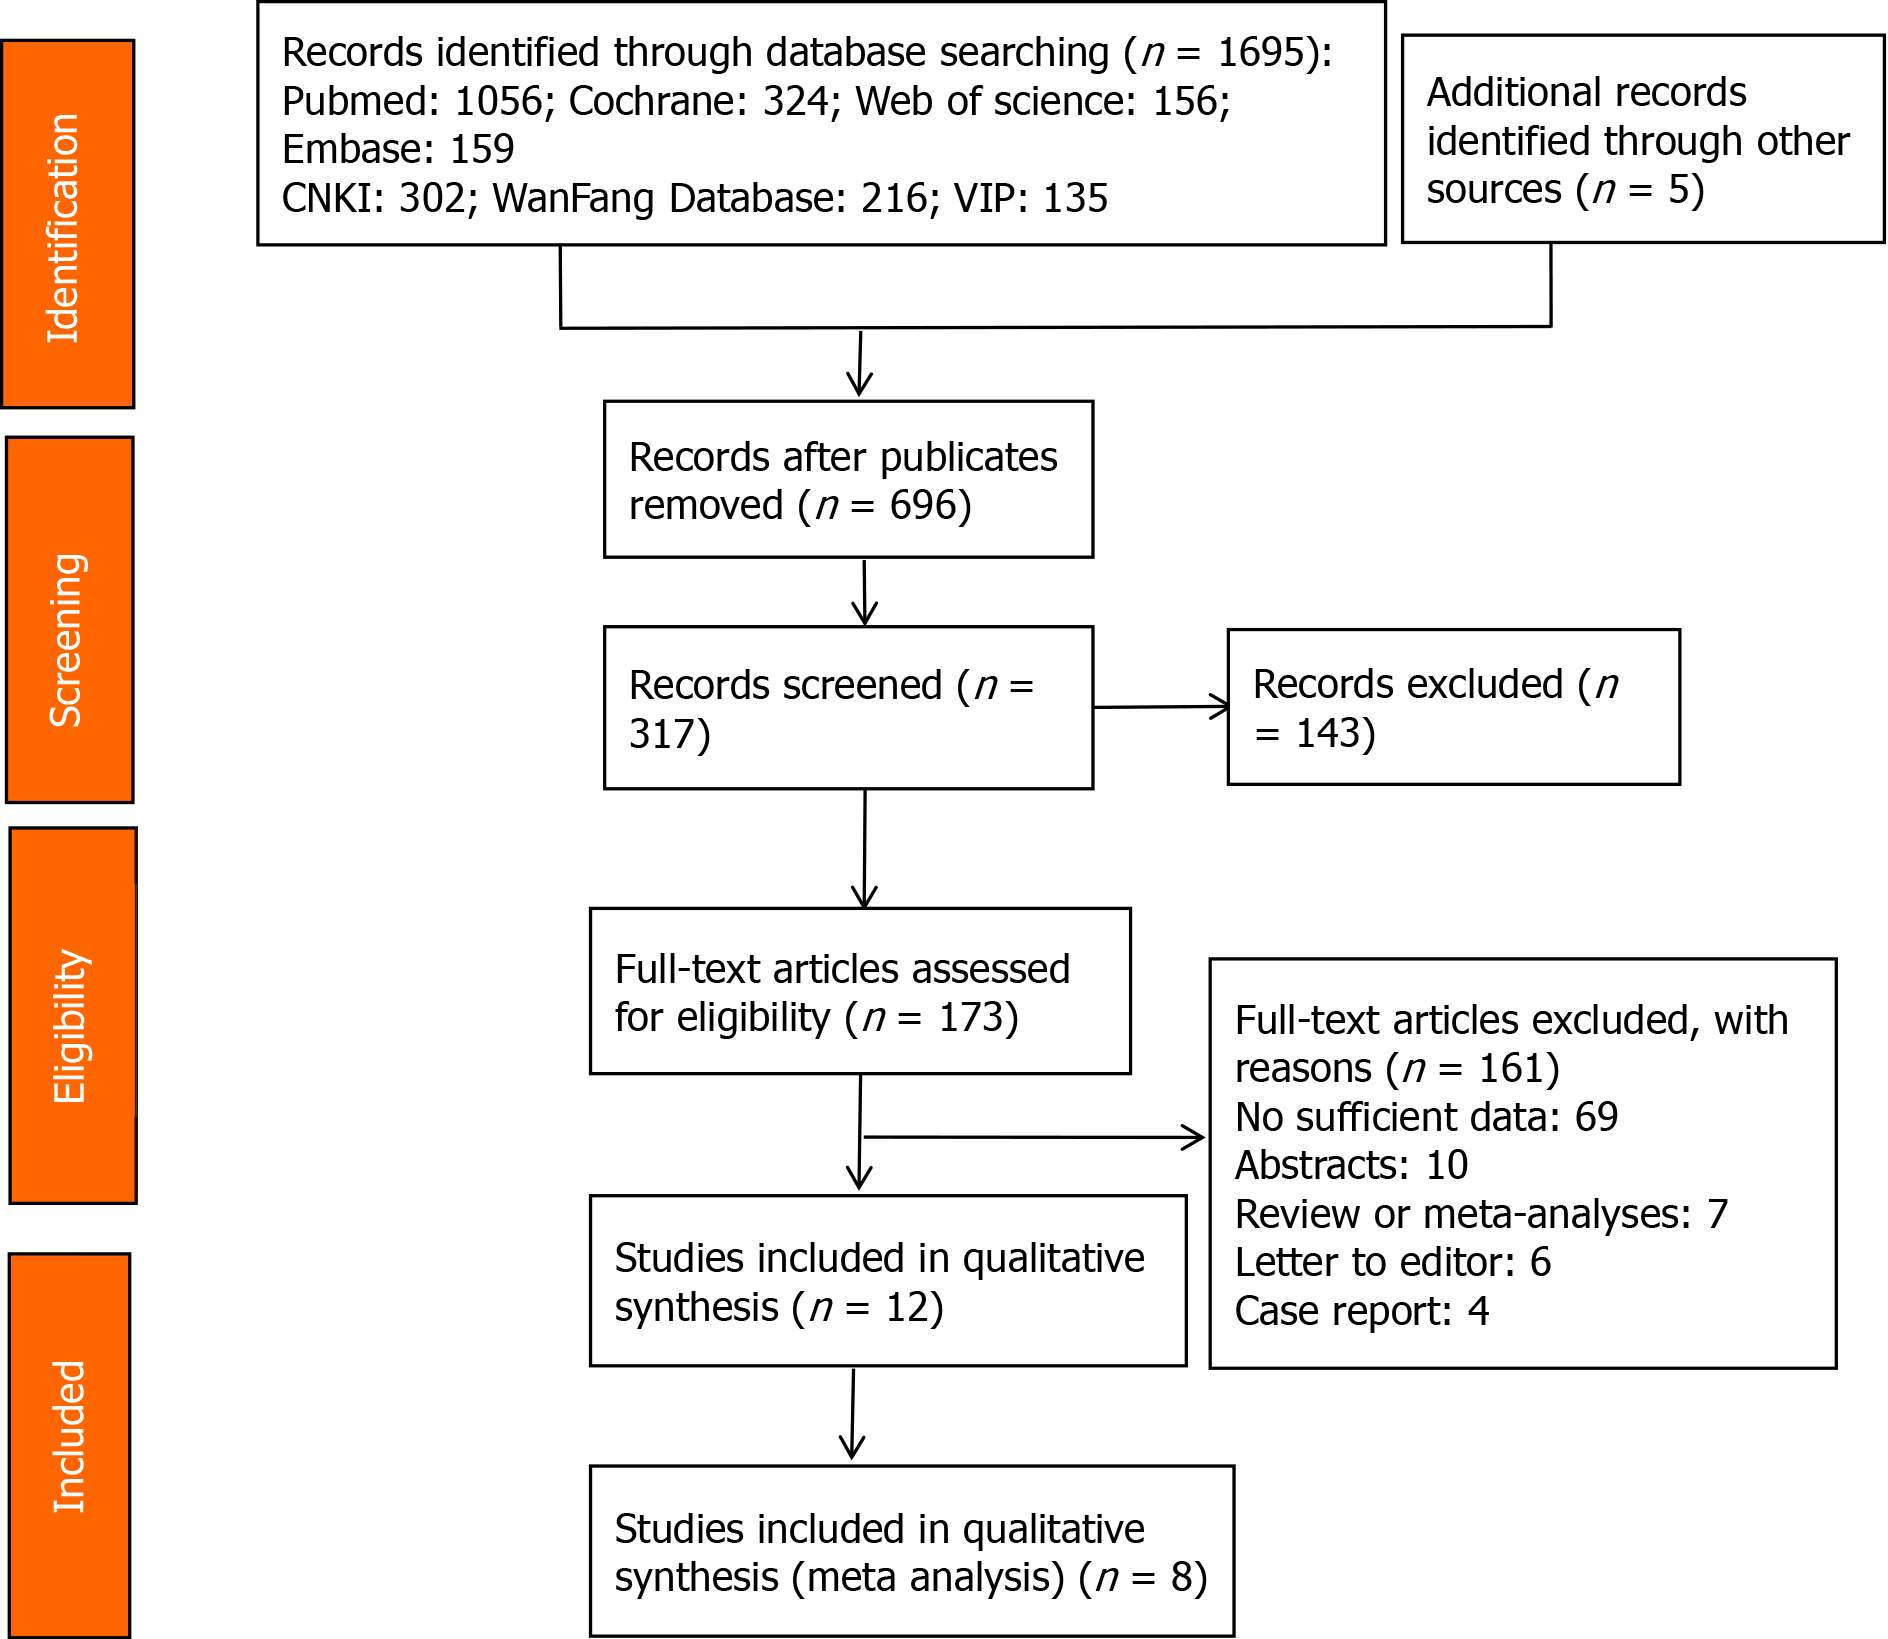
Figure 1 Flow diagram representing the selection of studies.
Figure 2 Forest plot of bed rest time.
Figure 3 Forest plot of time interval of body temperature returning to normal range.
Figure 4 Forest plot of time interval of white blood cell count returning to normal range.
Figure 5 Forest plot of duration of operation.
Figure 6 Forest plot of length of hospitalizations.
- Citation: Wang Y, Sun CY, Liu J, Chen Y, Bhan C, Tuason JPW, Misra S, Huang YT, Ma SD, Cheng XY, Zhou Q, Gu WC, Wu DD, Chen X. Is endoscopic retrograde appendicitis therapy a better modality for acute uncomplicated appendicitis? A systematic review and meta-analysis. World J Clin Cases 2021; 9(33): 10208-10221
- URL: https://www.wjgnet.com/2307-8960/full/v9/i33/10208.htm
- DOI: https://dx.doi.org/10.12998/wjcc.v9.i33.10208


