Copyright
©The Author(s) 2021.
World J Clin Cases. Oct 16, 2021; 9(29): 8671-8693
Published online Oct 16, 2021. doi: 10.12998/wjcc.v9.i29.8671
Published online Oct 16, 2021. doi: 10.12998/wjcc.v9.i29.8671
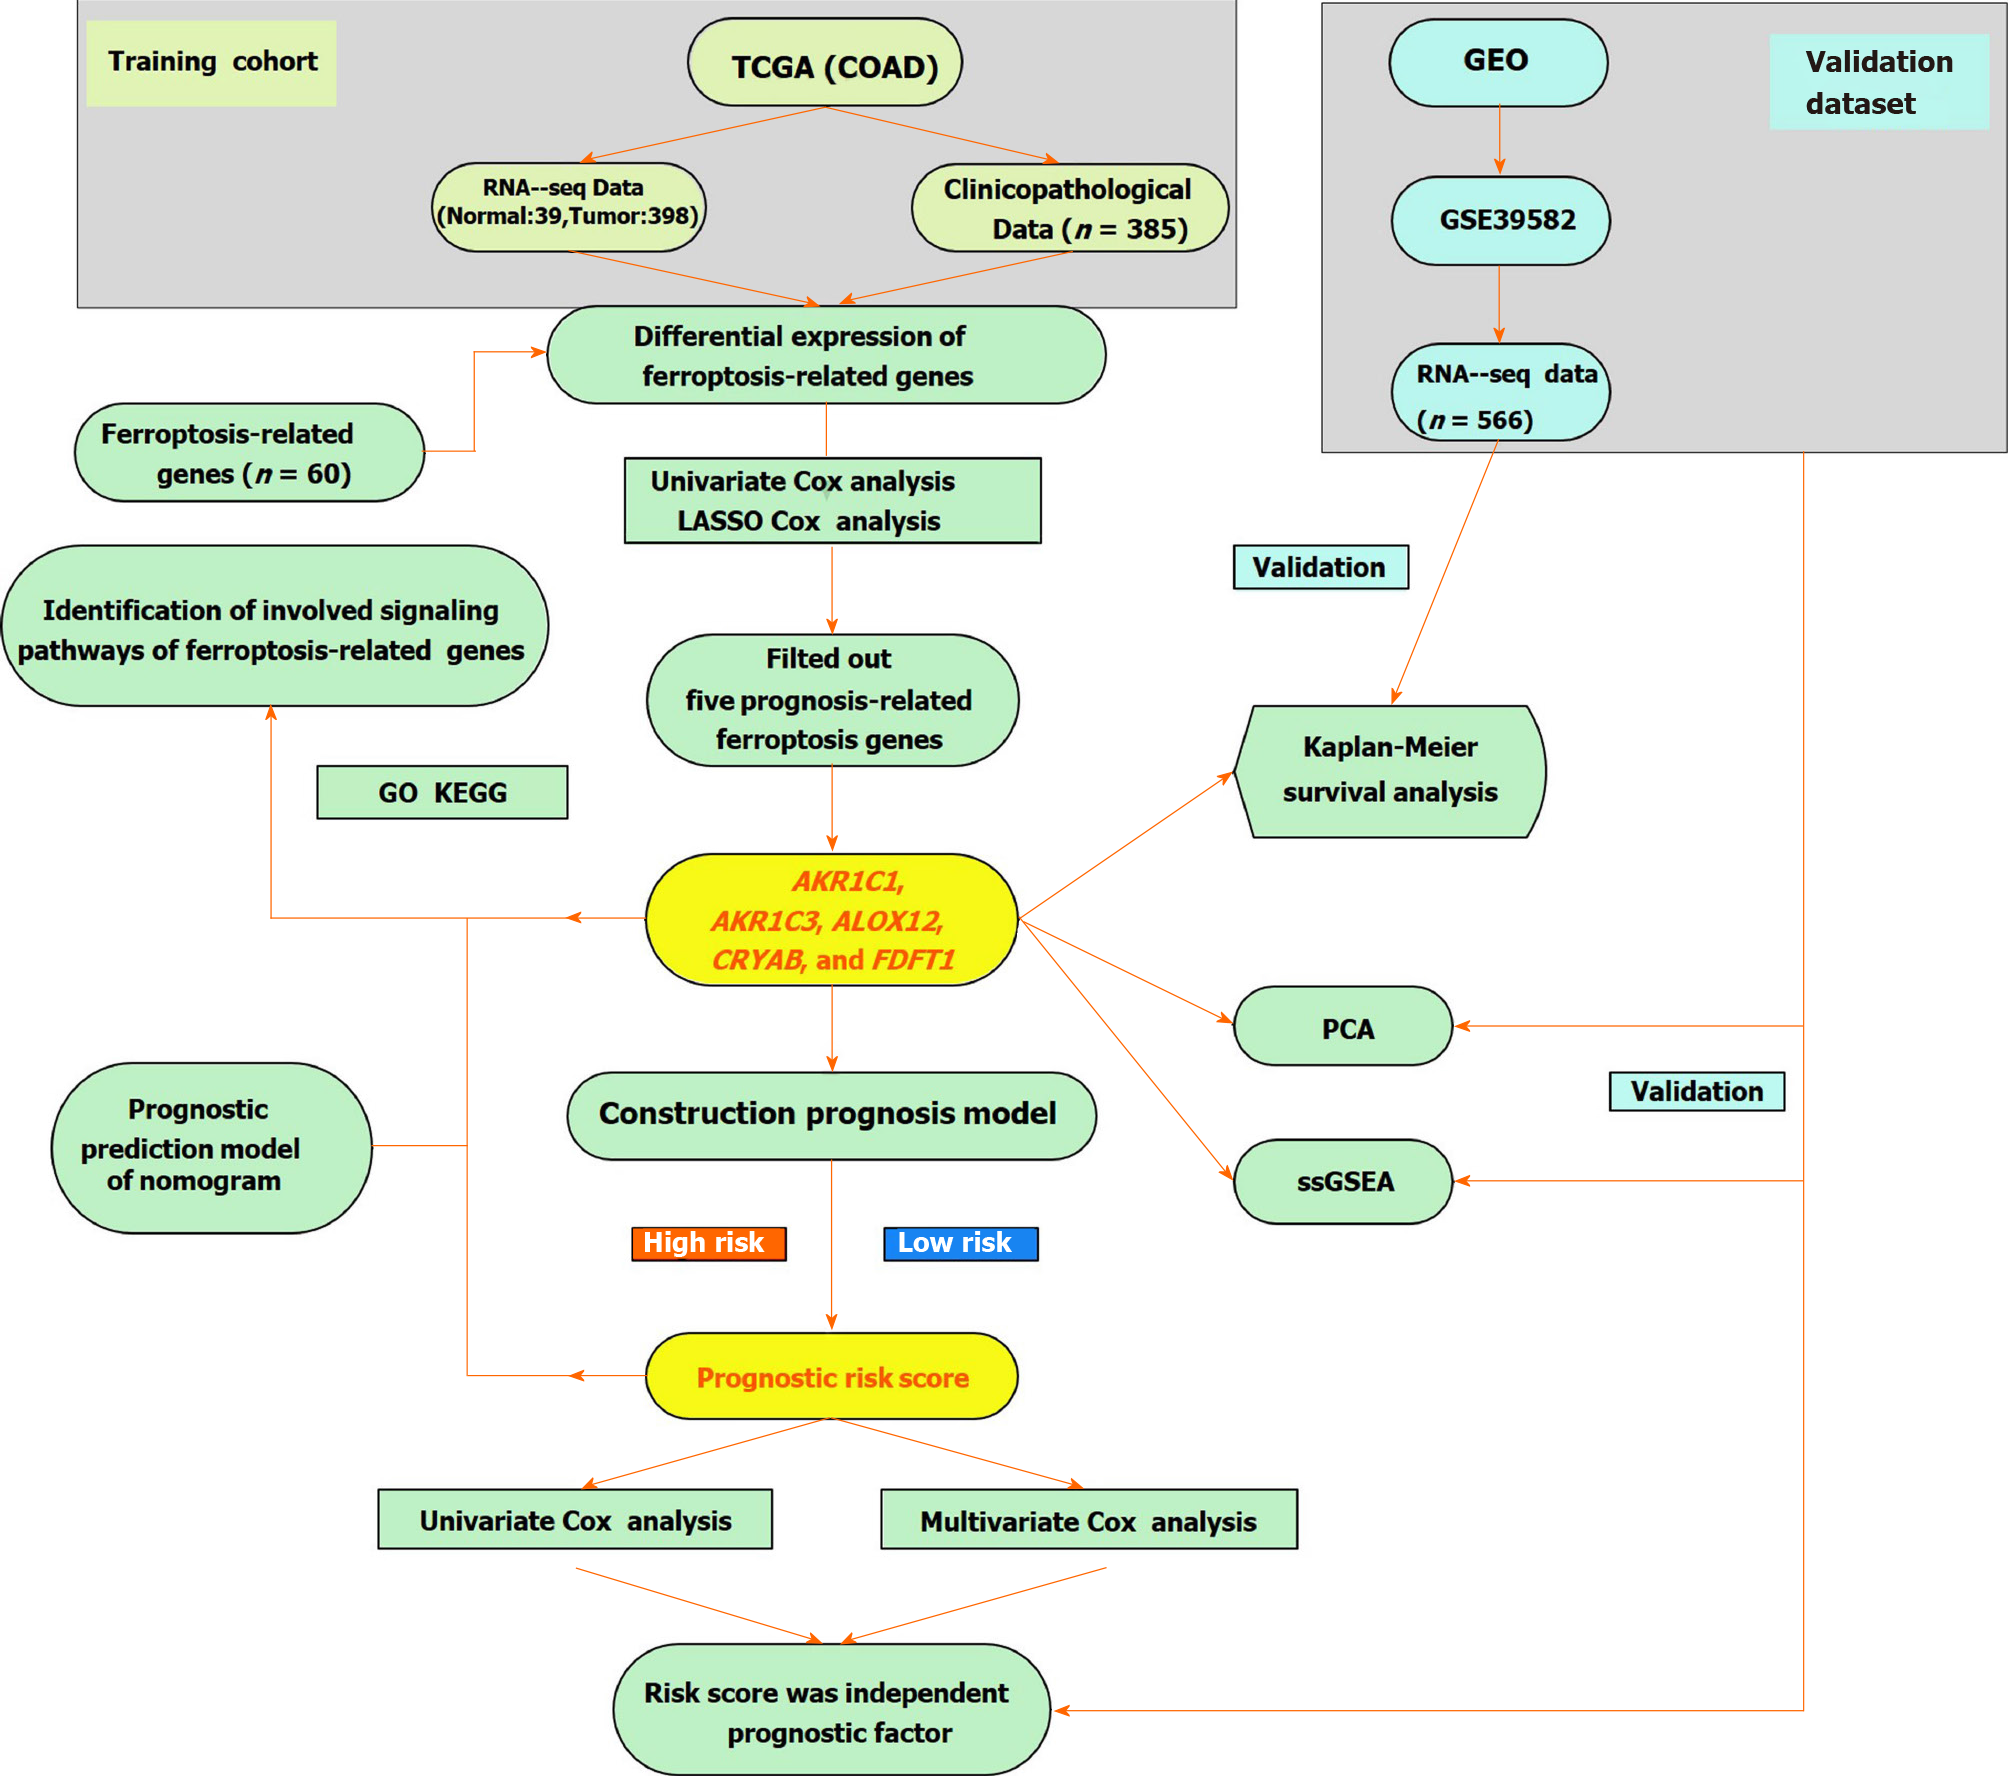
Figure 1 A flow chart of the study design and analysis.
TCGA: The Cancer Genome Atlas; COAD: Colon adenocarcinoma; LASSO: Least absolute shrinkage and selection operator; GO: Gene Ontology; KEGG: Kyoto Encyclopedia of Genes and Genomes; ssGEA: Single-sample gene set enrichment analysis; PCA: Principal component analysis; GEO: Gene Expression Omnibus.
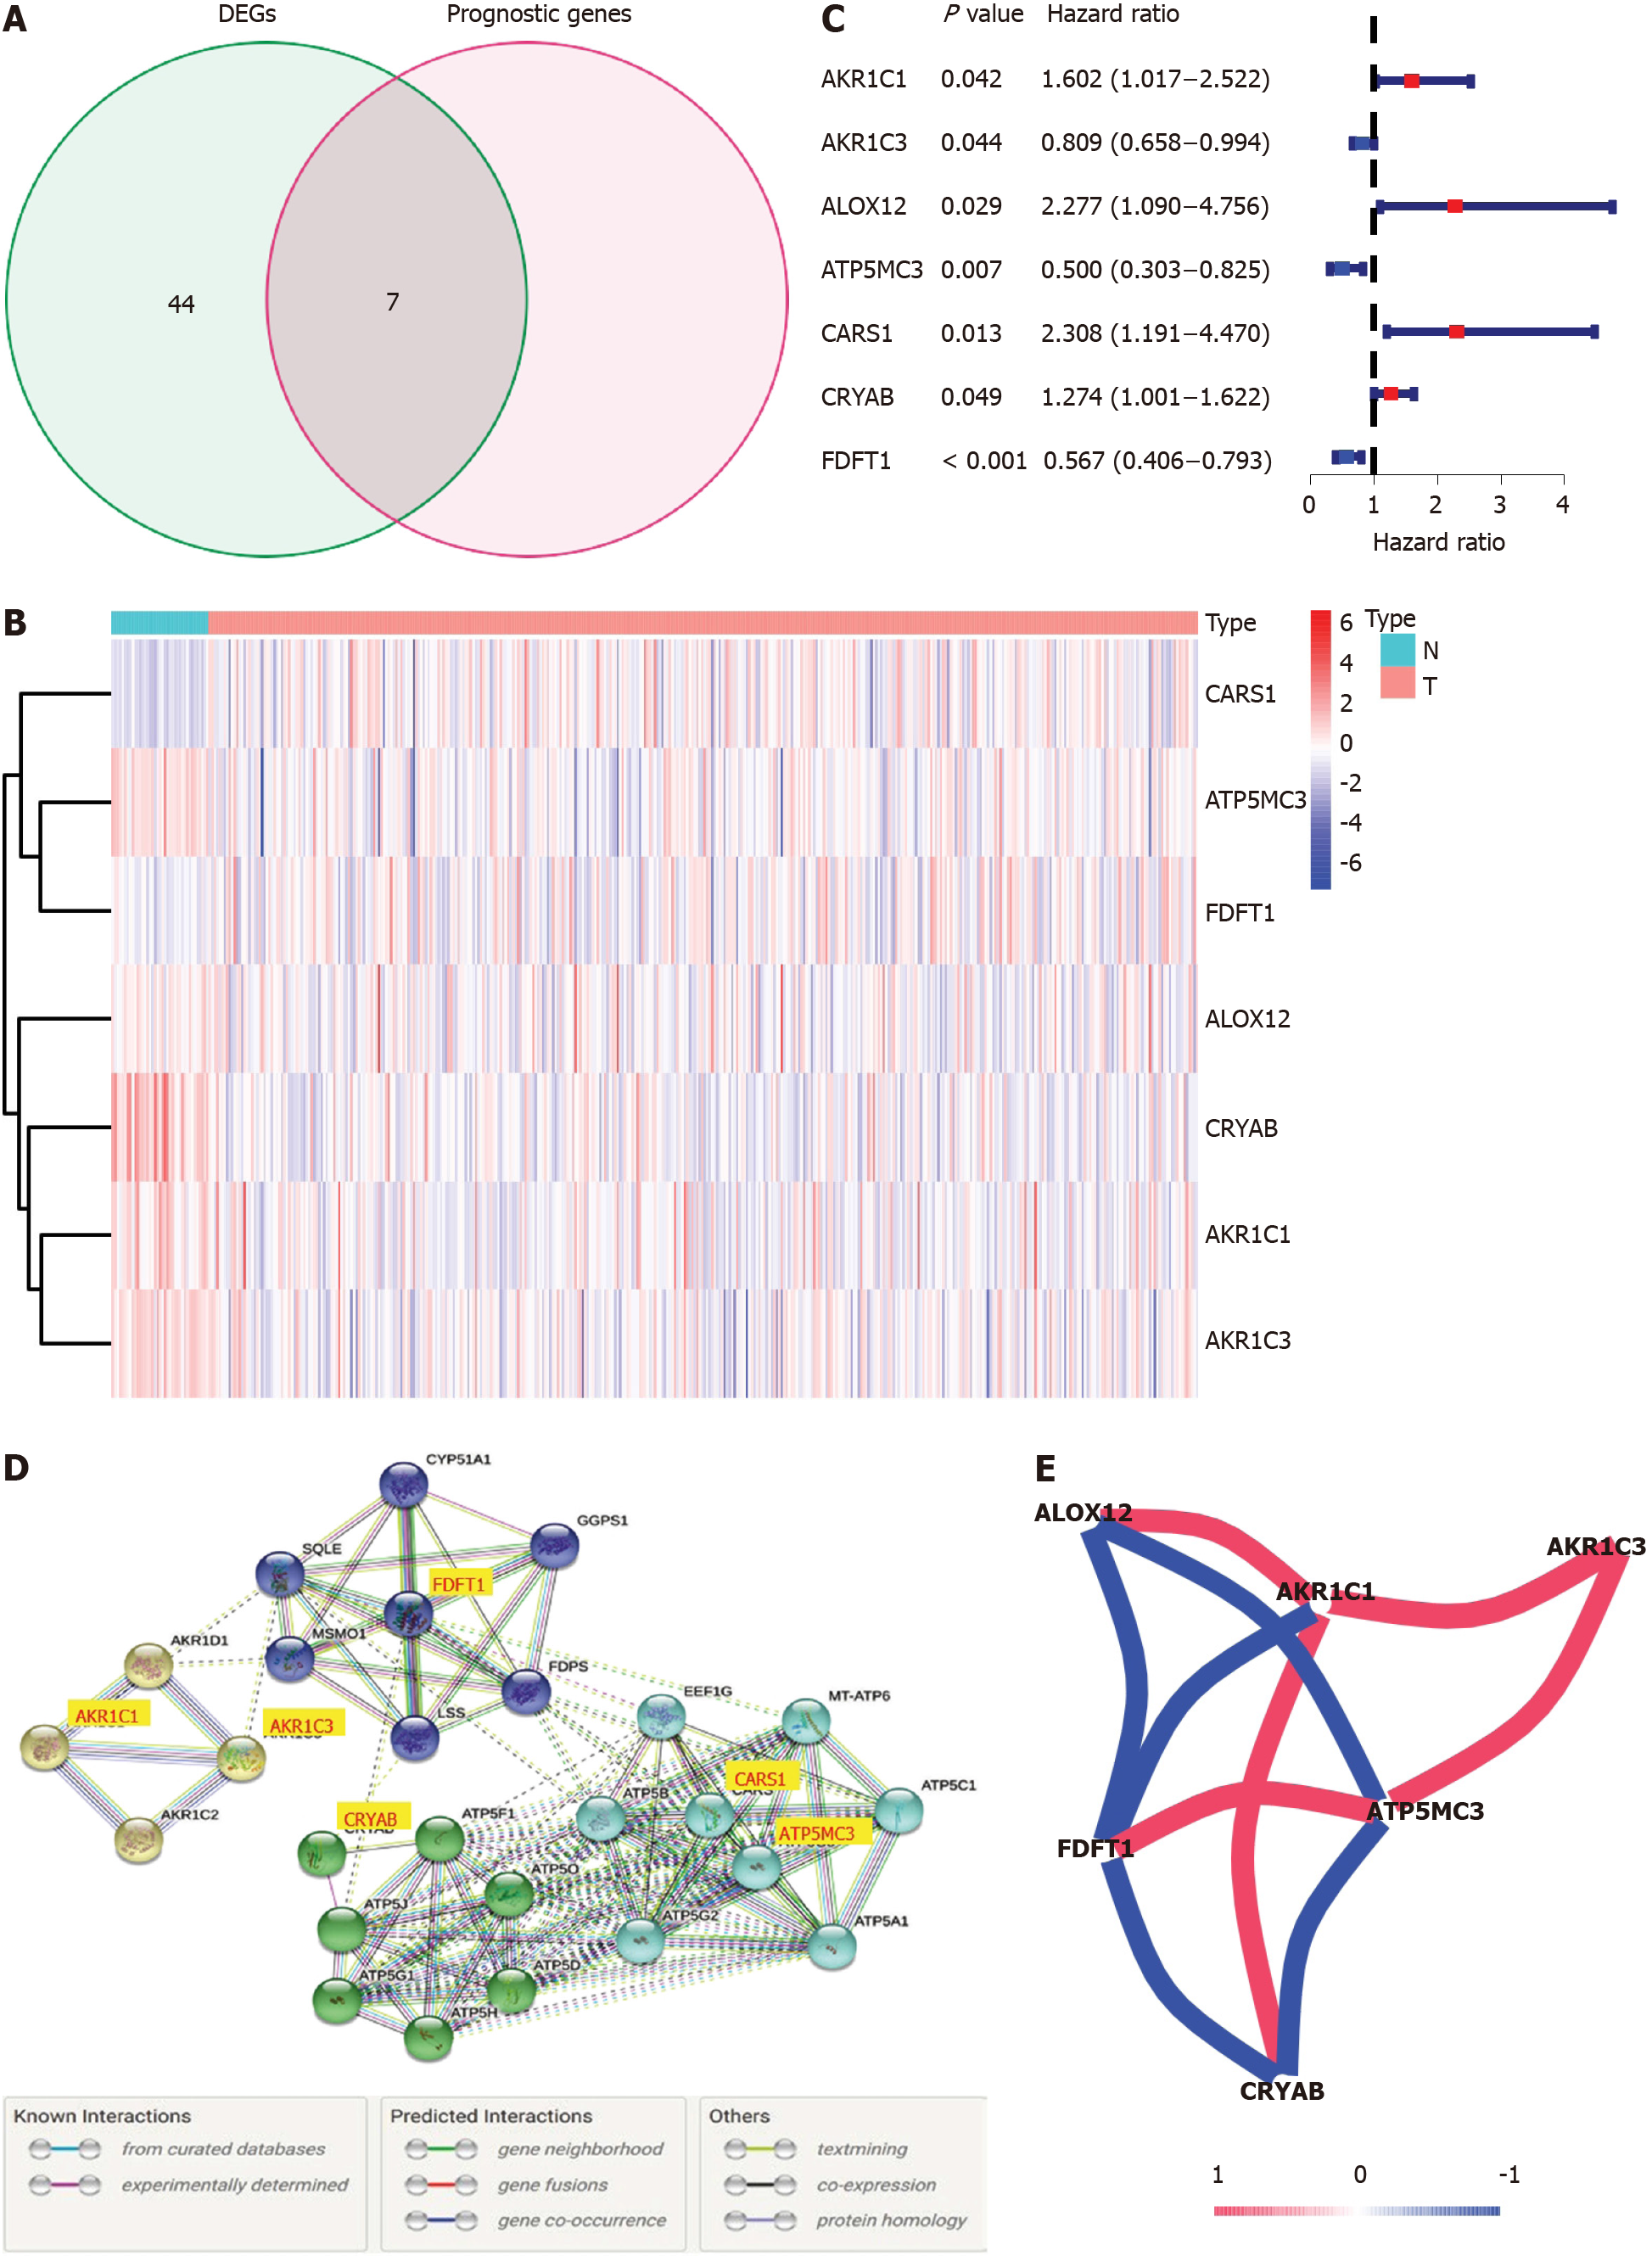
Figure 2 Identification of the candidate prognostic ferroptosis-related genes in the Cancer Genome Atlas-colon adenocarcinoma cohort.
A: Venn diagram to confirm differentially expressed genes between corresponding adjacent normal tissue and tumor tissue related to overall survival; B: Heatmap of the seven prognostic ferroptosis-related gene expression profiles in the Cancer Genome Atlas-colon adenocarcinoma cohort; C: Forest plots demonstrated the results of the univariate Cox regression analysis between the expression of the seven prognostic ferroptosis-related genes and overall survival; D: PPI network obtained from the STRING database indicated the interactions among the candidate genes; E: Correlation network of candidate genes. The correlation coefficients are shown using different colors. DEGs: Differentially expressed genes.
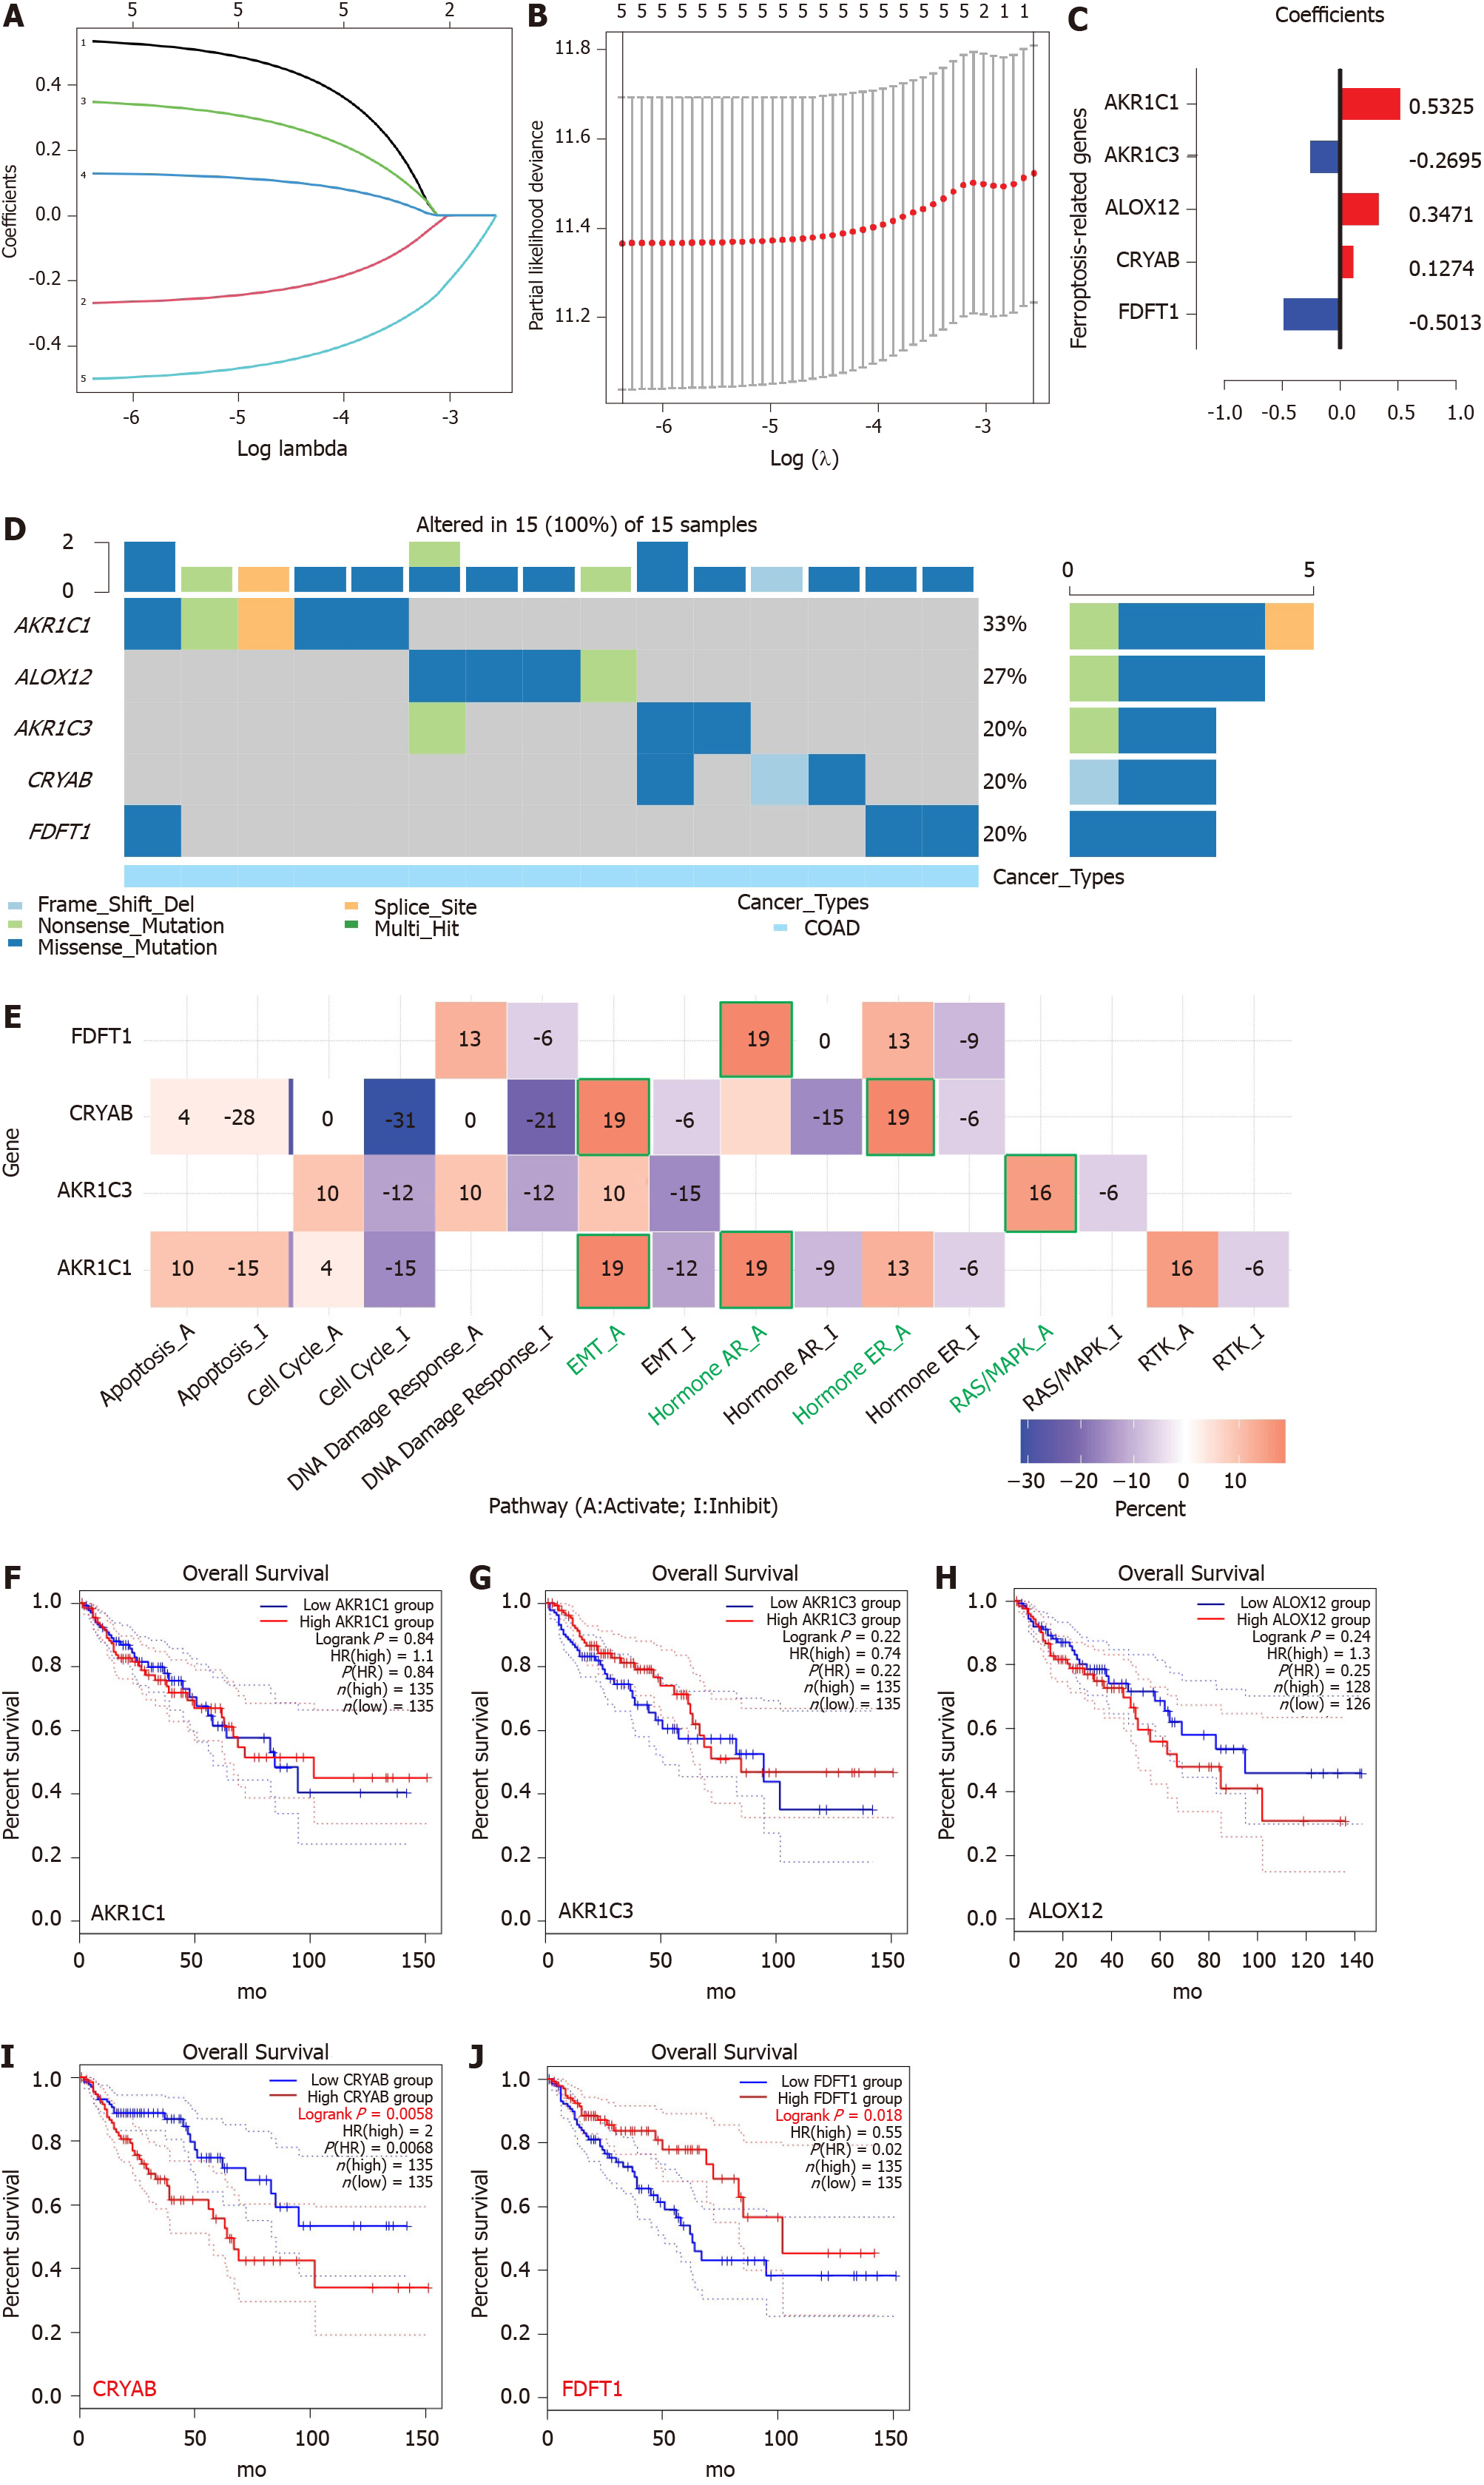
Figure 3 Establishment of a prognostic ferroptosis-related gene signature by least absolute shrinkage and selection operator Cox regression analysis.
A-C: Process of constructing the signature including five ferroptosis-related genes. A coefficient profile plot (C) was generated against the log (lambda) sequence (A); B: Selection of the optimal parameter (lambda) in the least absolute shrinkage and selection operator model for colon adenocarcinoma; D: Genetic alteration of the five genes in colon adenocarcinoma using Gene Set Cancer Analysis. The X axis represents the cancer type, and sky blue indicates colon adenocarcinoma. The left Y axis represents the ratio of gene mutations, and the right Y axis represents the gene names. Different-colored small rectangles indicate the type of gene mutation; E: Four ferroptosis-related genes involved in the regulation of signaling pathways using Gene Set Cancer Analysis. The green pathway names indicate the pathway with the highest proportion of regulation of each gene; F: Single-gene survival analysis of the five ferroptosis-related genes based on the web database GEPIA2. COAD: Colon adenocarcinoma; EMT: Epithelial-mesenchymal transition; AR: Androgen receptor; ER: Estrogen receptor.
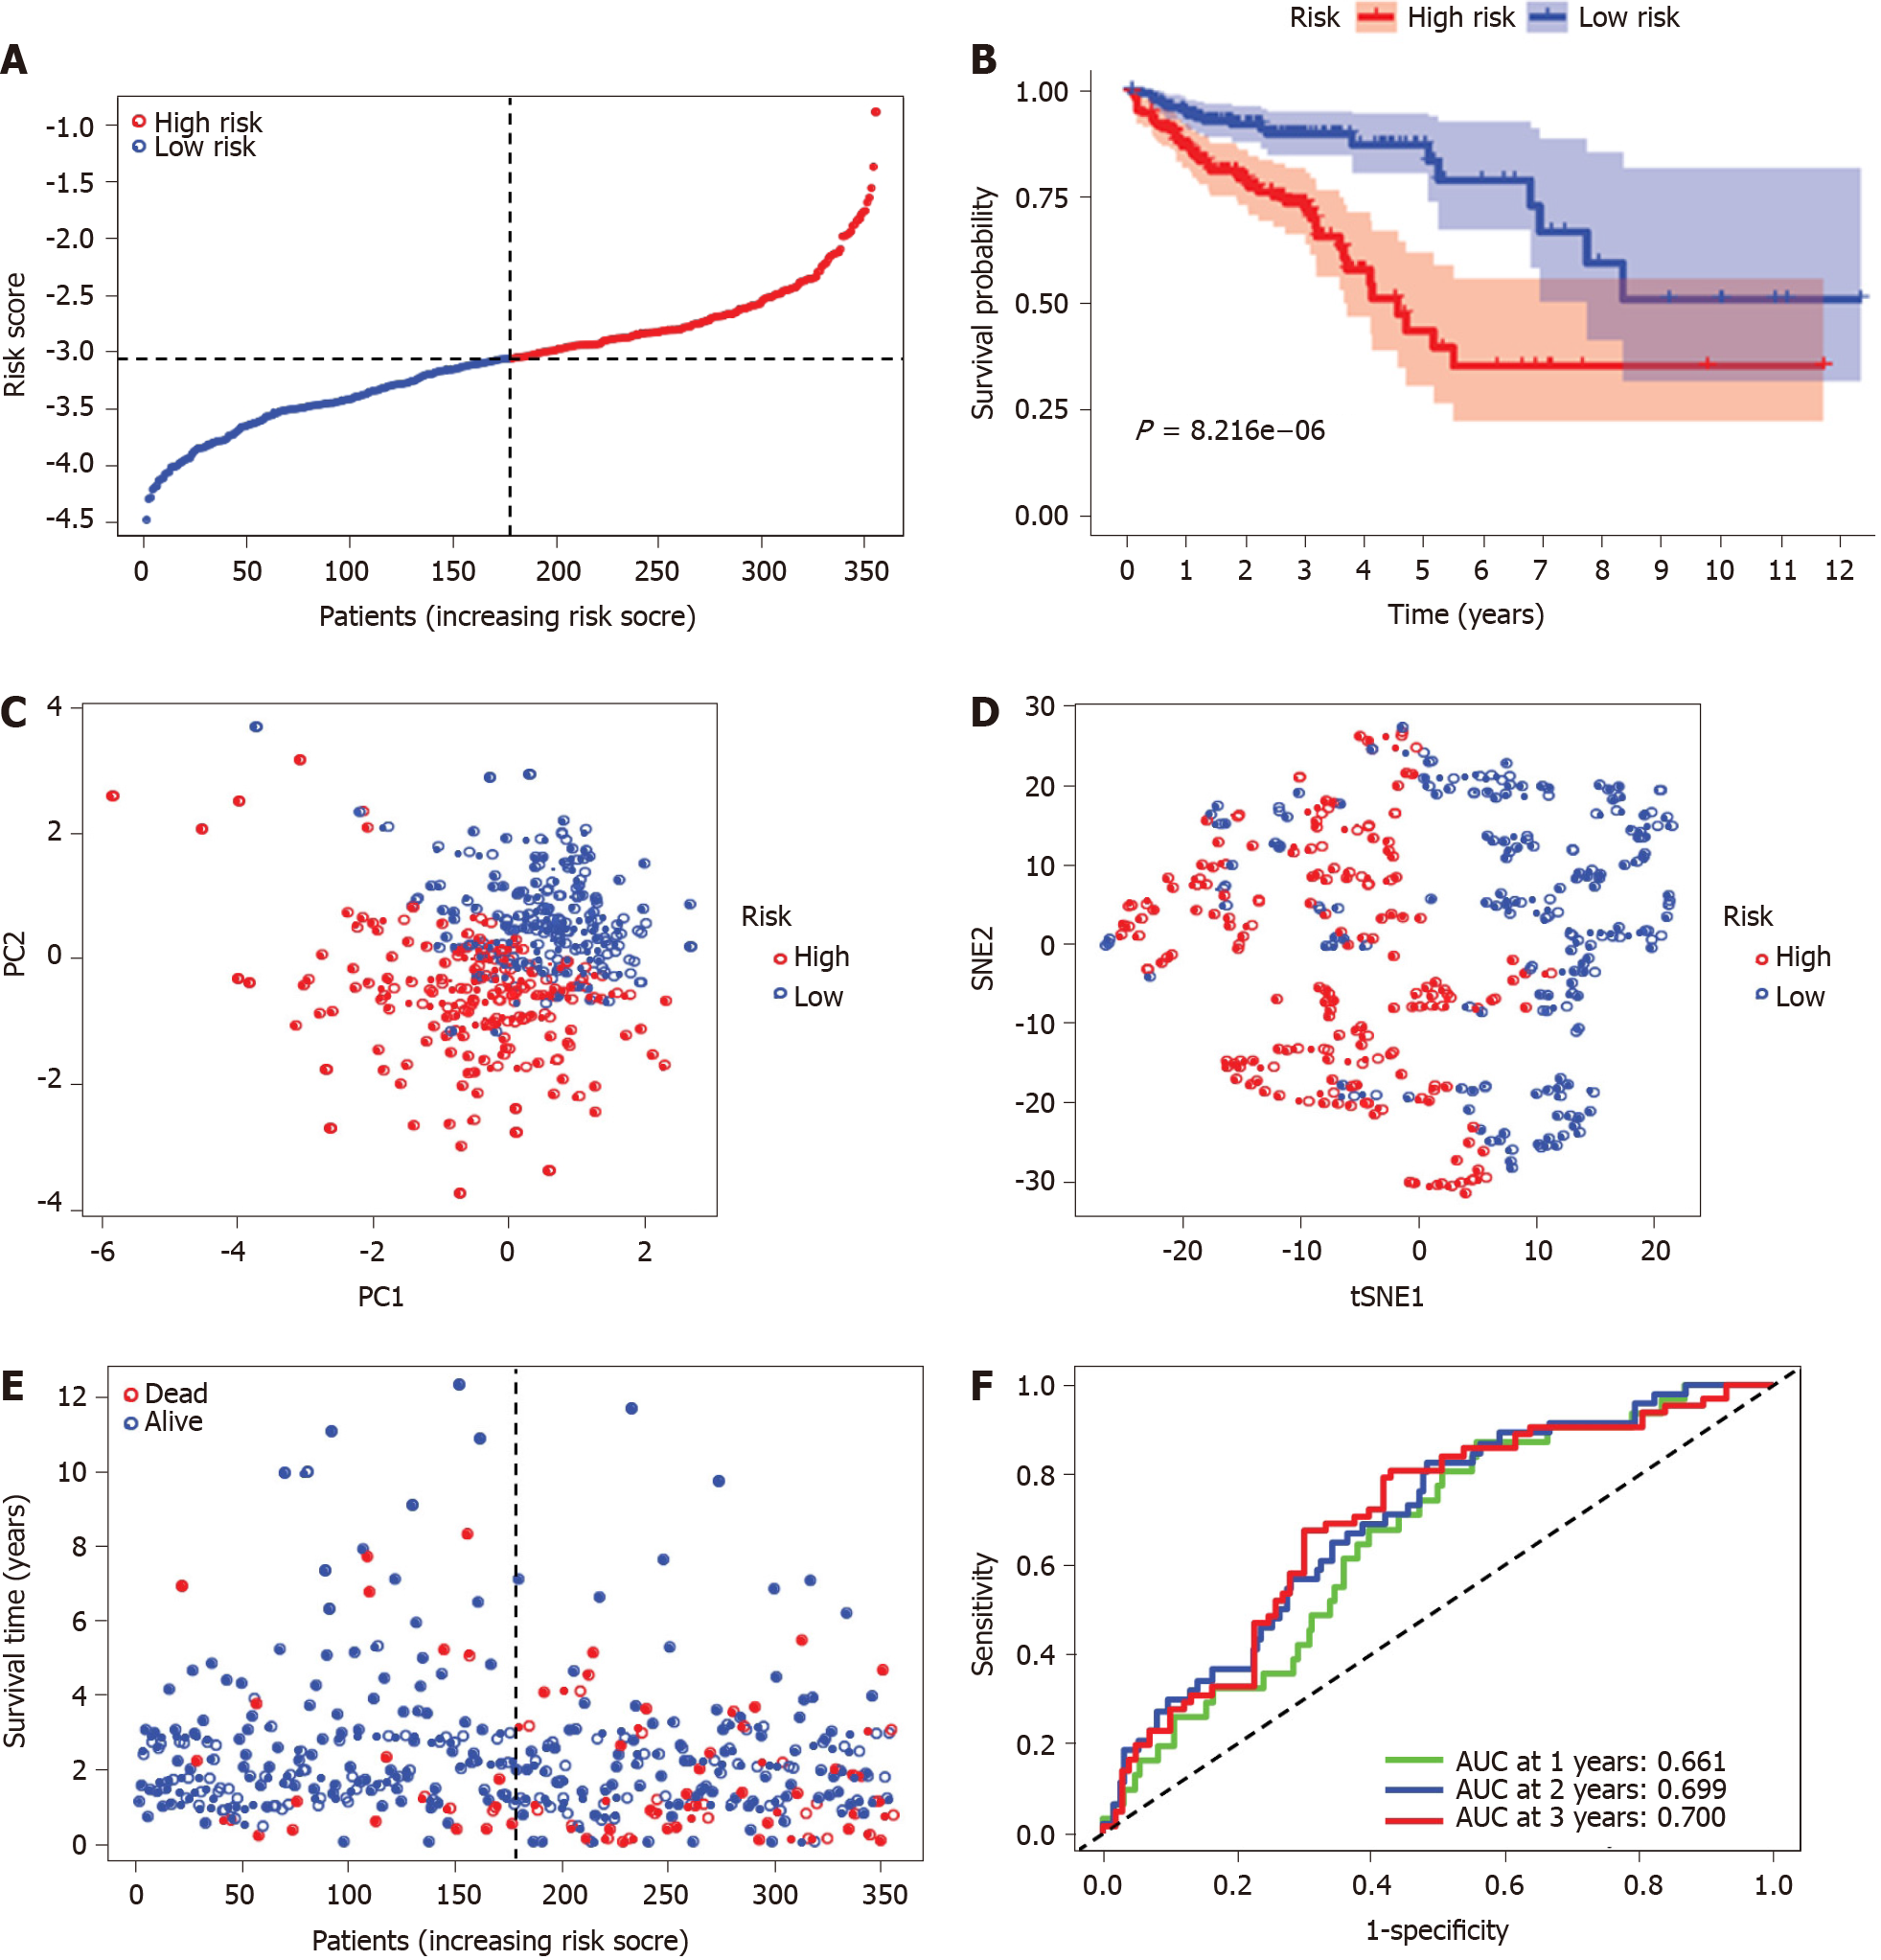
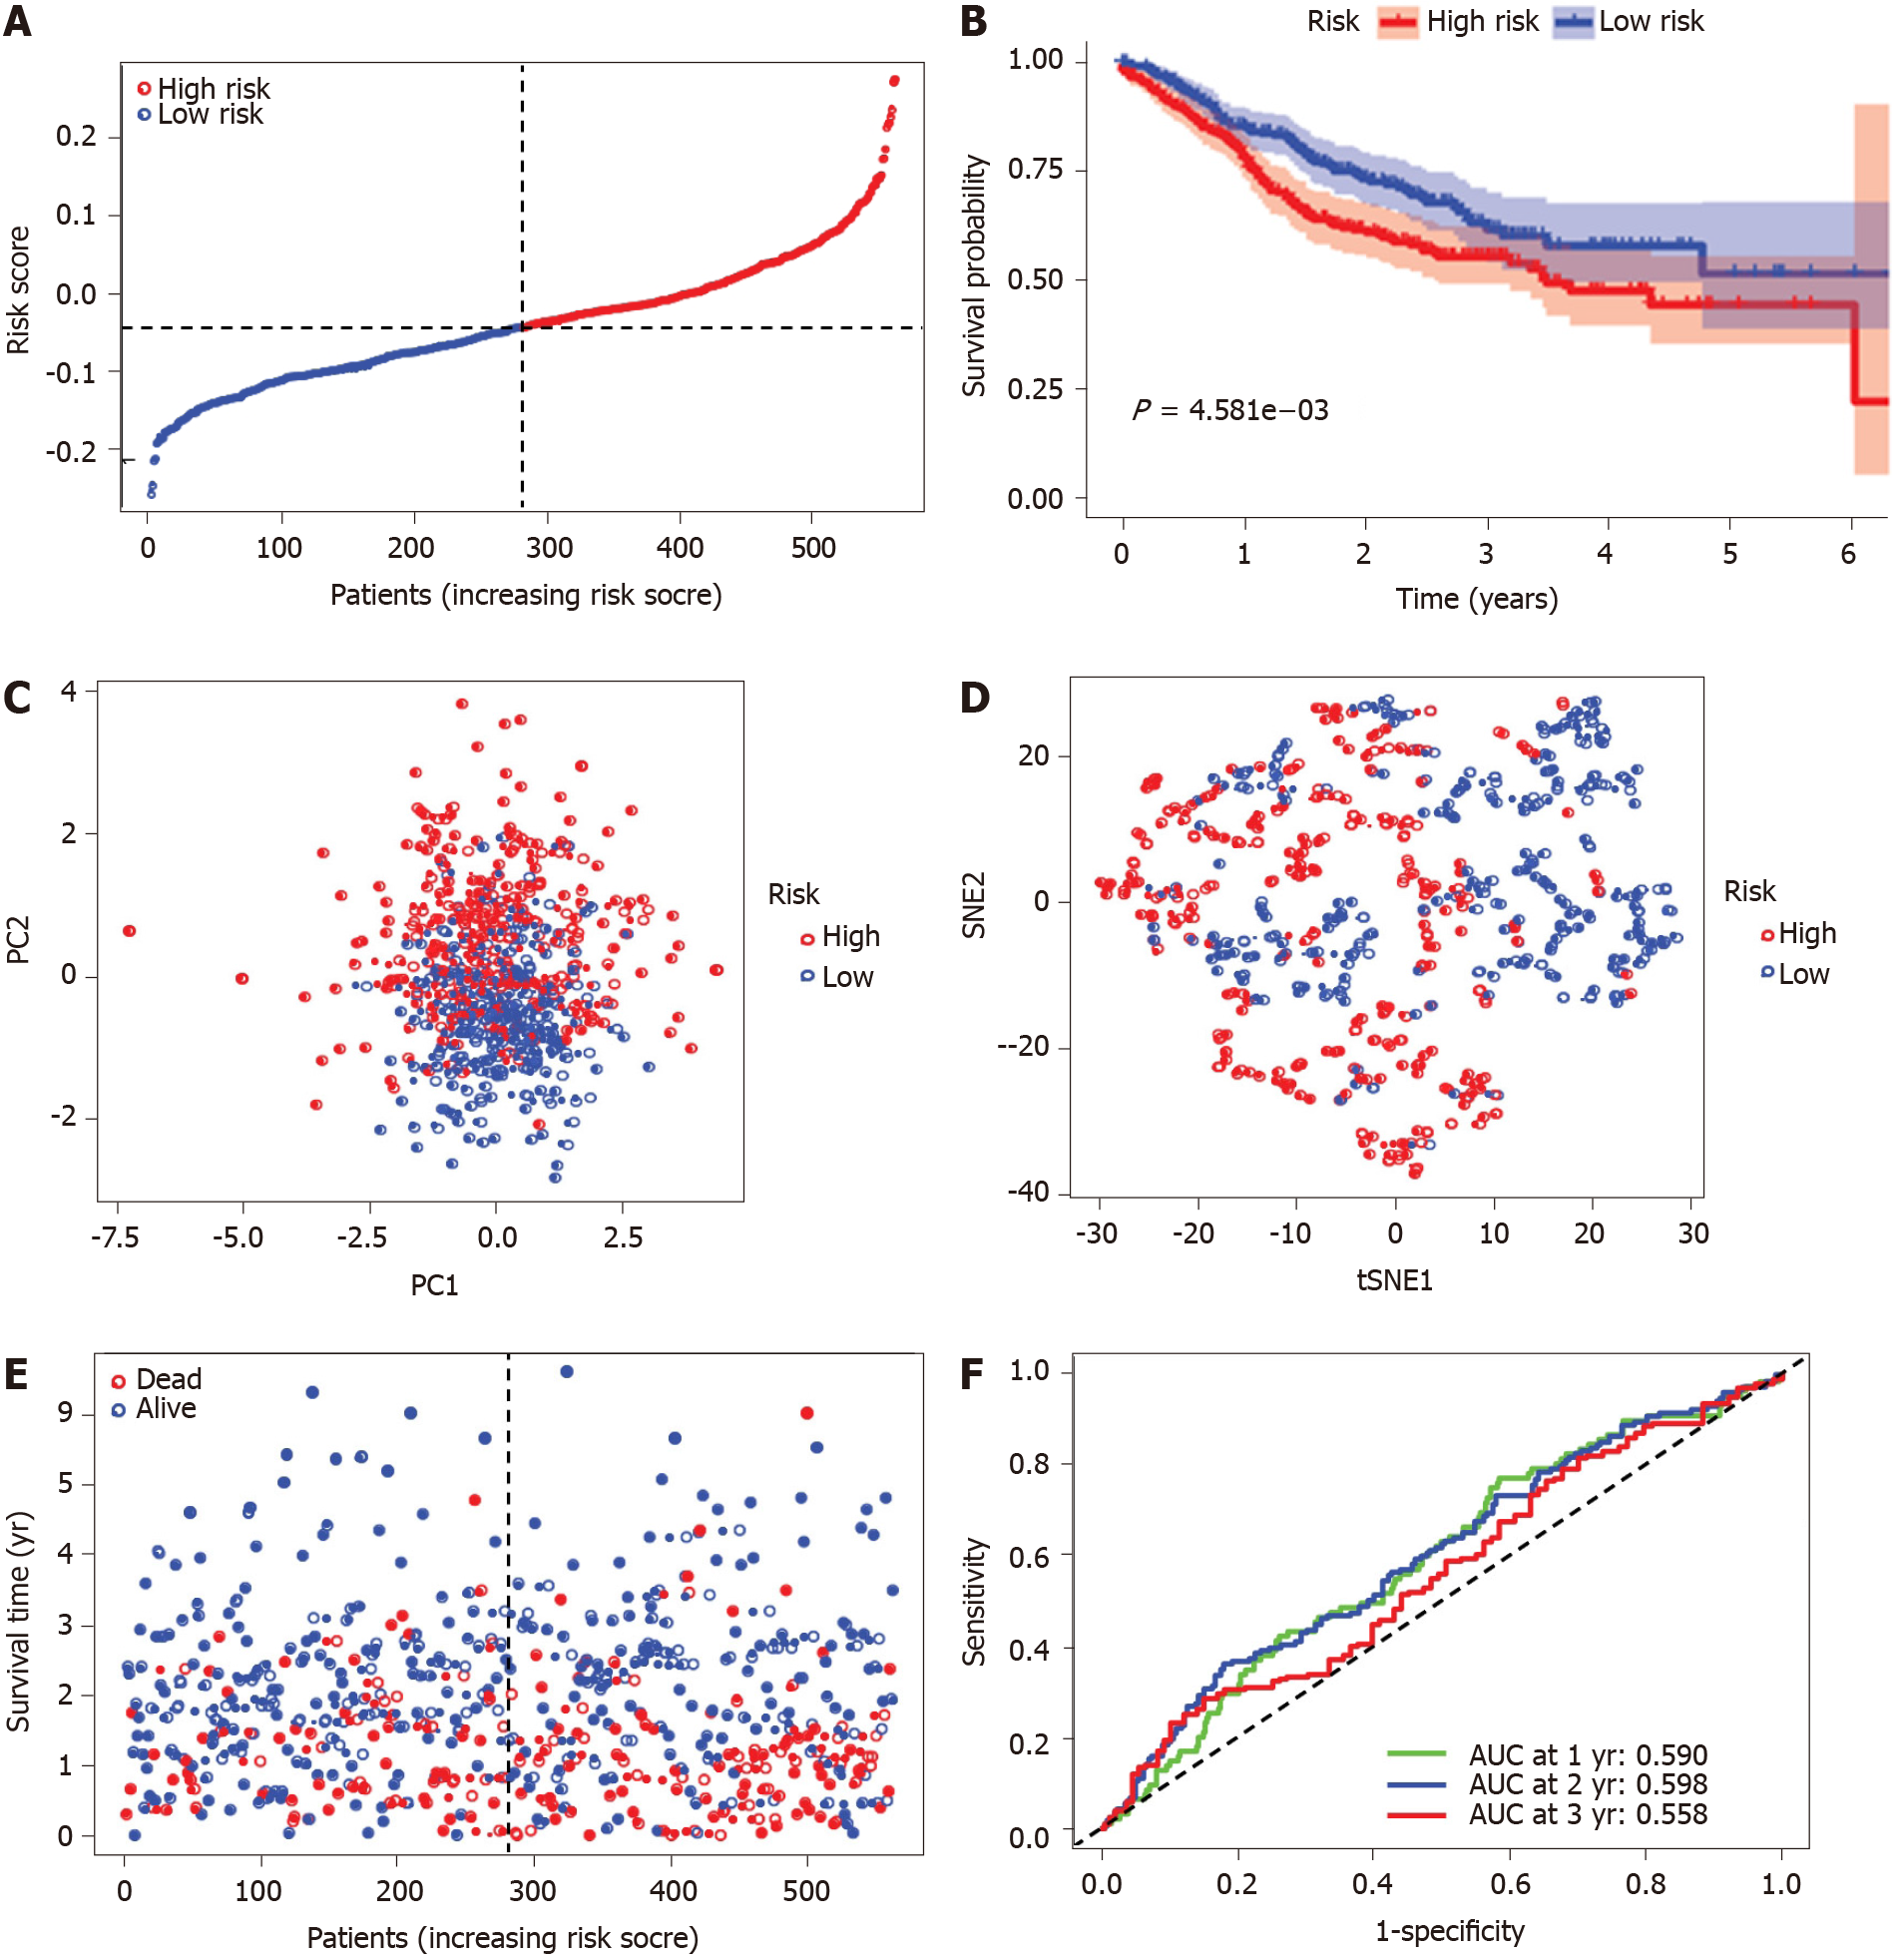
Figure 4 Prognostic analysis of the five ferroptosis-related gene models in the Cancer Genome Atlas-colon adenocarcinoma cohort.
A: Distribution and median value of the risk scores in the Cancer Genome Atlas-colon adenocarcinoma (TCGA-COAD) cohort. The black dotted line is the optimum cut-off dividing patients into high-risk and low-risk groups. The red curve represents high risk, and the blue curve represents low risk; B: Kaplan-Meier survival curves for the overall survival of patients in the high-risk group and low-risk group in the TCGA-COAD cohort; C: Principal component analysis plot of the TCGA-COAD cohort; D: t-distributed stochastic neighbor embedding analysis of the TCGA-COAD cohort; E: Distributions of overall survival status, overall survival, and risk score in the TCGA-COAD cohort. The red dot indicates patient death, and the blue dot indicates patient survival; F: Area under the curve values of time-dependent receiver operating characteristic curves verified the prognostic performance of the risk score in the TCGA-COAD cohort. PC: Principal component analysis; t-SNE: t-distributed stochastic neighbor embedding; AUC: Area under the curve.
Figure 5 Prognostic analysis of the five ferroptosis-related gene models in the GSE39582 cohort.
A: Distribution and median value of the risk scores in the GSE39582 cohort. The black dotted line is the optimum cut-off dividing patients into high-risk and low-risk groups. The red curve represents high risk, and the blue curve represents low risk; B: Kaplan-Meier survival curves for the overall survival of patients in the high-risk group and low-risk group in the GSE39582 cohort; C: Principal component analysis plot of the GSE39582 cohort; D: t-distributed stochastic neighbor embedding analysis of the GSE39582 cohort; E: Distribution of overall survival status, overall survival, and risk score in the GSE39582 cohort. The red dot indicates patient death, and the blue dot indicates survival; F: Area under the curve values of time-dependent receiver operating characteristic curves verified the prognostic performance of the risk score in the GSE39582 cohort. PCA: Principal component analysis; t-SNE: t-distributed stochastic neighbor embedding; AUC: Area under the curve.
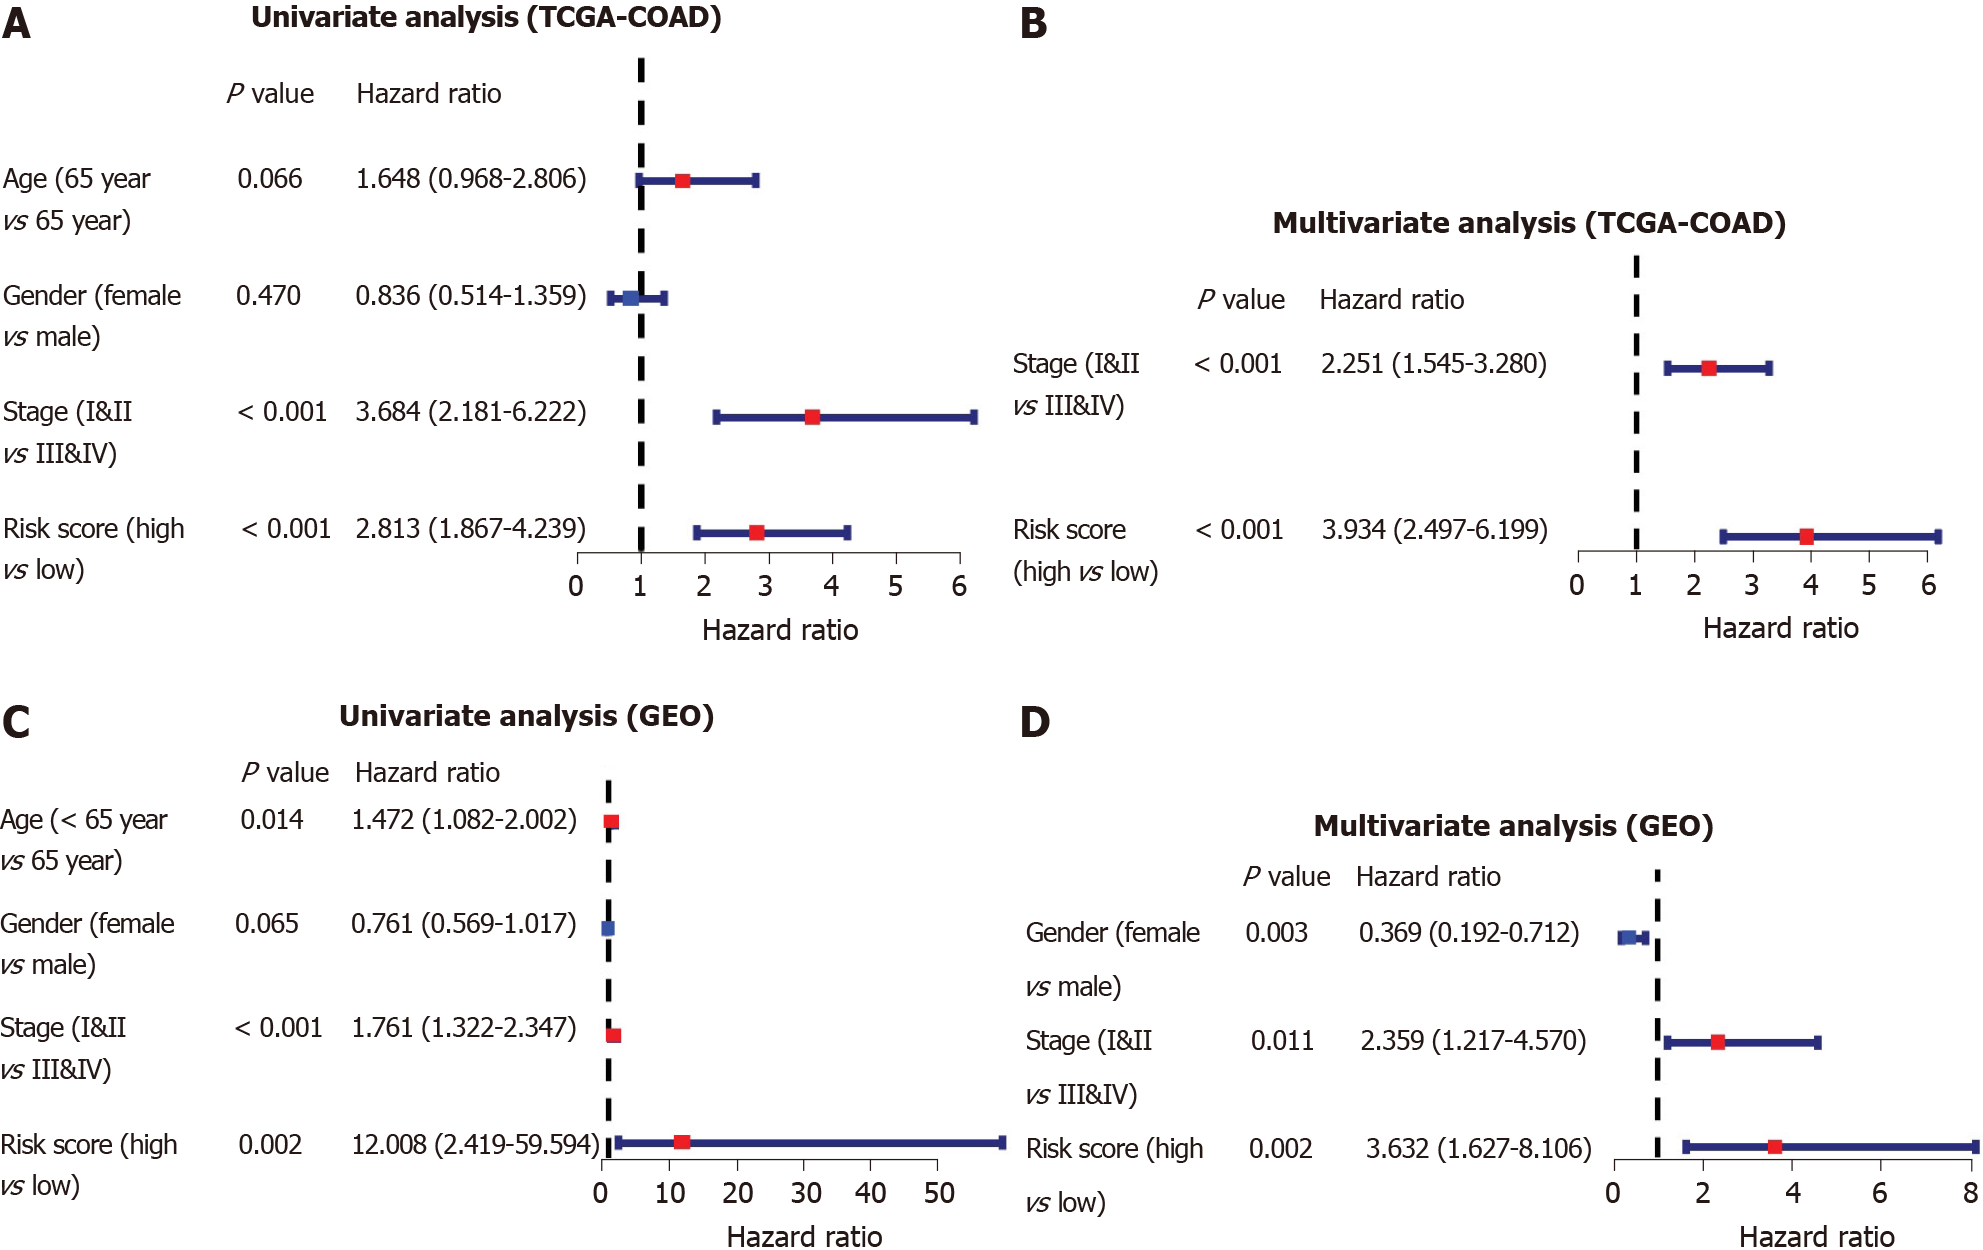
Figure 6 Independent prognostic value analysis of the five ferroptosis-related gene signatures.
A: Univariate Cox regression analyses in the Cancer Genome Atlas training cohort; B: Multivariate Cox regression analyses in the Cancer Genome Atlas training cohort; C: Gene Expression Omnibus validation cohort; D: Gene Expression Omnibus validation cohort. TCGA-COAD: The Cancer Genome Atlas database-colon adenocarcinoma; GEO: Gene Expression Omnibus.
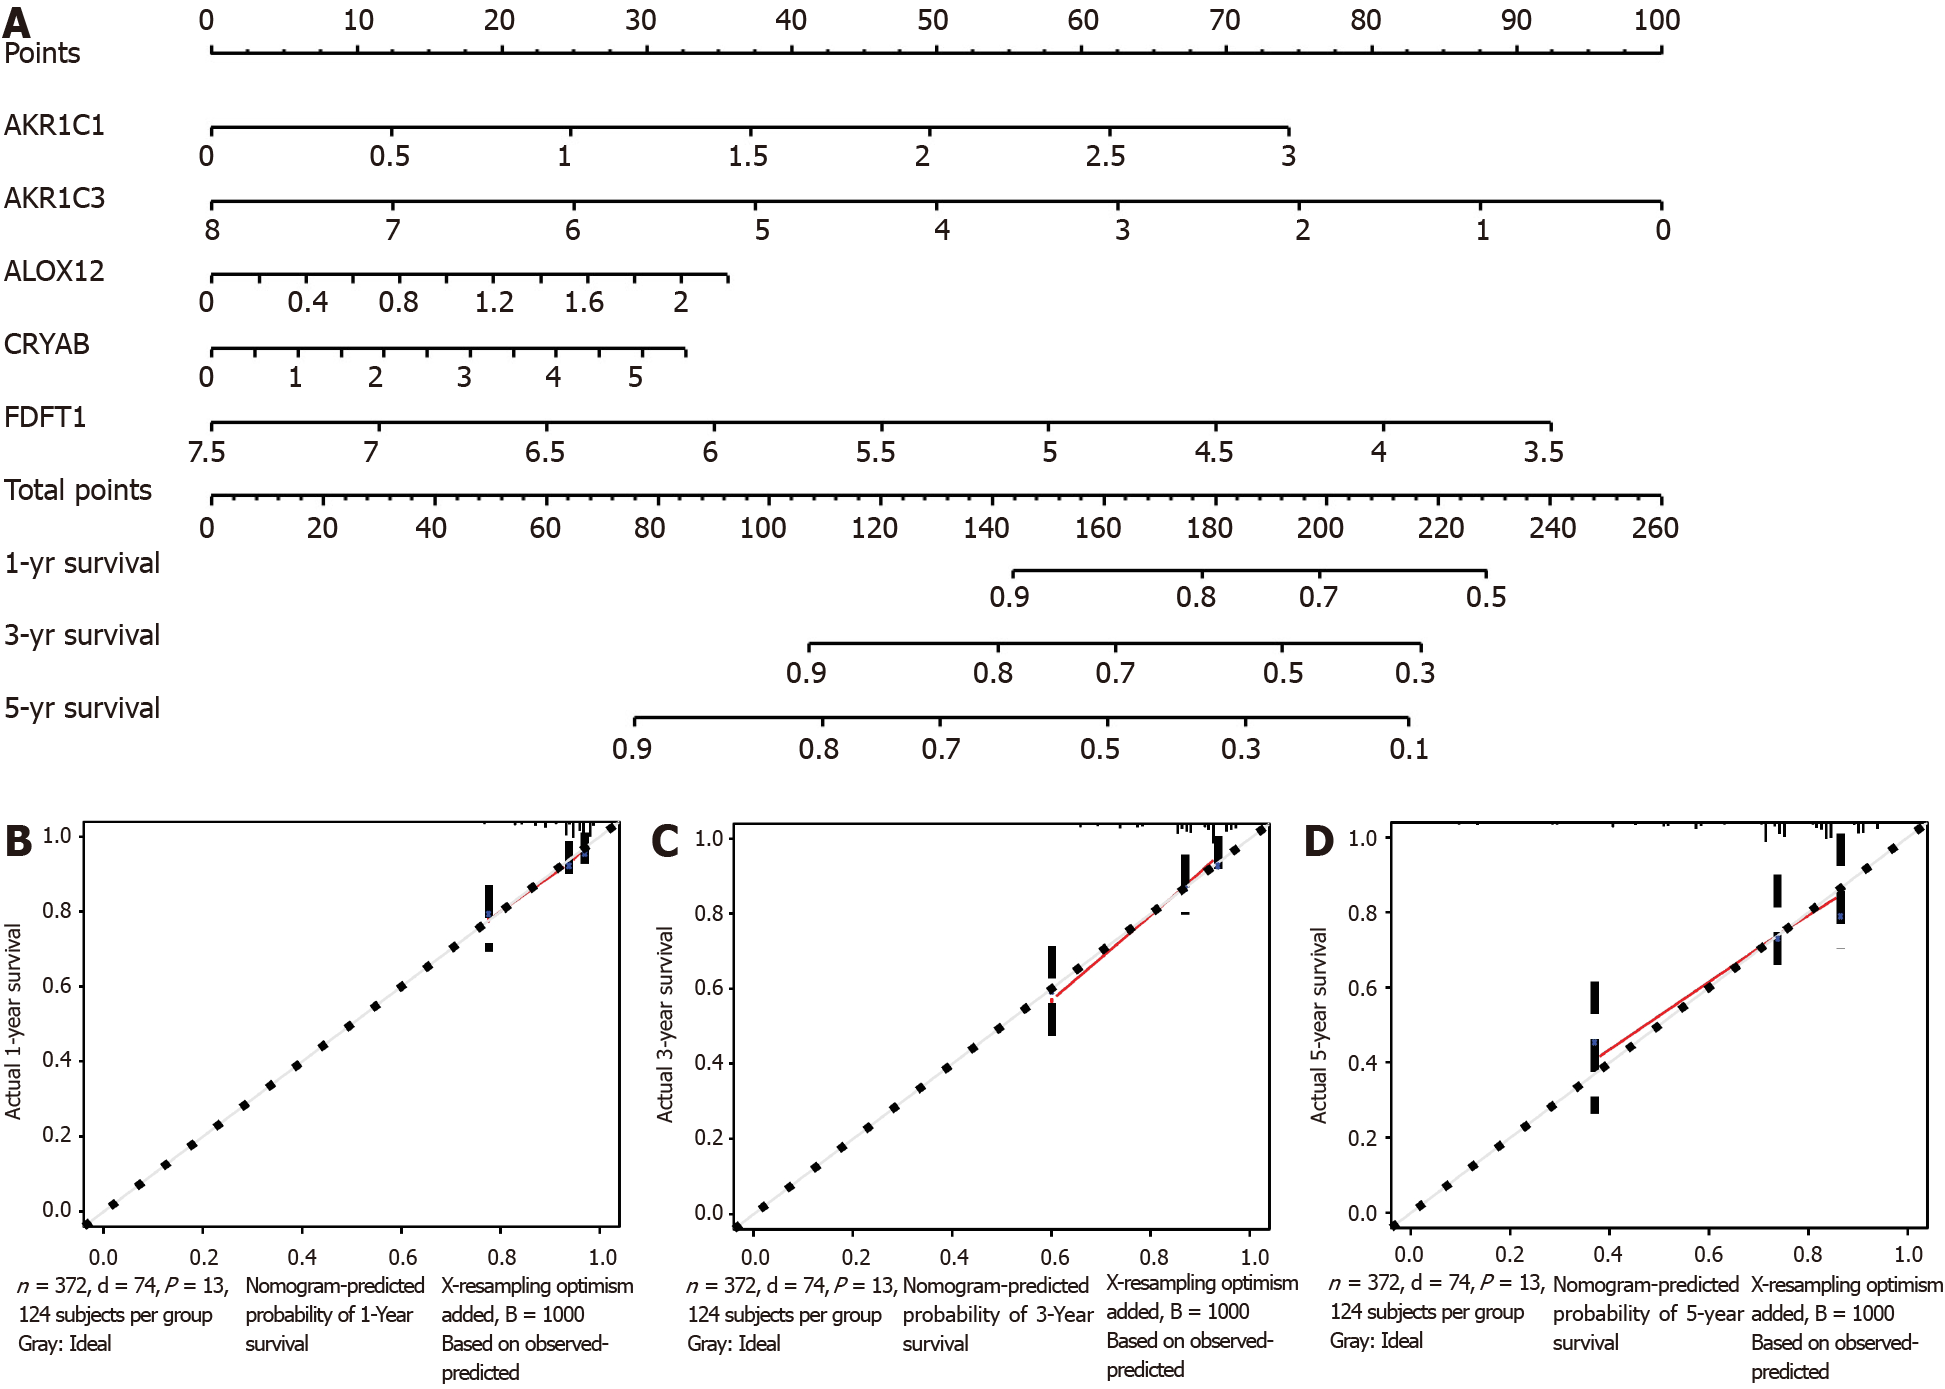
Figure 7 Nomogram for predicting the prognostic ability of The Cancer Genome Atlas database-colon adenocarcinoma.
A: Nomogram for predicting 1-, 3-, and 5-year overall survival of colon adenocarcinoma by the expression of the five ferroptosis-related genes; B-D: 1-, 3-, and 5-year calibration curves of the Cancer Genome Atlas database-colon adenocarcinoma. The X axis represents the predicted survival time, and the Y axis demonstrates the actual survival time.
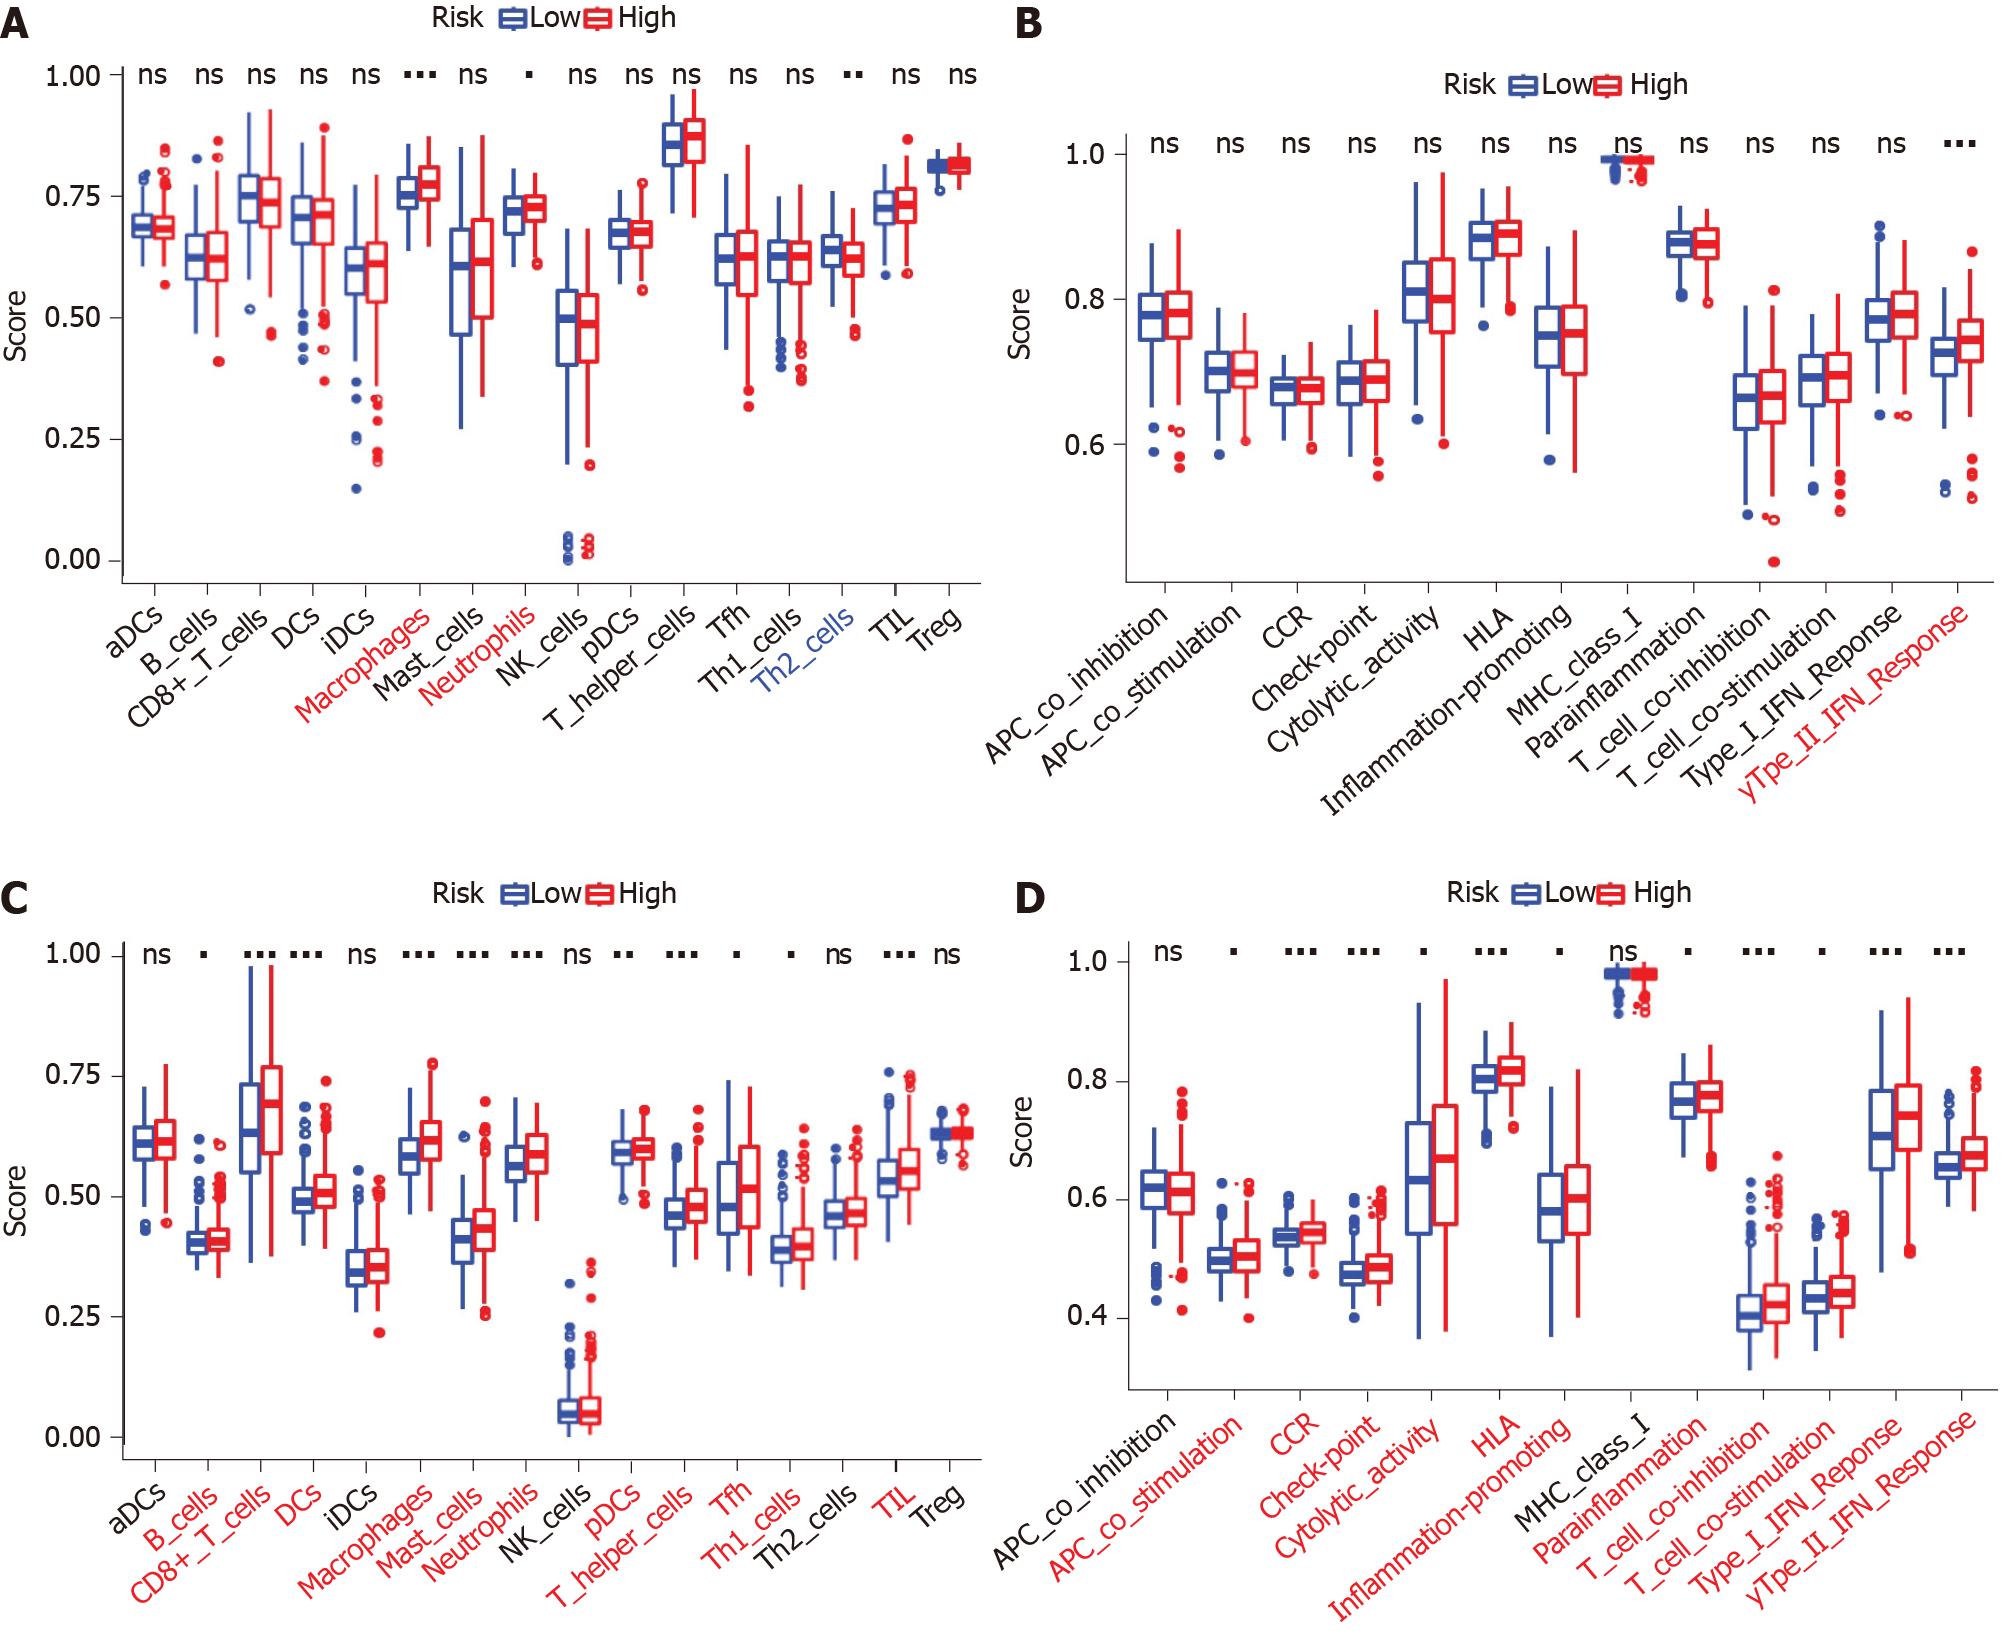
Figure 8 Comparison of the single sample gene set enrichment analysis scores between different risk groups in the Cancer Genome Atlas-colon adenocarcinoma database cohort and GSE39582 cohort.
A and C: Scores of 16 immune cells; B and D: 13 immune-related functions are shown in boxplots. Adjusted P values are indicated as follows: aP < 0.05; bP < 0.01; cP < 0.001. ns: Not significant. aDC: Activated dendritic cell; DC: Dendritic cell; iDC: Immature dendritic cell; NK: Natural killer; pDC: Plasmacytoid dendritic cell; TIL: Tumor infiltrating lymphocyte; Treg: Regulatory T cell; APC: Antigen presenting cell; CCR: CC chemokine receptor; HLA: Human leukocyte antigen; MHC: Major histocompatibility complex; IFN: Interferon.
Figure 9 Validation of the expression of five core ferroptosis-related genes and corresponding proteins in colon adenocarcinoma tissues and corresponding adjacent normal tissues.
The gene expression levels of AKR1C1 (A), ALOX12 (B), CRYAB (C), AKR1C3 (D), and FDFT1 (E) in colon adenocarcinoma and the corresponding normal tissues of Genotype-tissue expression and the Cancer Genome Atlas database by GEPIA2 (F). The protein expression levels of AKR1C1 (G and H), ALOX12 (I and J), CRYAB (K and L), AKR1C3 (M and N), and FDFT1 (O and P) in colon adenocarcinoma and the corresponding normal tissues by the Human Protein Atlas database. COAD: Colon adenocarcinoma; HPA: Human Protein Atlas.
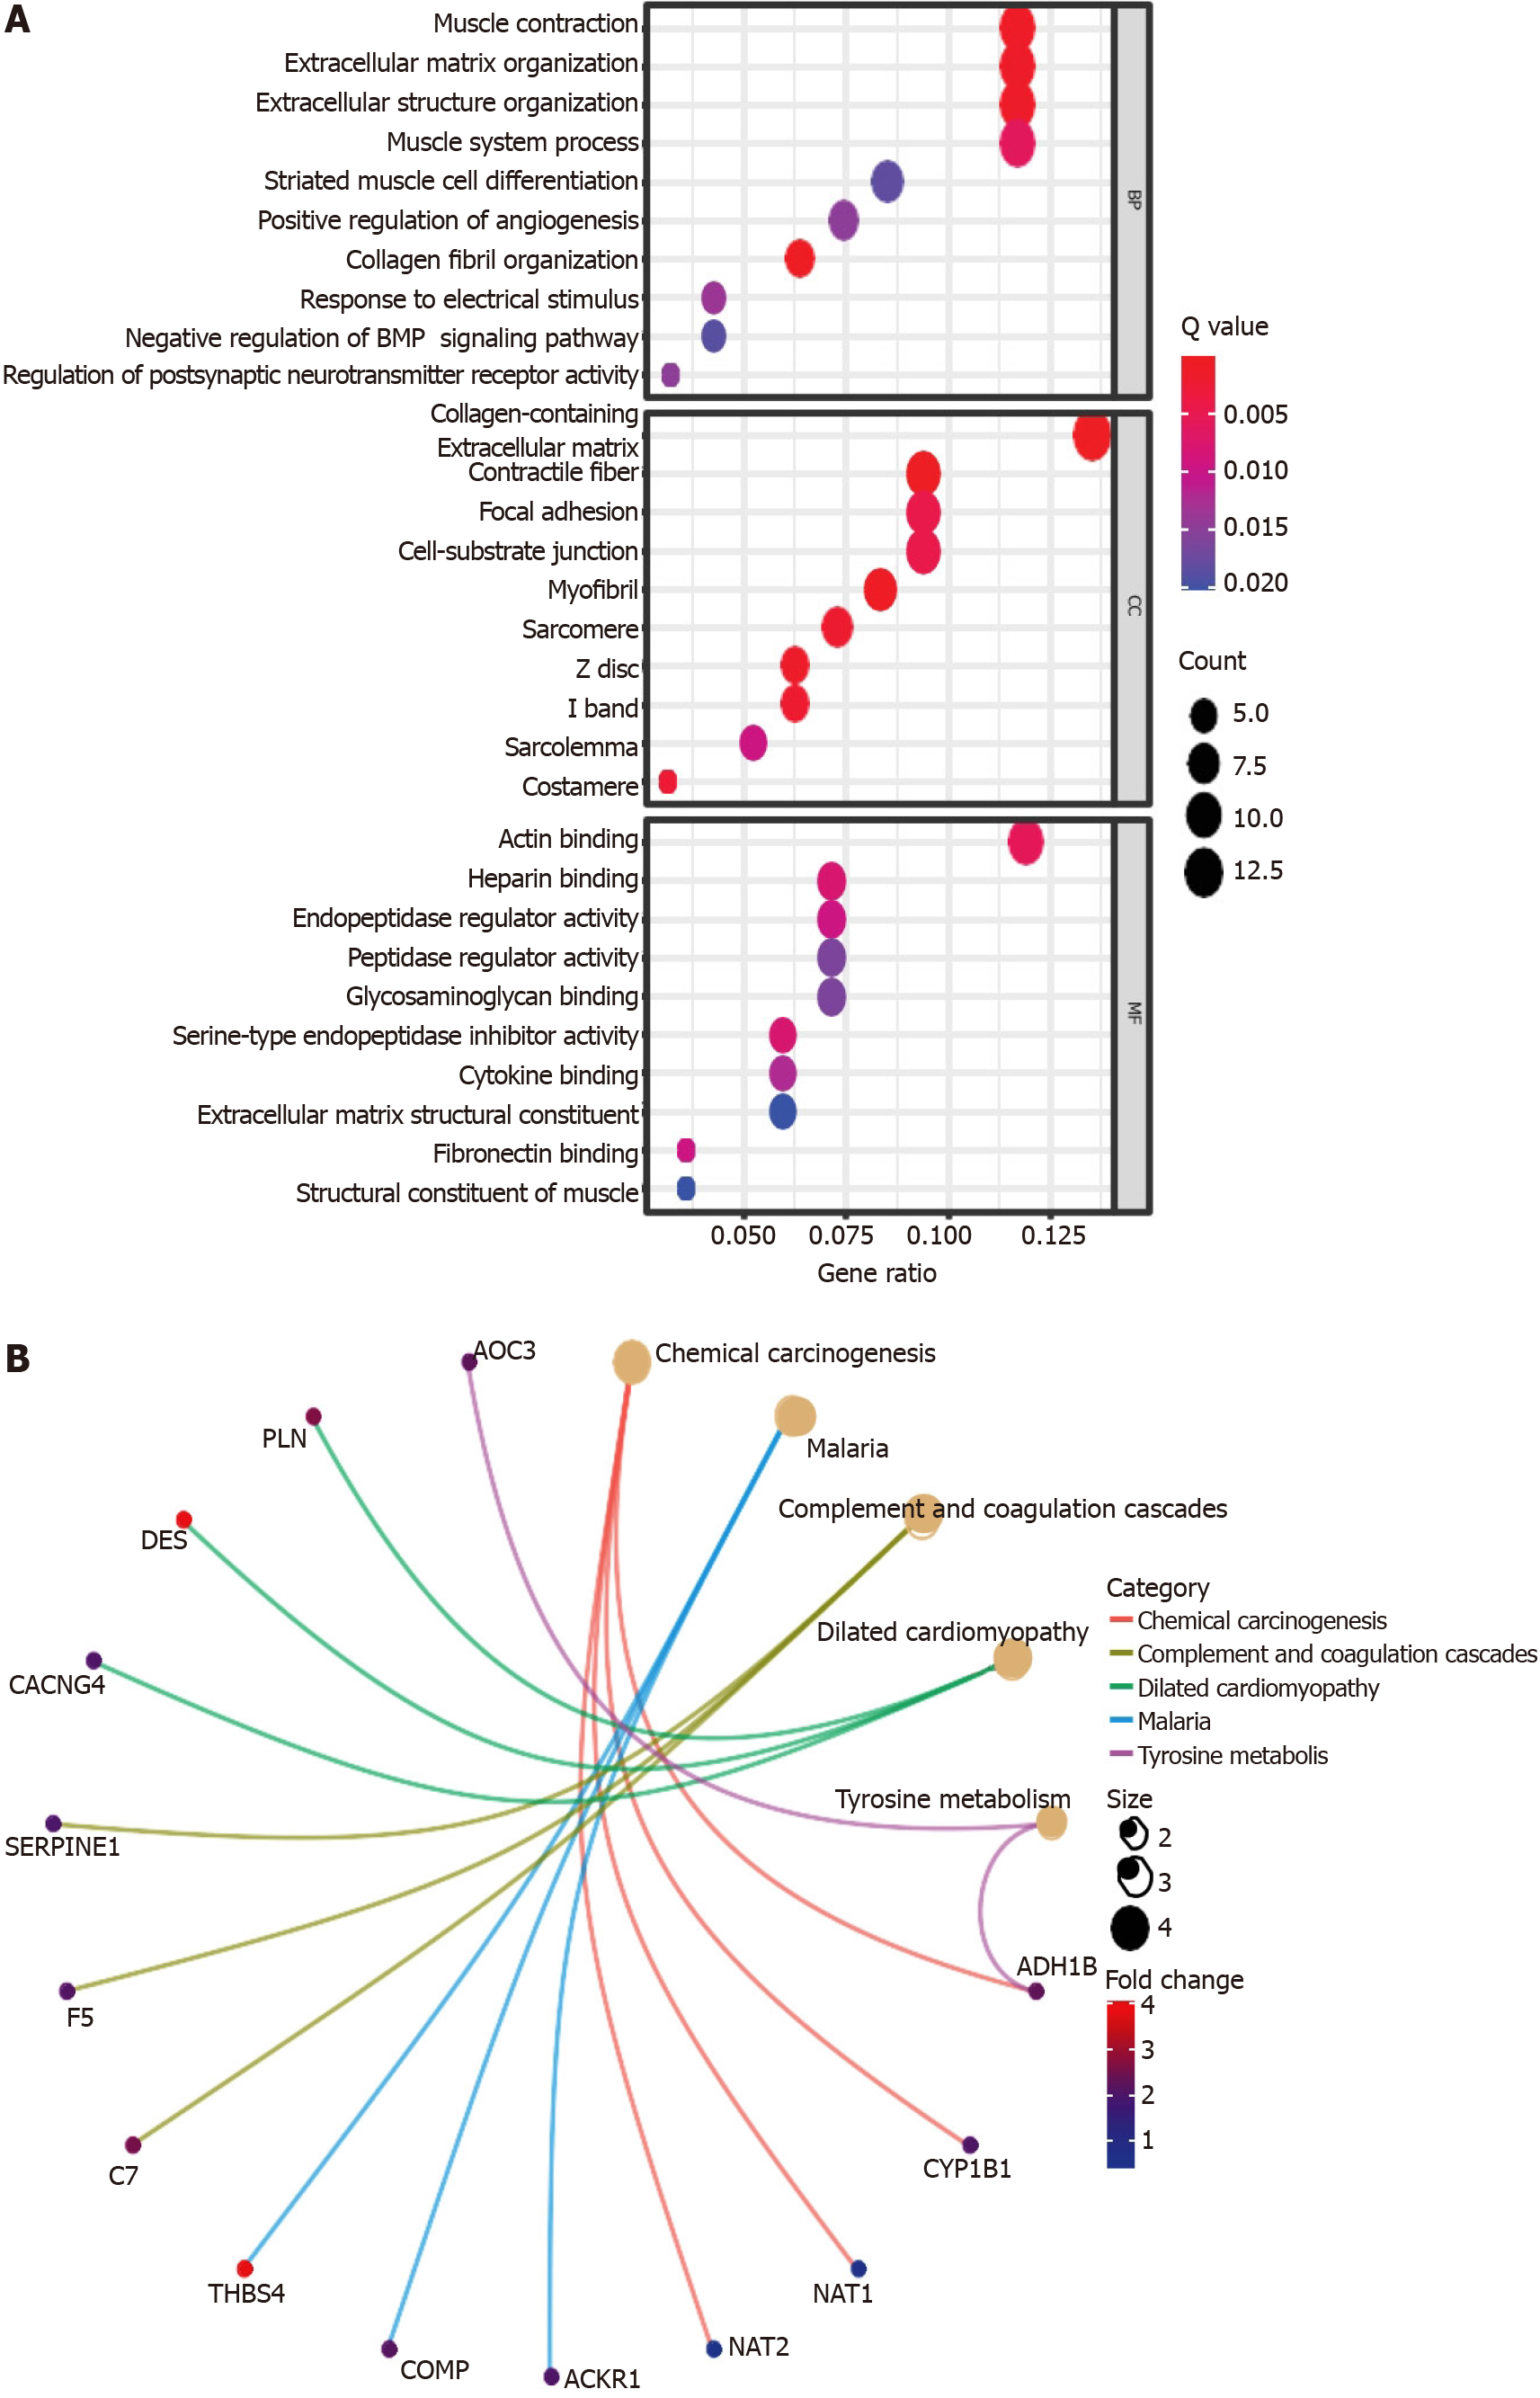
Figure 10 Representative results of the Gene Ontology and Kyoto Encyclopedia of Genes and Genomes analyses.
The most significant Gene Ontology enrichment (A) and Kyoto Encyclopedia of Genes and Genomes pathways (B) in the Cancer Genome Atlas-colon adenocarcinoma cohort.
- Citation: Miao YD, Kou ZY, Wang JT, Mi DH. Prognostic implications of ferroptosis-associated gene signature in colon adenocarcinoma. World J Clin Cases 2021; 9(29): 8671-8693
- URL: https://www.wjgnet.com/2307-8960/full/v9/i29/8671.htm
- DOI: https://dx.doi.org/10.12998/wjcc.v9.i29.8671


