Copyright
©The Author(s) 2020.
World J Clin Cases. Oct 26, 2020; 8(20): 4986-4992
Published online Oct 26, 2020. doi: 10.12998/wjcc.v8.i20.4986
Published online Oct 26, 2020. doi: 10.12998/wjcc.v8.i20.4986
Figure 1 Anastomosing hemangioma of left renal vein on computed tomography.
A: Non-contrast-enhanced scan; B: Arterial phase of contrast-enhanced scan; C: Portal phase of contrast-enhanced scan.
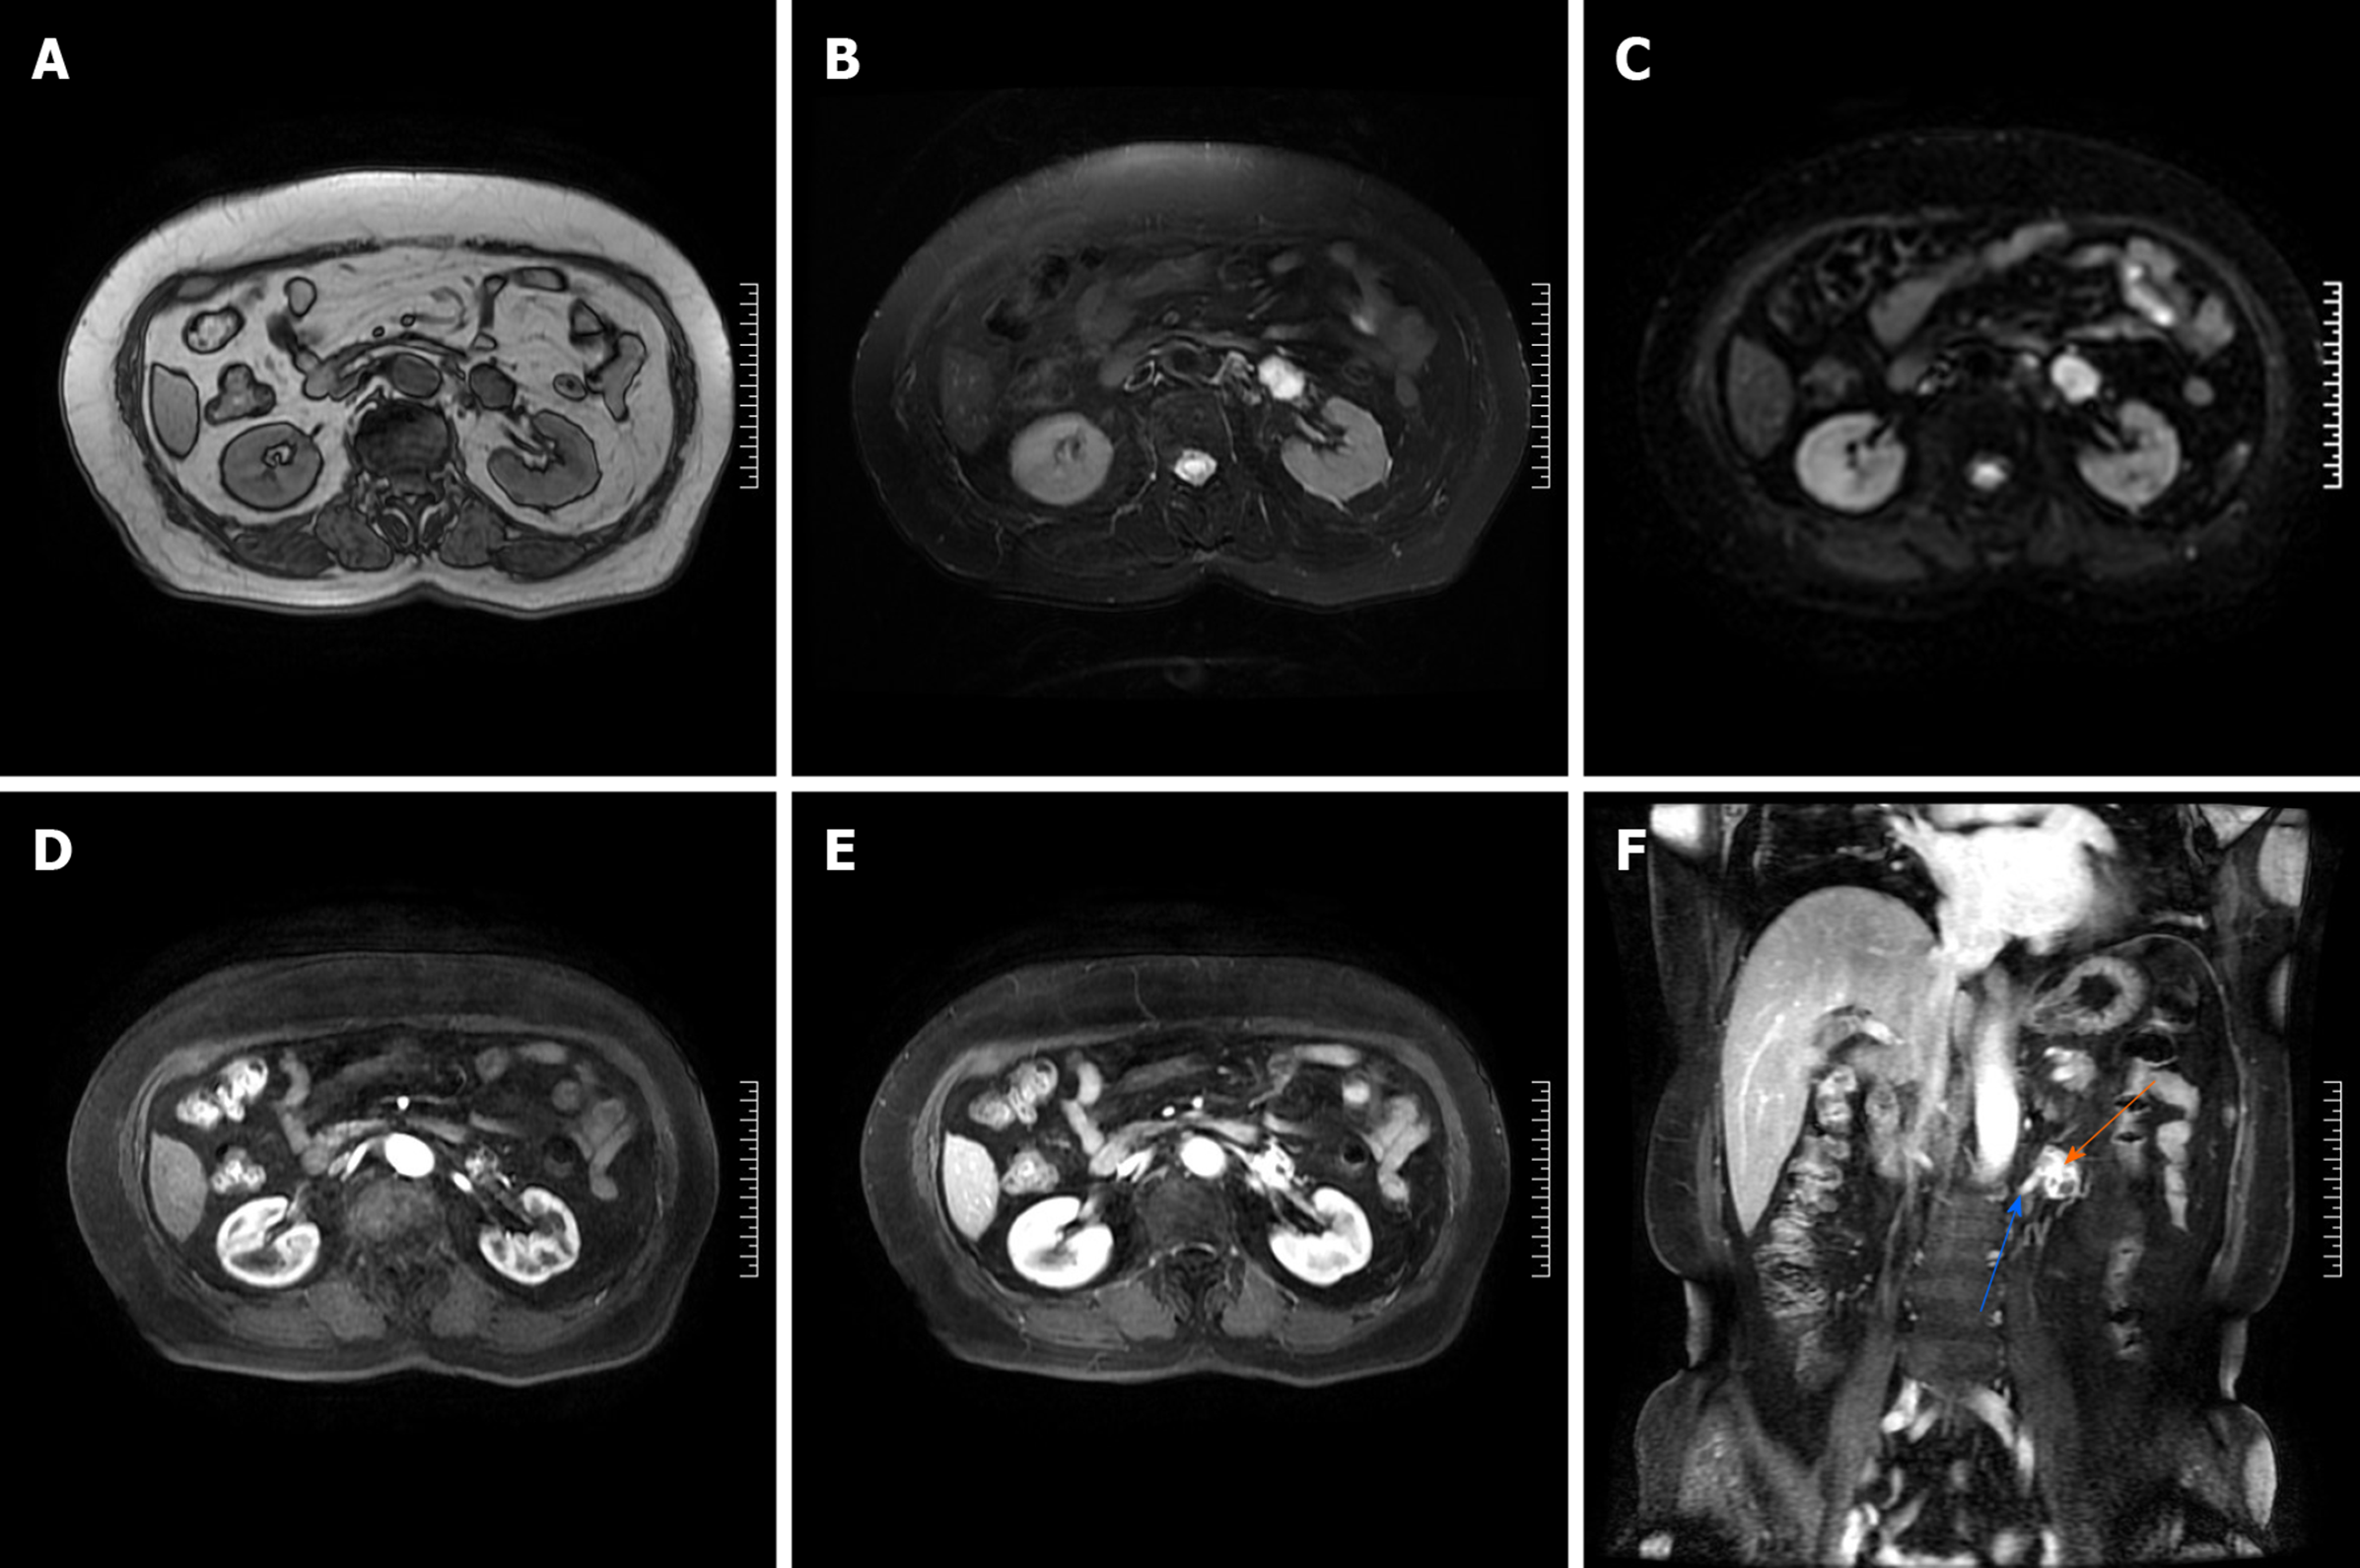
Figure 2 Anastomosing hemangioma of left renal vein on magnetic resonance imaging.
A: T1-weighted image; B: T2-weighted image; C: Diffusion-weighted image; D: Arterial phase post-contrast T1-weighted image; E: Portal venous phase post-contrast T1-weighted image; F: Coronal portal venous phase post-contrast T1-weighted image. Orange arrow marks the anastomosing hemangioma, and blue arrow marks the left renal vein.
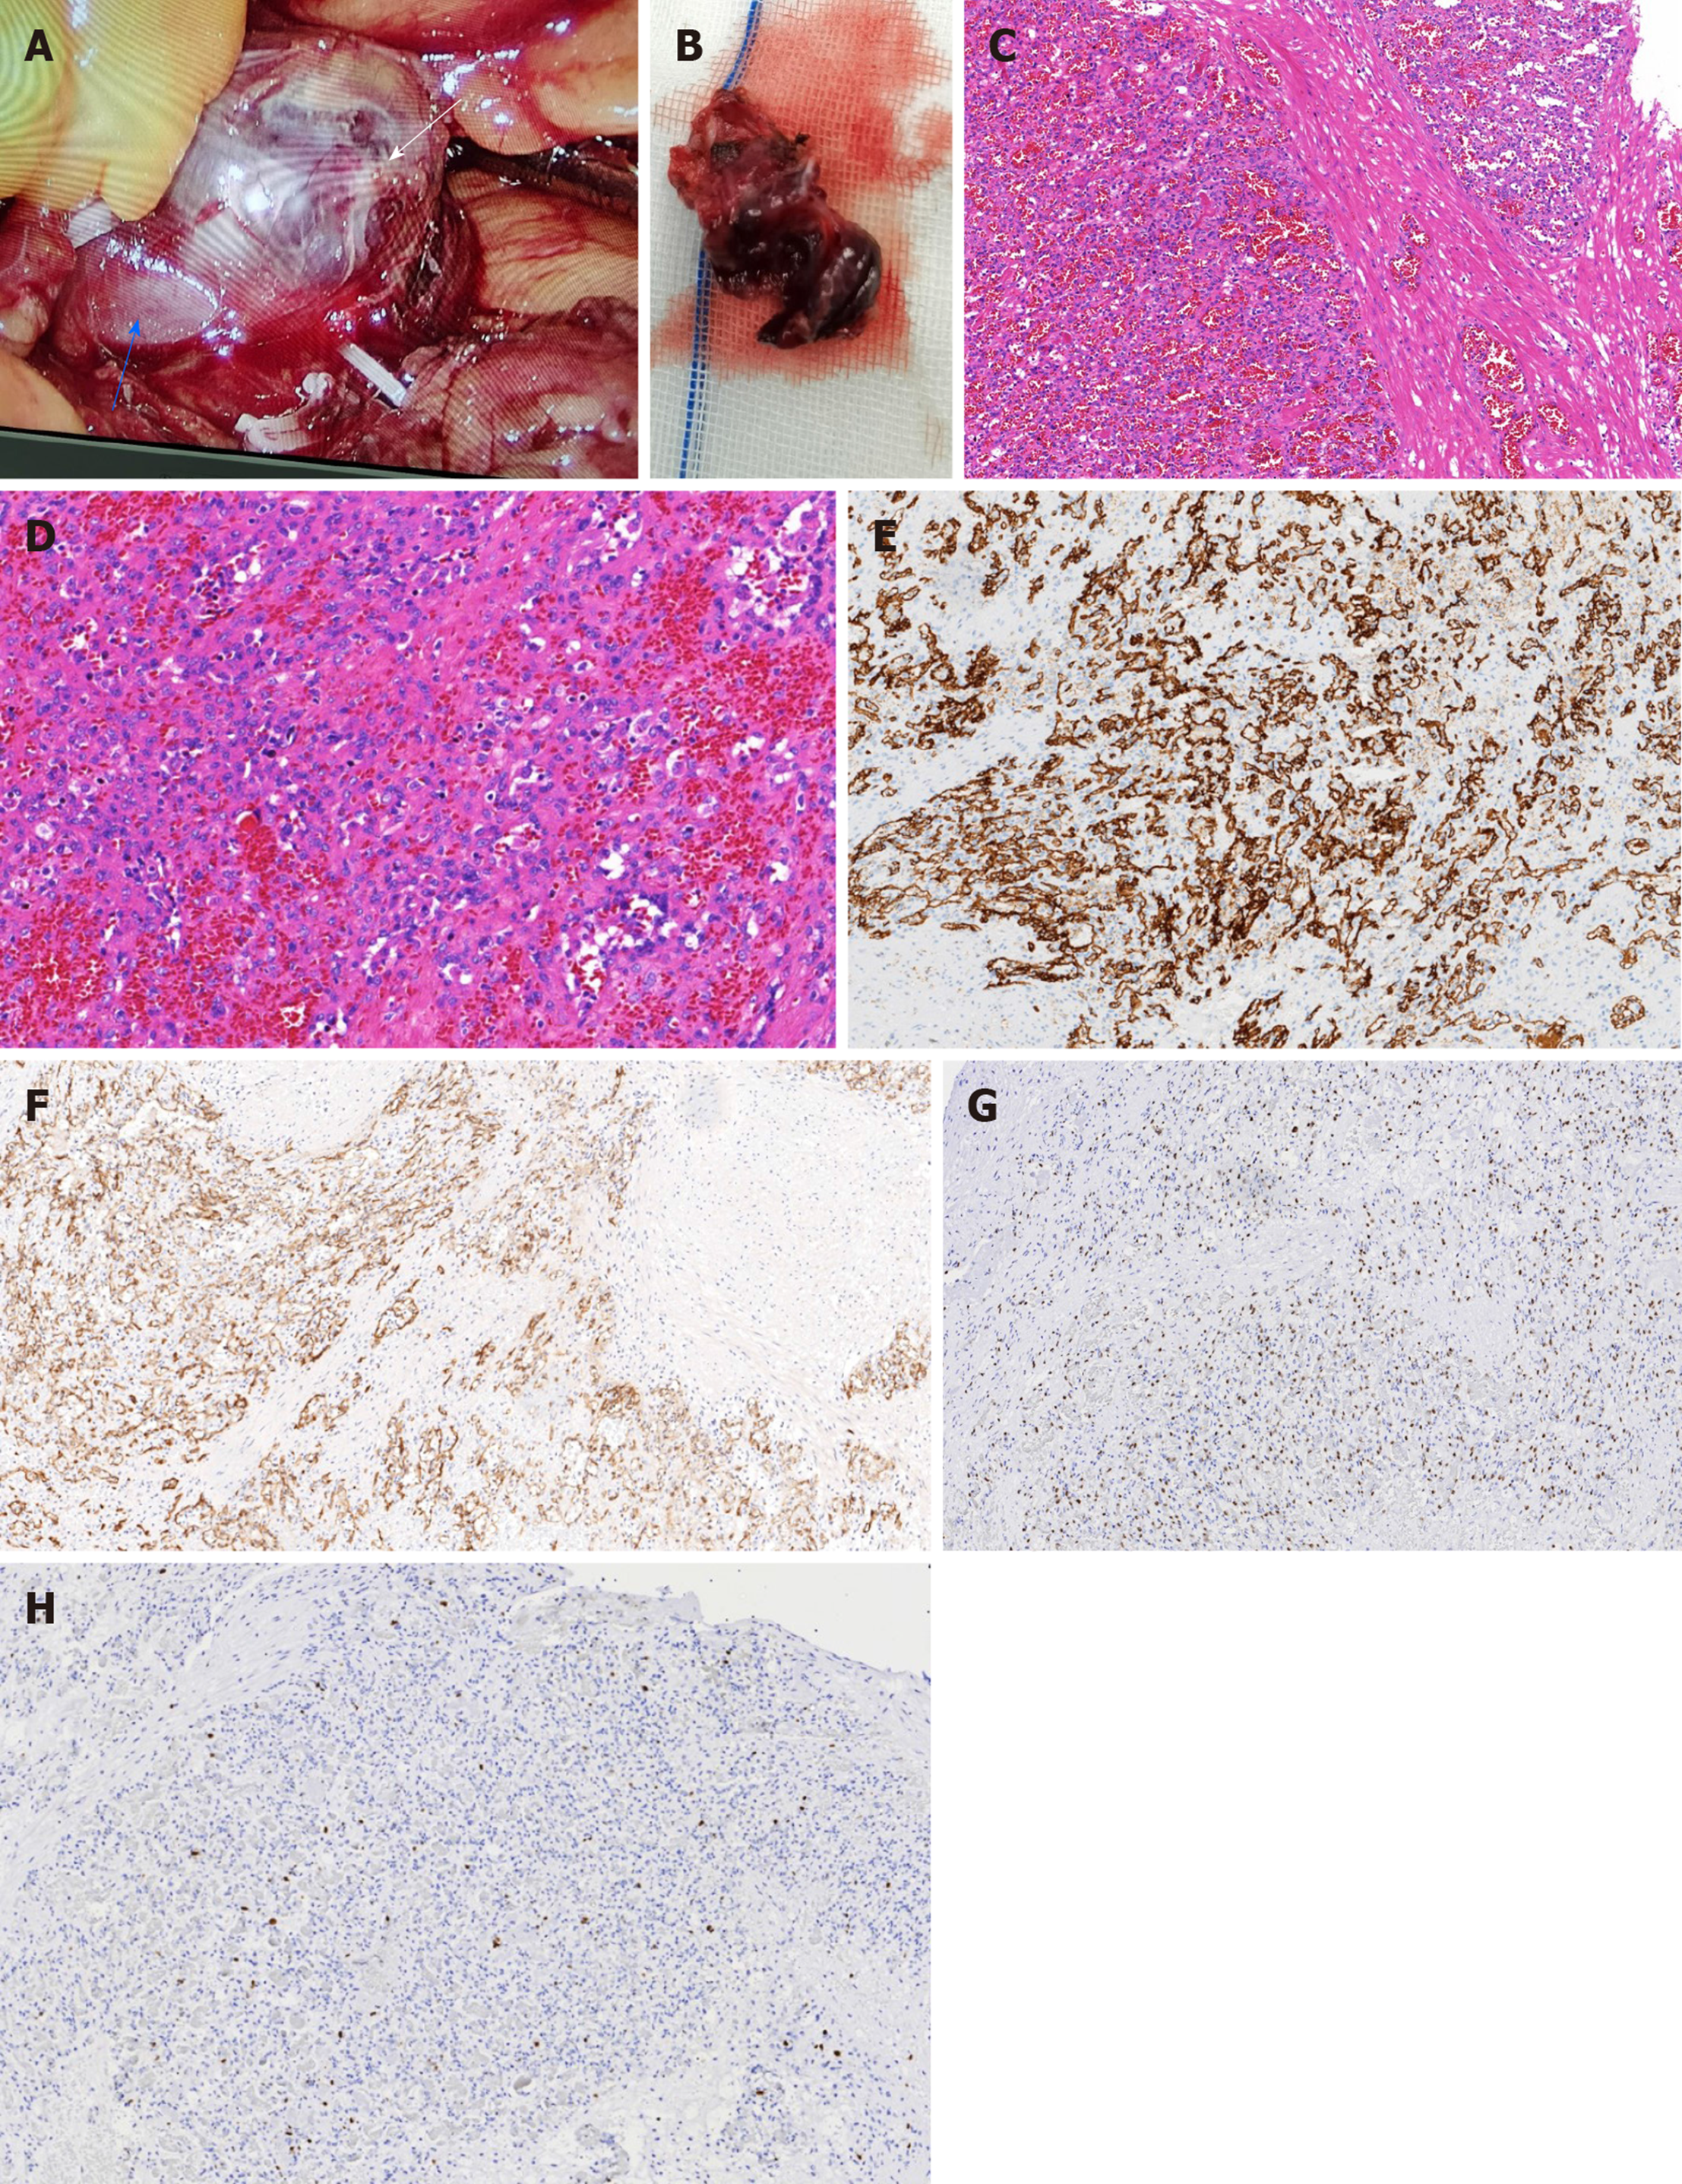
Figure 3 Histopathological findings of anastomosing hemangioma.
A: In situ anastomosing hemangioma (AH, white arrow) and the left renal vein (blue arrow); B: Cut surface of the AH; C: Hematoxylin and eosin (H&E) staining (magnification: 100 ×); D: H&E staining (magnification: 200 ×); E-H: Immunohistochemical staining (magnification: 100 ×) for CD31 (E), CD34 (F), ERG (G), and Ki 67 (H).
- Citation: Zheng LP, Shen WA, Wang CH, Hu CD, Chen XJ, Shen YY, Wang J. Anastomosing hemangioma arising from the left renal vein: A case report. World J Clin Cases 2020; 8(20): 4986-4992
- URL: https://www.wjgnet.com/2307-8960/full/v8/i20/4986.htm
- DOI: https://dx.doi.org/10.12998/wjcc.v8.i20.4986


