Copyright
©The Author(s) 2020.
World J Clin Cases. Oct 26, 2020; 8(20): 4966-4974
Published online Oct 26, 2020. doi: 10.12998/wjcc.v8.i20.4966
Published online Oct 26, 2020. doi: 10.12998/wjcc.v8.i20.4966
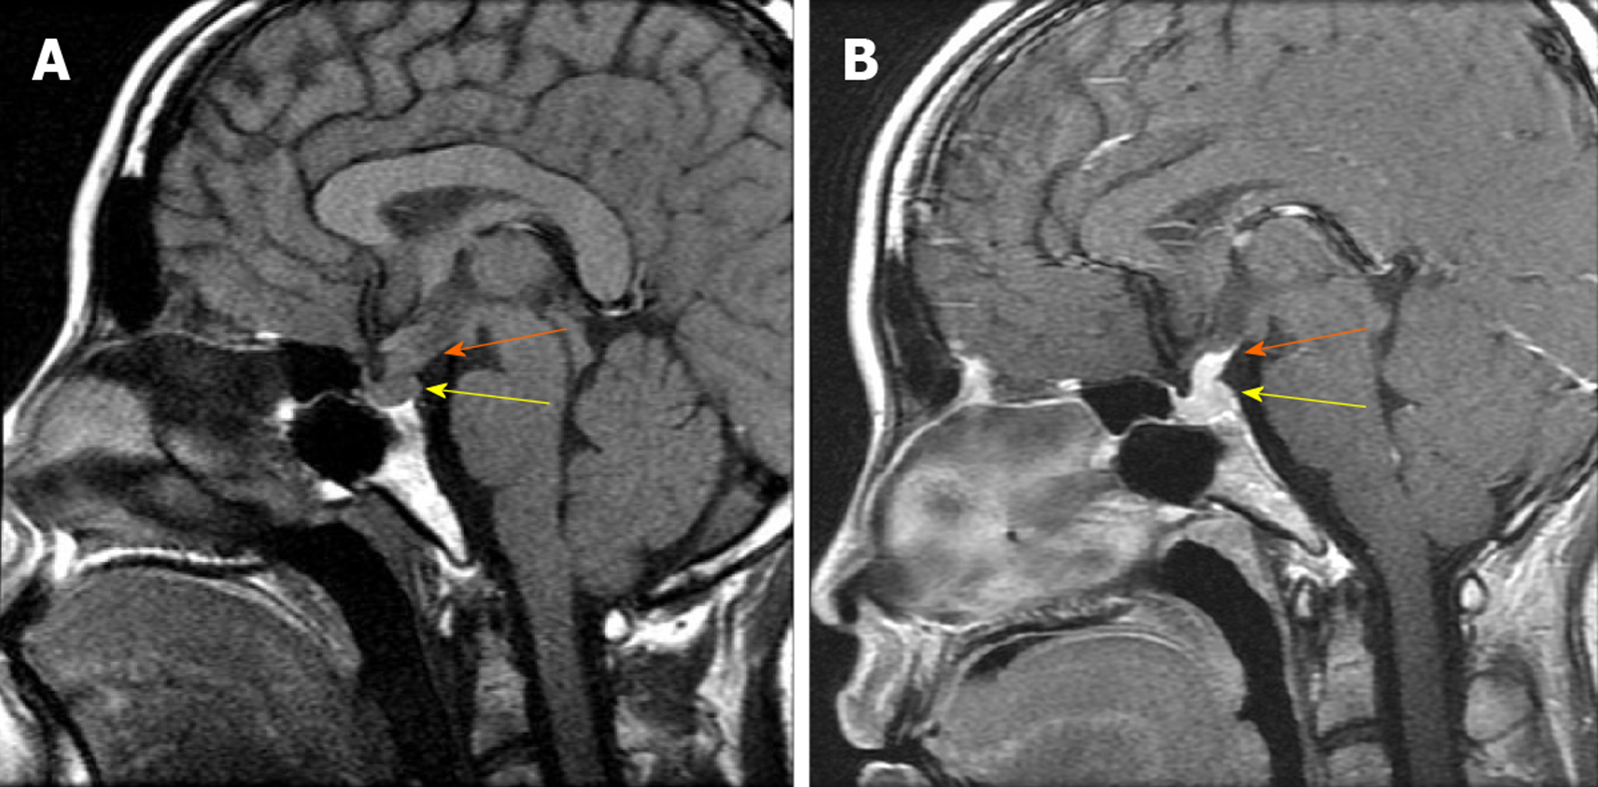
Figure 1 Pituitary magnetic resonance imaging findings.
A: T1-weighted magnetic resonance imaging (MRI) images from May 2007 reveal posterior pituitary lesions (yellow arrow) with the absence of the posterior ‘bright spot’ and an enlarged pituitary stalk (orange arrow), whereas the anterior pituitary, supra sellar cistern, and adjacent skull were normal; B: Enhanced T1-weighted images (WIs) MRI images from May 2007 show uniform intensification of the posterior pituitary (yellow arrow) and the enlarged pituitary stalk (orange arrow).
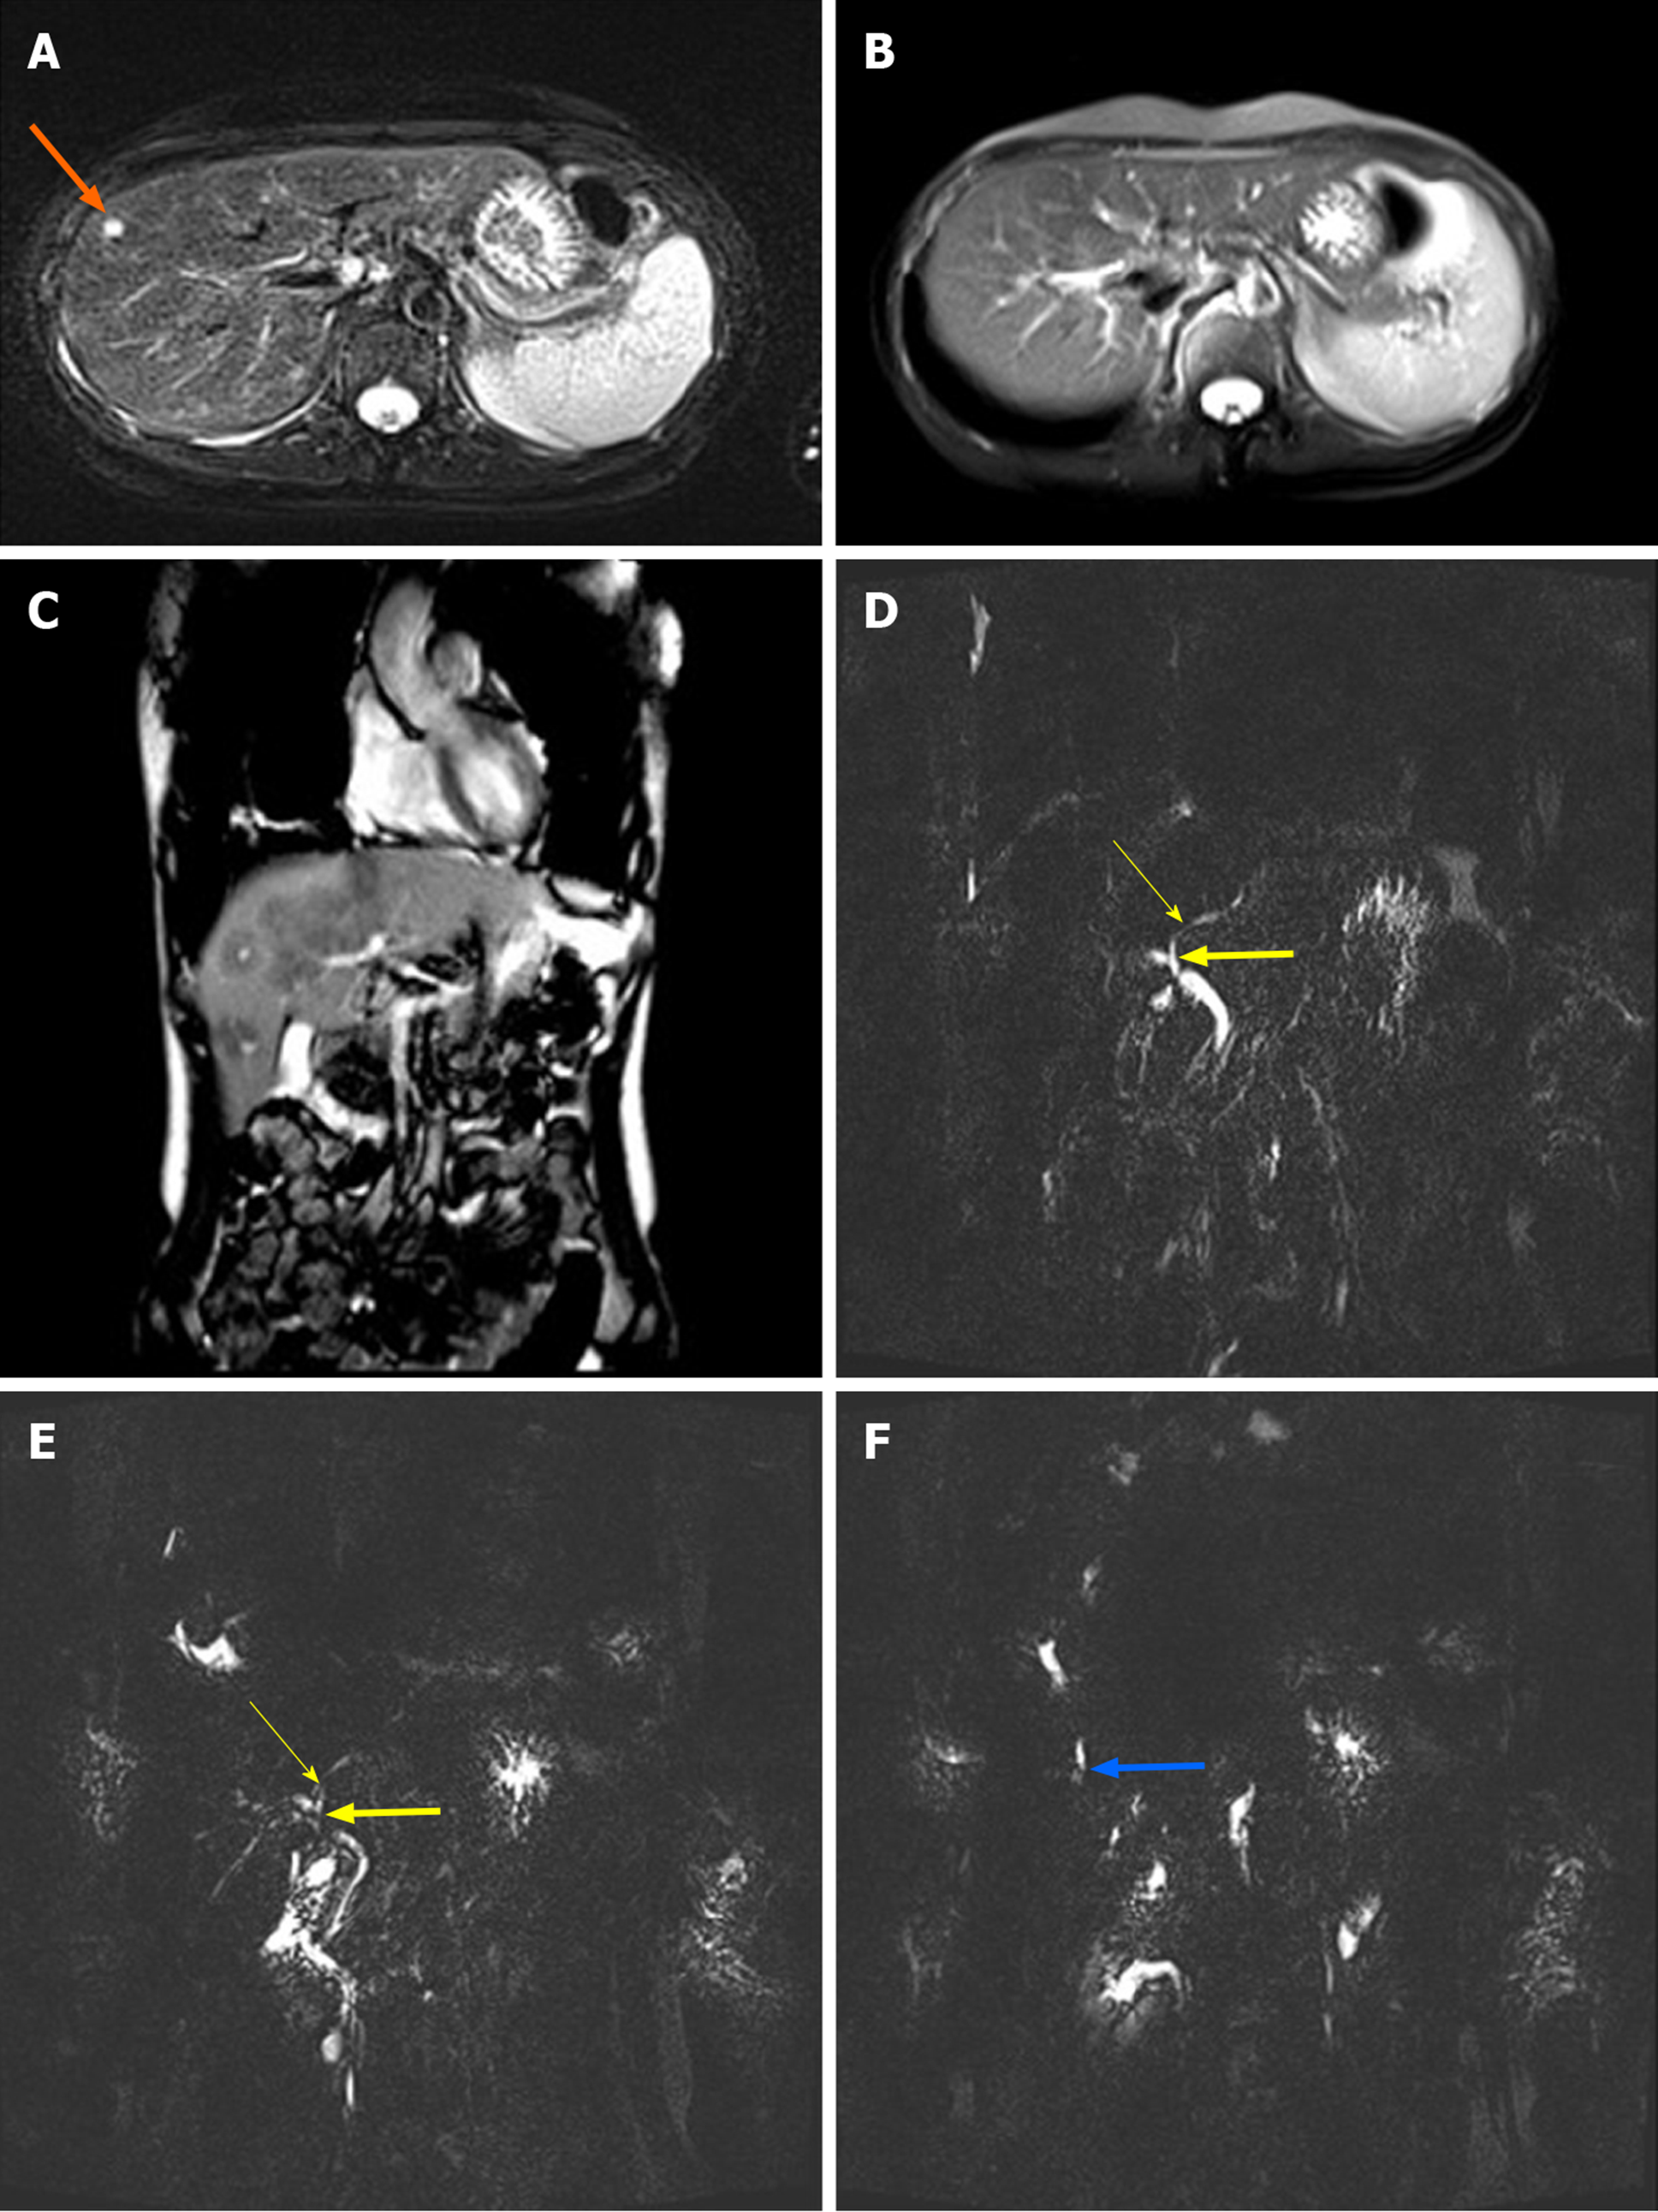
Figure 2 Liver magnetic resonance imaging and magnetic resonance cholangiopancreatography findings.
A: T2-weighted magnetic resonance imaging (MRI) images from July 2014 exhibited hyperintense nodules approximately 6 mm in size in the right lobe of the liver (orange arrow); B: T2-weighted MRI images from July 2019 revealed that the hyperintense nodules in the liver had disappeared; C: T2-weighted MRI images from July 2019 revealed the presence of hypointense lesions in the liver, predominantly distributed around the portal vein; D: Magnetic resonance cholangiopancreatography (MRCP) conducted in July 2014 revealed local stenosis in the left hepatic duct (thin yellow arrow) and the common hepatic duct (thick yellow arrow); E: MRCP conducted in July 2019 revealed that stenosis of the left hepatic duct (thin yellow arrow) and the common hepatic duct (thick yellow arrow) was aggravated; F: MRCP conducted in July 2019 revealed local dilation of the right intrahepatic bile duct (thick blue arrow).
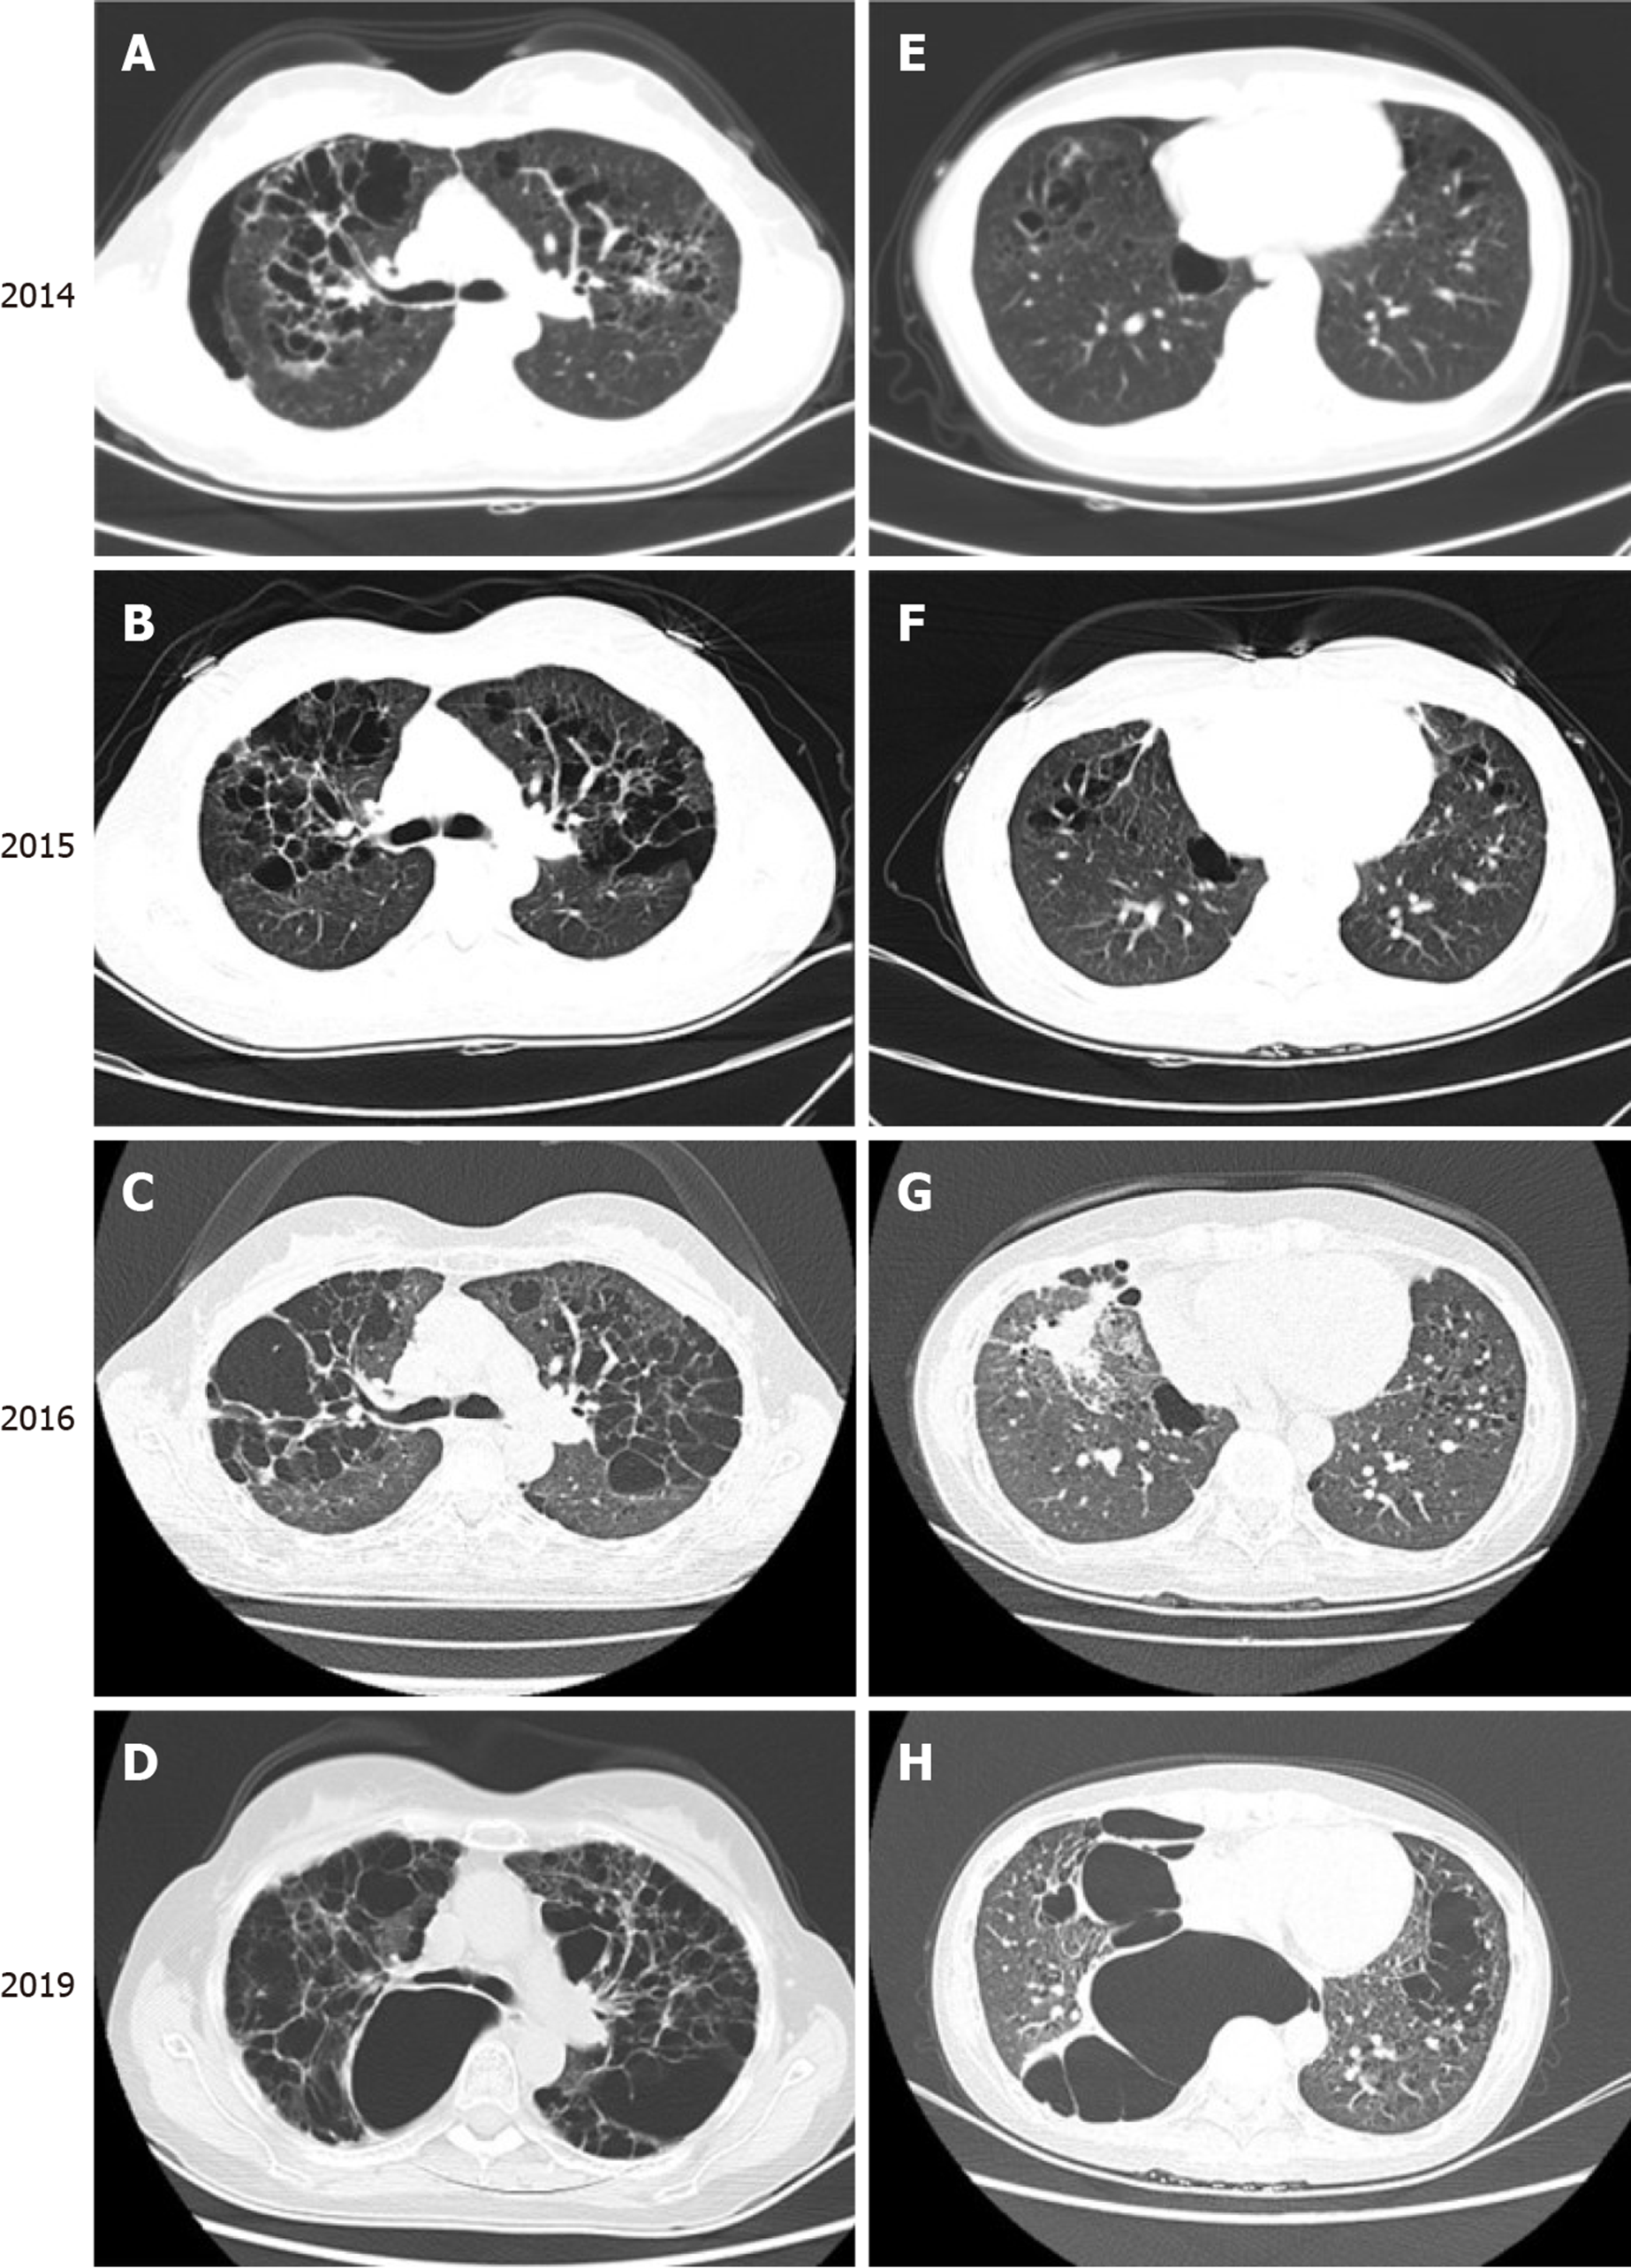
Figure 3 Chest computed tomography findings over a 5-year period.
Computed tomography results from January 2014 (A and E), January 2015 (B and F), September 2016 (C and G), and July 2019 (D and H) record the growth and progression of multiple thinly-walled cystic lesions over 5 years, predominantly in the upper and middle lungs, with some lower lung involvement. These cysts were of variable size, and some were confluent with one another.
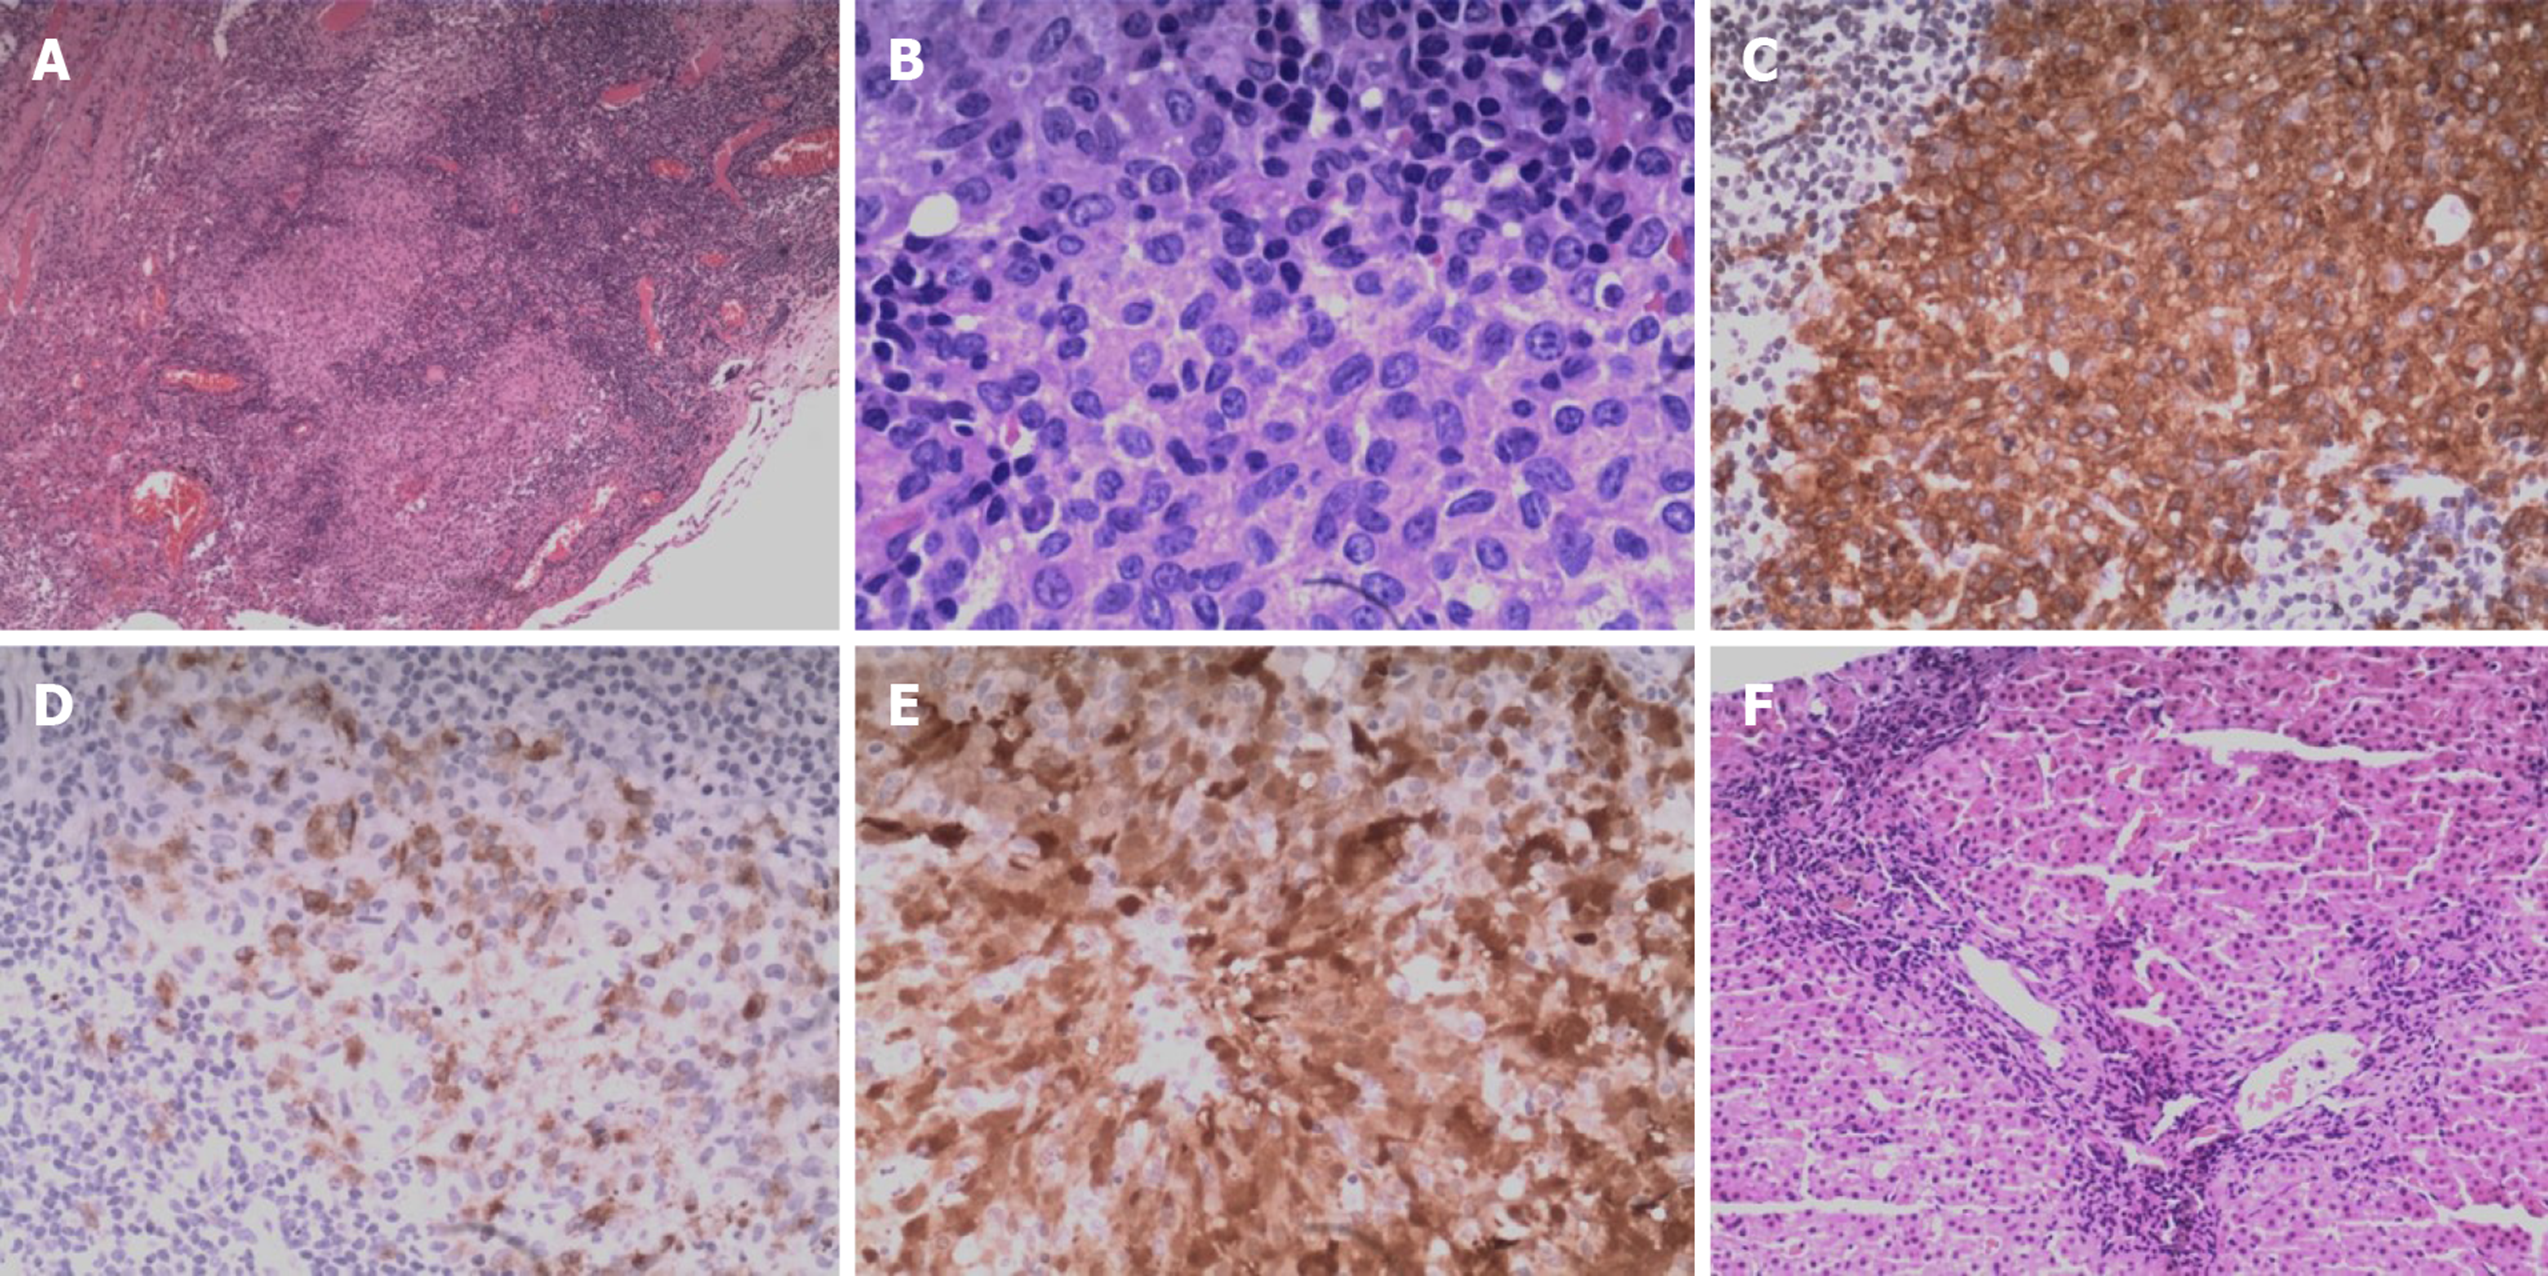
Figure 4 Histologic examination of the right pulmonary bullae sections and liver biopsy samples.
A: Nodular clusters of histiocytes were detectable upon histologic assessment of the bullae samples, as was evidence of fibrosis and inflammation (hematoxylin & eosin, × 4). B: The cells in bullae samples exhibited a pronounced cytoplasm as well as mild cytologic atypia, slight nuclear enlargement, and the presence of nuclear grooves (hematoxylin & eosin, × 40). C-E: Langerhans cells show immunopositivity for CD1a (C), CD207 (D), and S-100 (E) (× 20). F: Liver biopsy demonstrated chronic portal fibrosis with ductular damage and proliferation (hematoxylin & eosin, × 10).
Figure 5 18F-fluorodeoxyglucose positron emission tomography/computed tomography image on July 2019.
Abnormal FDG uptake in the bilateral parotid gland (A), bilateral submandibular gland (B), liver, and rib (C).
- Citation: Wang BB, Ye JR, Li YL, Jin Y, Chen ZW, Li JM, Li YP. Multisystem involvement Langerhans cell histiocytosis in an adult: A case report. World J Clin Cases 2020; 8(20): 4966-4974
- URL: https://www.wjgnet.com/2307-8960/full/v8/i20/4966.htm
- DOI: https://dx.doi.org/10.12998/wjcc.v8.i20.4966


