Copyright
©The Author(s) 2020.
World J Clin Cases. Oct 26, 2020; 8(20): 4958-4965
Published online Oct 26, 2020. doi: 10.12998/wjcc.v8.i20.4958
Published online Oct 26, 2020. doi: 10.12998/wjcc.v8.i20.4958
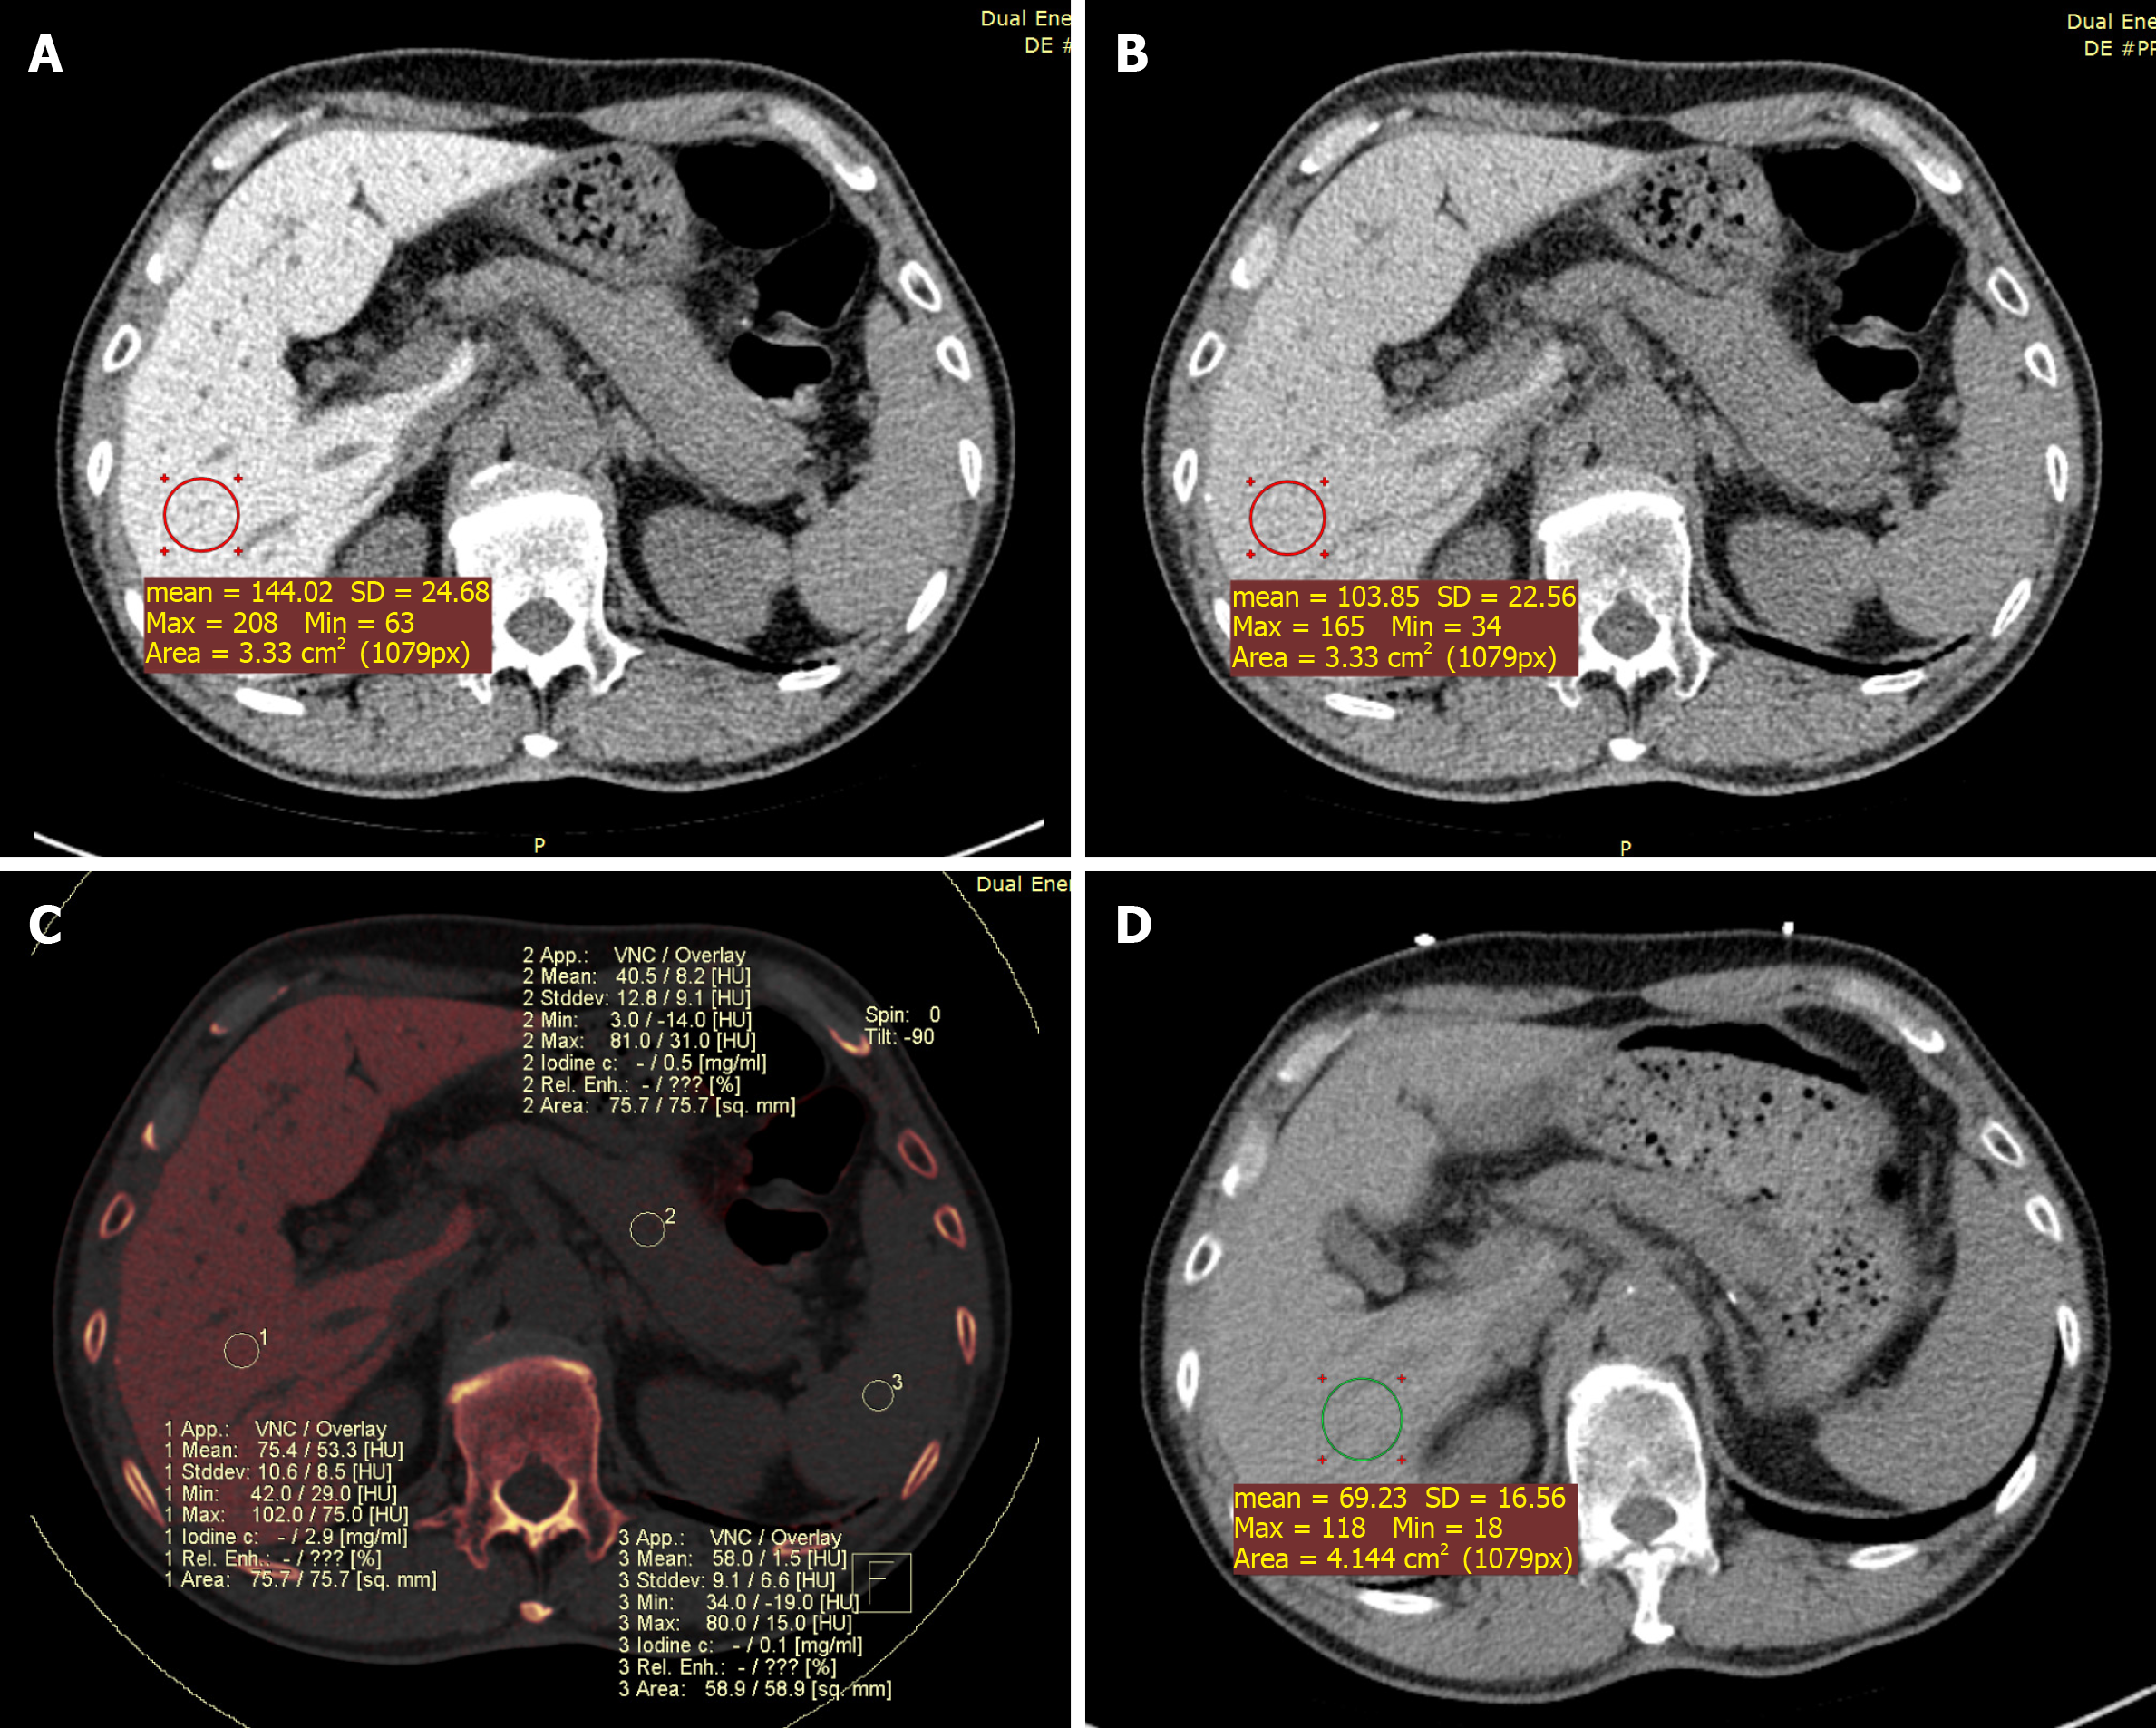
Figure 1 Dual-energy computed tomography images and fused iodine imaging.
These images were obtained in a 66-year-old male with liver dysfunction after therapy with amiodarone for ten years. All regions of interest (ROIs) measurements were obtained at the same level for calculations. In this case, the liver attenuation at 100 kVp was 144 Hounsfield unit (HU) and at 140 kVp was 104 HU. The color-coded iodine map reveals high iodine depositions in the liver; iodine concentration was 2.9 mg/mL (C, ROI 1). A: The 100 kVp image attenuation; B: The 140 kVp image attenuation; C: Iodine density; D: Chest non-enhanced computed tomography showed that liver attenuation at 120 kVp was 69 HU one year later. SD: Standard deviation.
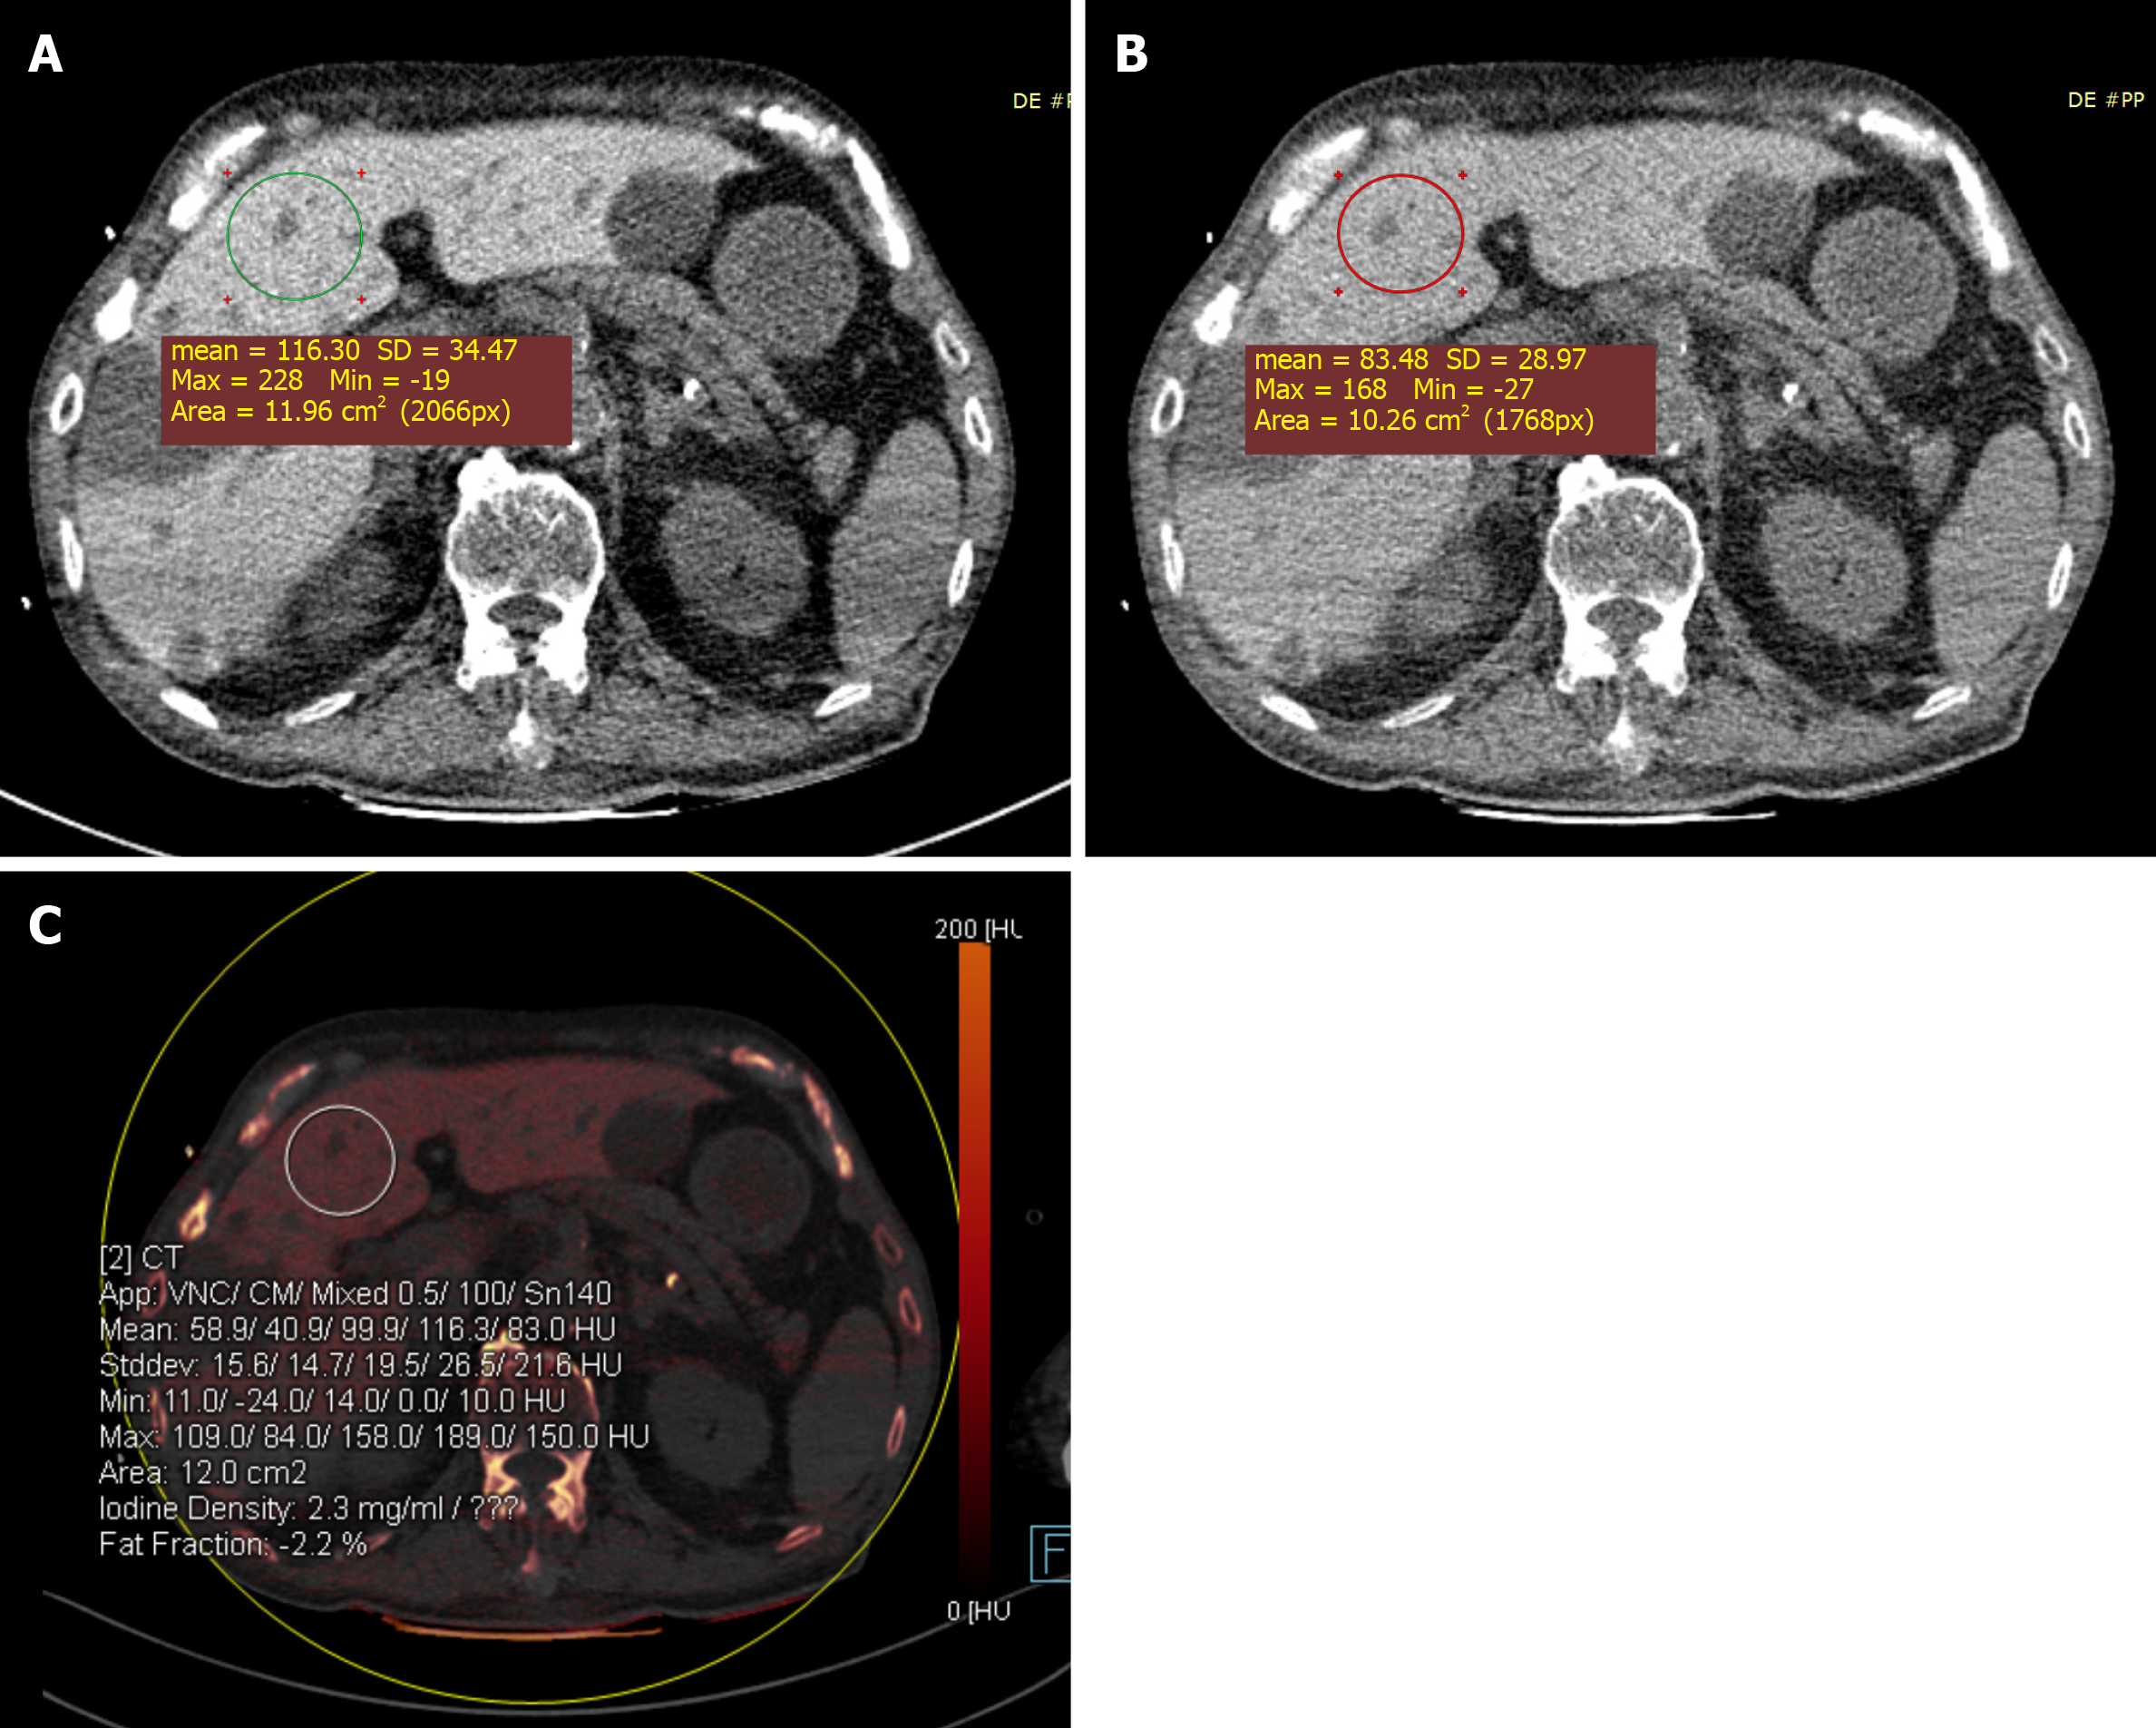
Figure 2 Color-coded iodine map was obtained in an 85-year-old male treated with amiodarone for 6 yr.
A: The liver attenuation at 100 kVp was 116 Hounsfield unit (HU); B: The liver attenuation at 140 kVp was 83 HU; C: The color-coded iodine map shows that the iodine density was 2.3 mg/mL in the liver (region of interest 2), the liver attenuation at 100 kVp was 116 HU and at 140 kVp was 83 HU. SD: Standard deviation.
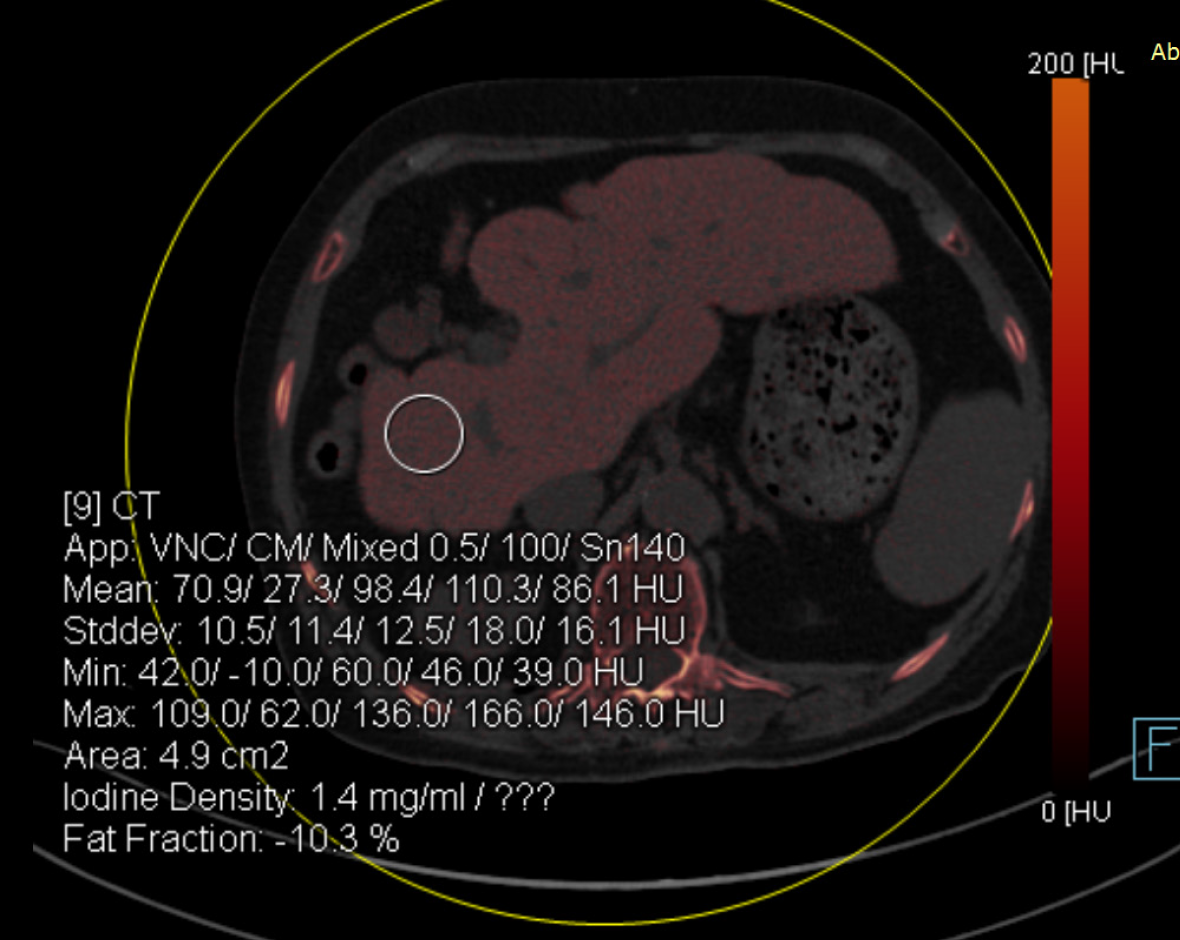
Figure 3 Color-coded iodine map was obtained in a 73-year-old female treated with amiodarone for 6 yr.
The color-coded iodine map shows that the iodine density was 1.4 mg/mL in the liver (region of interest 9), the liver attenuation at 100 kVp was 110 Hounsfield unit (HU) and at 140 kVp was 86 HU. Iodine map also showed liver cirrhosis.
- Citation: Lv HJ, Zhao HW. Amiodarone-induced hepatotoxicity — quantitative measurement of iodine density in the liver using dual-energy computed tomography: Three case reports. World J Clin Cases 2020; 8(20): 4958-4965
- URL: https://www.wjgnet.com/2307-8960/full/v8/i20/4958.htm
- DOI: https://dx.doi.org/10.12998/wjcc.v8.i20.4958


