Copyright
©The Author(s) 2020.
World J Clin Cases. Oct 26, 2020; 8(20): 4938-4945
Published online Oct 26, 2020. doi: 10.12998/wjcc.v8.i20.4938
Published online Oct 26, 2020. doi: 10.12998/wjcc.v8.i20.4938
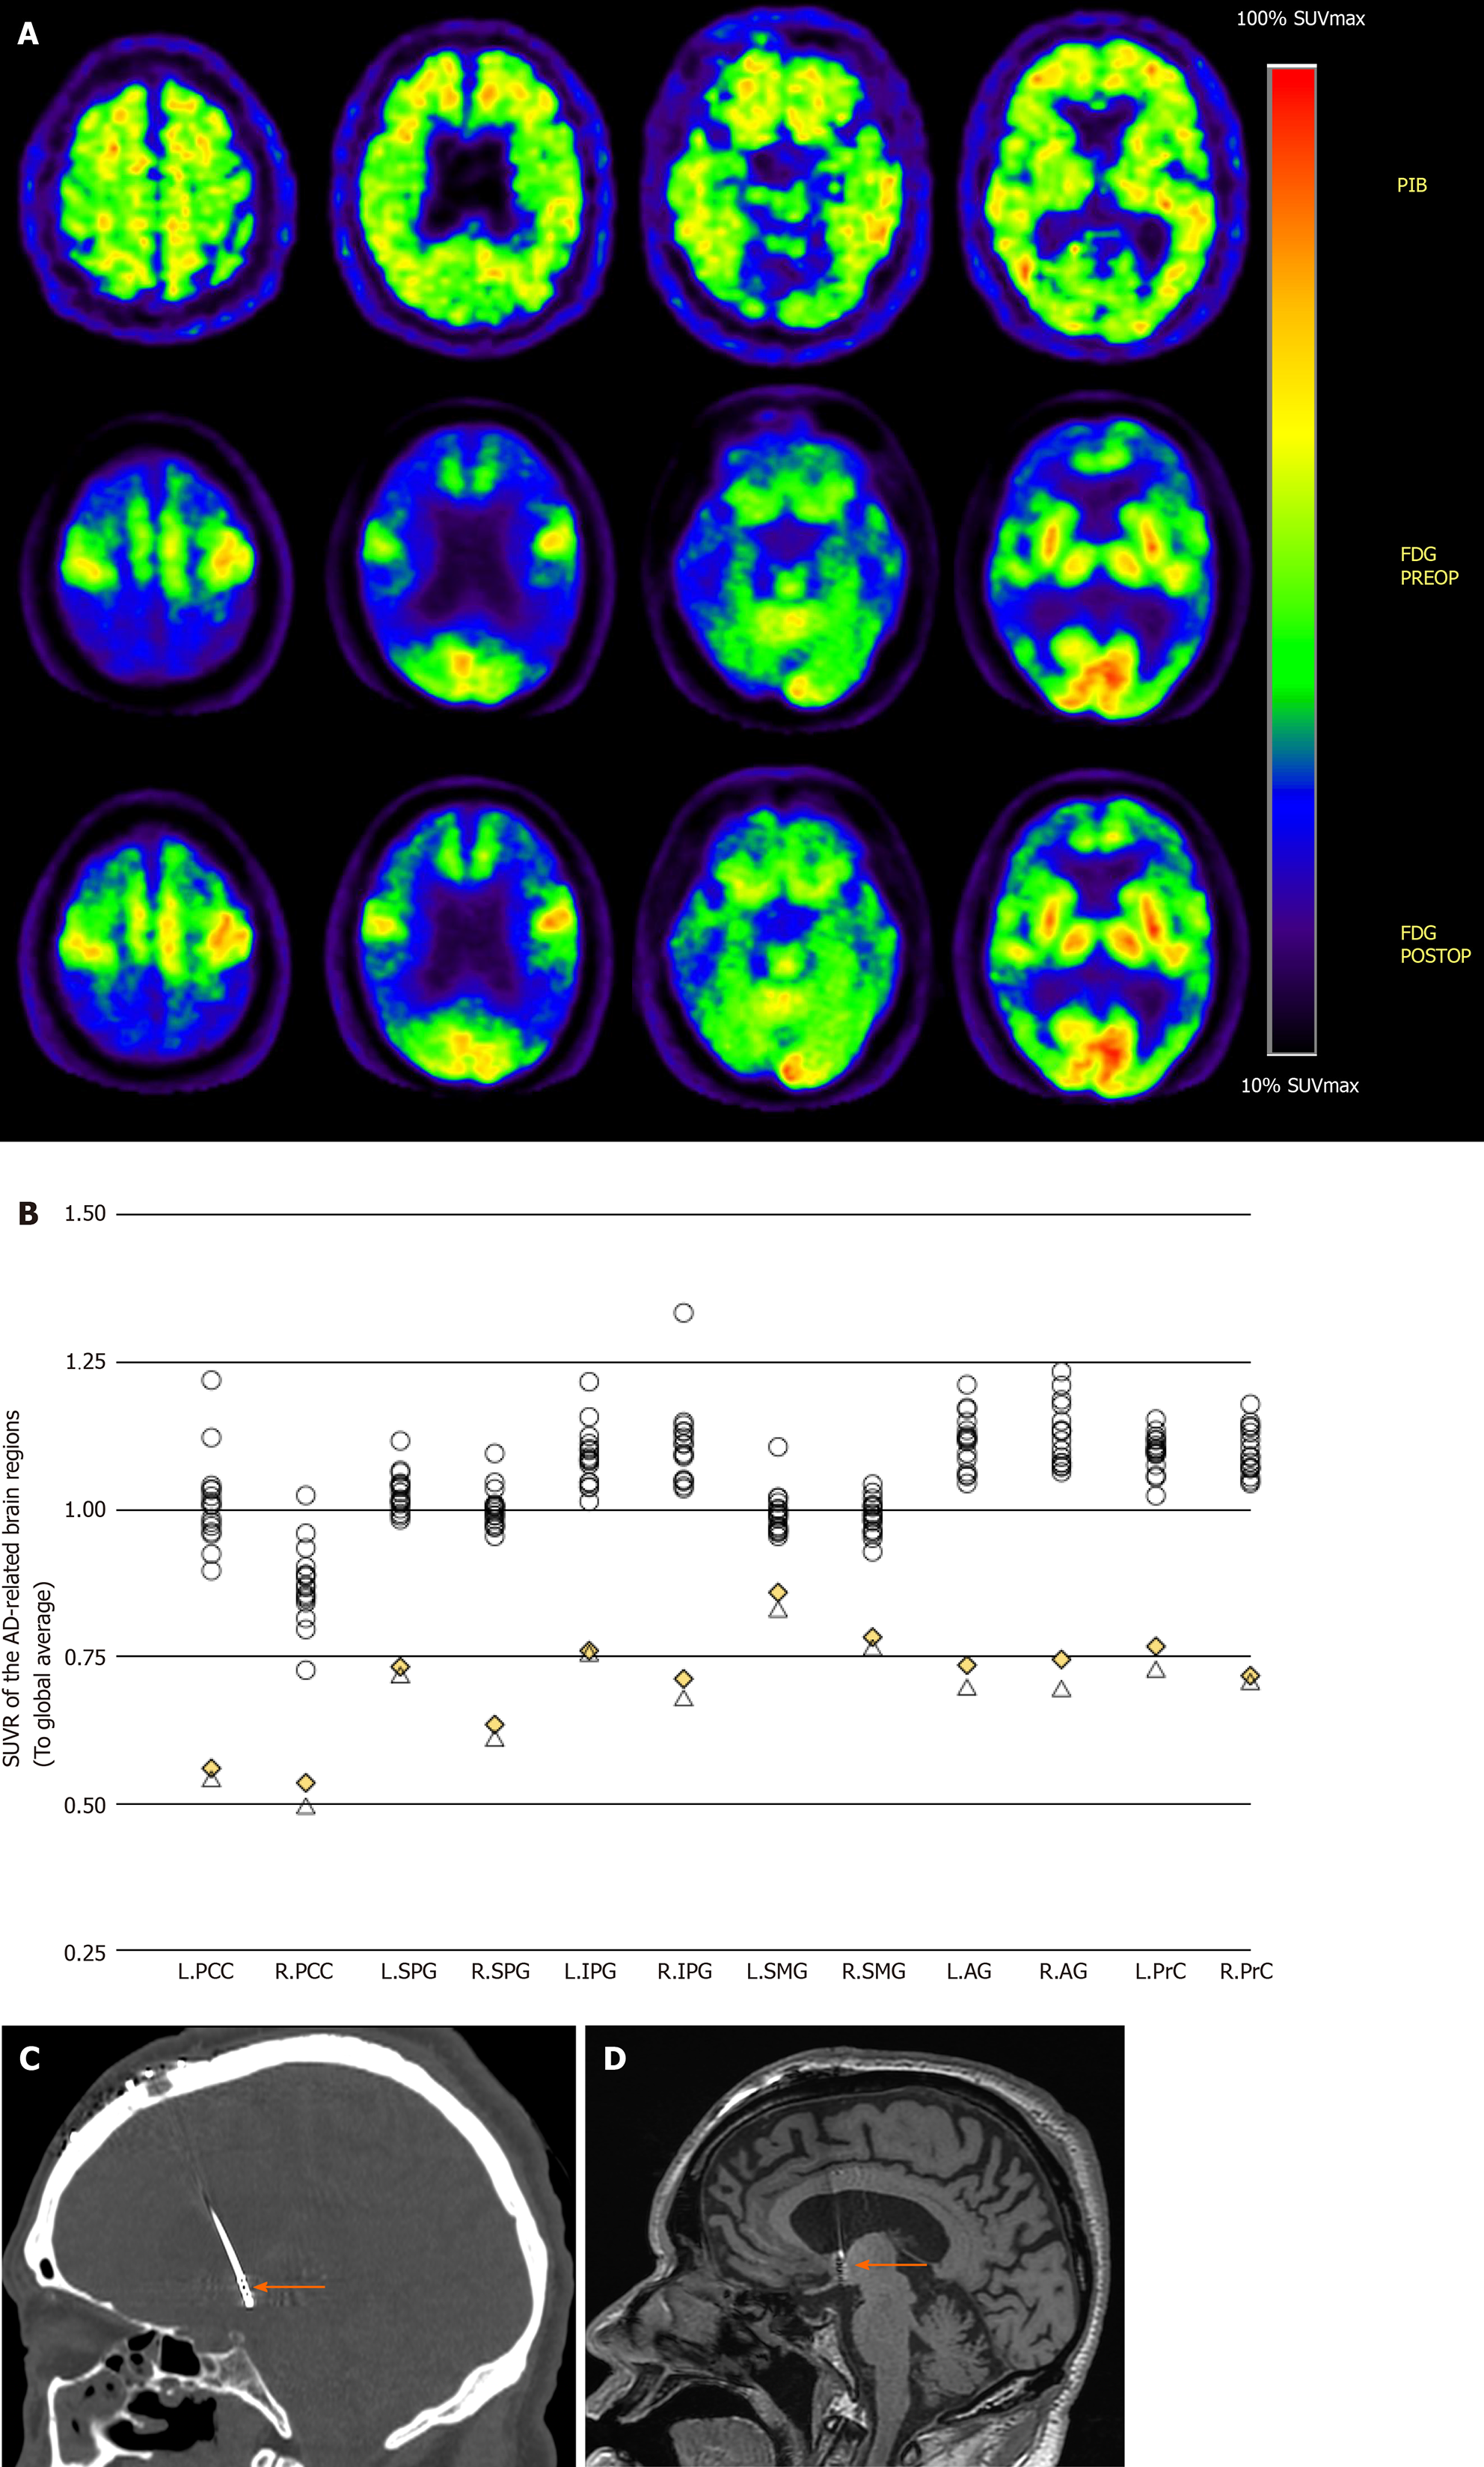
Figure 1 Positron emission tomography and regional standardized uptake value ratio.
A: Positron emission tomography (PET) images of the severe Alzheimer’s disease (AD) patient who underwent forniceal deep brain stimulation. Top row: Pre-operative [C-11] Pittsburg compound B PET. Middle row: Pre-operative [F-18] fluorodeoxyglucose PET: Hypometabolism is seen in typical AD-affected brain regions. Bottom row: Post-operative [F-18] fluorodeoxyglucose PET: Slight recovery of regional glucose metabolism can be seen after 3 mo of continuous f-deep brain stimulation (DBS); B: Regional standardized uptake value ratio (to global average) of 16 cognitively intact normal controls and the severe AD patient (both pre- and post-operative); C: Coronal computer tomography image (bone window), showing DBS electrode inserting into the post-commissural fornix (orange arrow); and D Coronal T1 magnetic resonance image showing DBS electrode inserting into the post-commissural fornix (orange arrow). L: Left; R: Right; PCC: Posterior cingulate cortex; SPG: Superior parietal gyrus; IPG: Inferior parietal gyrus; SMG: Supramarginal gyrus; AG: Angular gyrus; PrC: Precuneus.
- Citation: Lin W, Bao WQ, Ge JJ, Yang LK, Ling ZP, Xu X, Jiang JH, Zuo CT, Wang YH. Forniceal deep brain stimulation in severe Alzheimer’s disease: A case report. World J Clin Cases 2020; 8(20): 4938-4945
- URL: https://www.wjgnet.com/2307-8960/full/v8/i20/4938.htm
- DOI: https://dx.doi.org/10.12998/wjcc.v8.i20.4938


