©The Author(s) 2020.
World J Clin Cases. Jan 26, 2020; 8(2): 436-443
Published online Jan 26, 2020. doi: 10.12998/wjcc.v8.i2.436
Published online Jan 26, 2020. doi: 10.12998/wjcc.v8.i2.436
Figure 1 Plain and enhanced abdominal computed tomography scans on admission showed a lobulated soft tissue mass with a maximum cross-sectional area of 93 mm × 82 mm.
A: Cross section; B: Sagittal plane; C: Coronal plane.
Figure 2 The volume of the tumour (red part) was 193.
6 mL according to the three-dimensional reconstruction of the abdominal enhanced computed tomography images with a computer-assisted surgery system (Hisense CAS) upon admission. The boundary of the tumour was infiltrative. The tumour was surrounded by important retroperitoneal vessels such as the inferior vena cava, renal artery, renal vein, and abdominal aorta, as seen by rotating the three-dimensional images at any angle. A: Positive image; B: Right-side image; C: Posterior and anterior images.
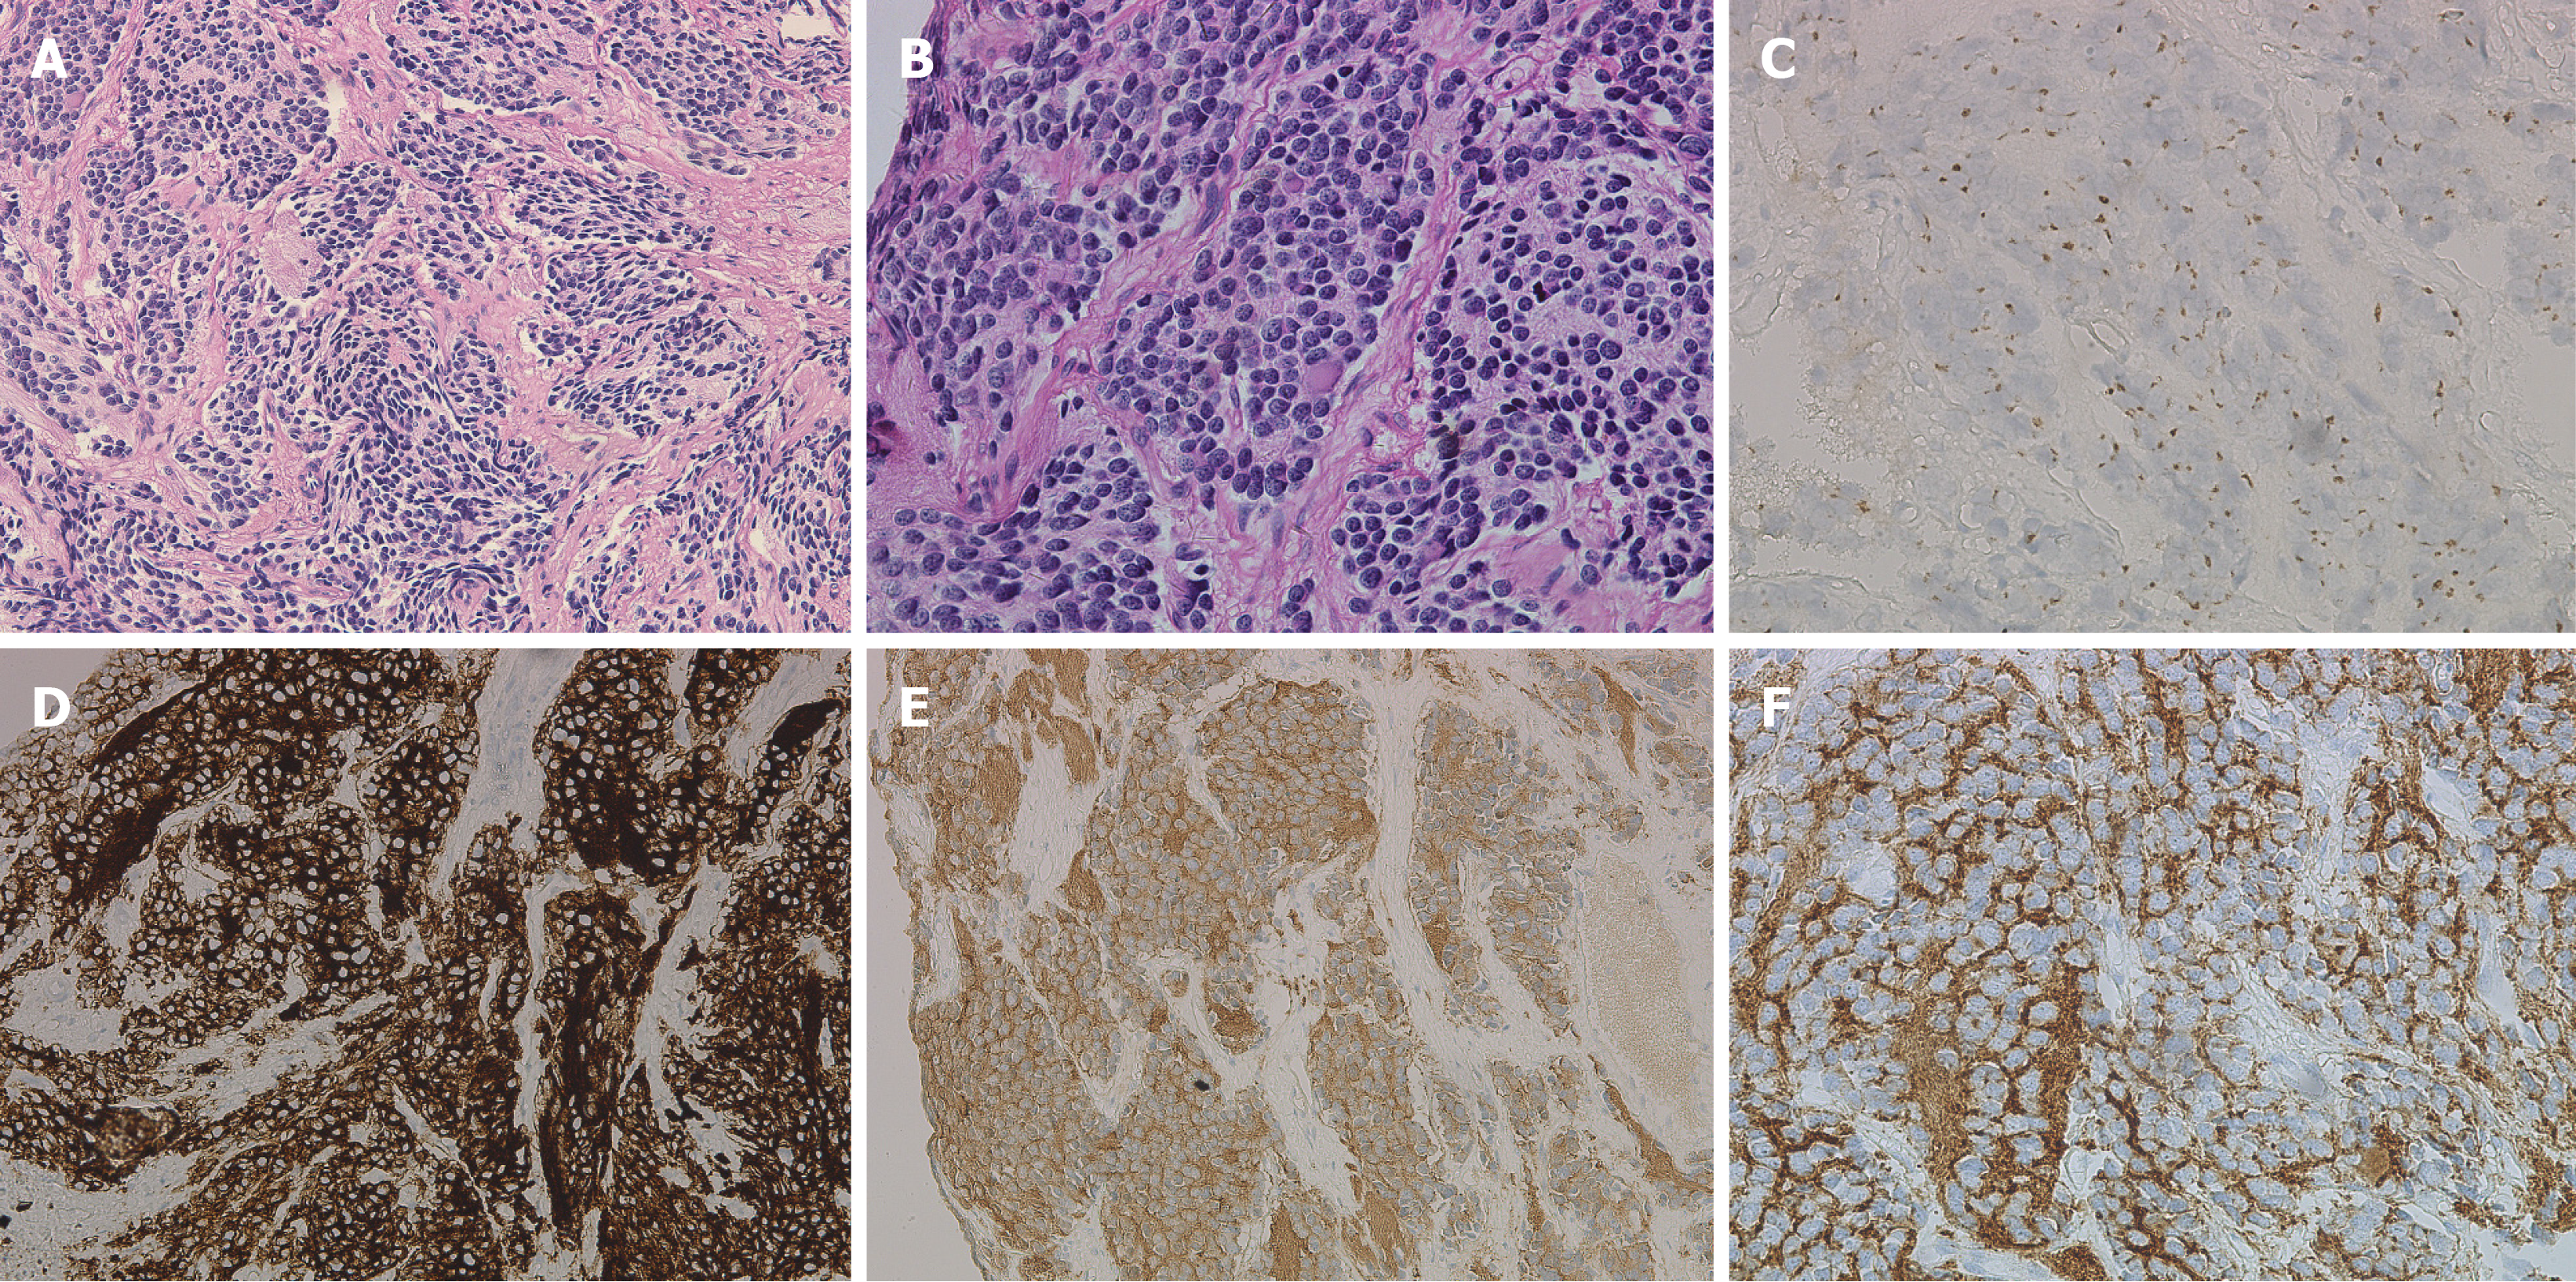
Figure 3 Histological and pathological images of the tumour biopsy specimens.
A: HE staining, ×200; B: HE staining, ×400; C: CgA (suspiciously positive); D: CD56 (positive); E: NSE (positive); F: Syn (positive).
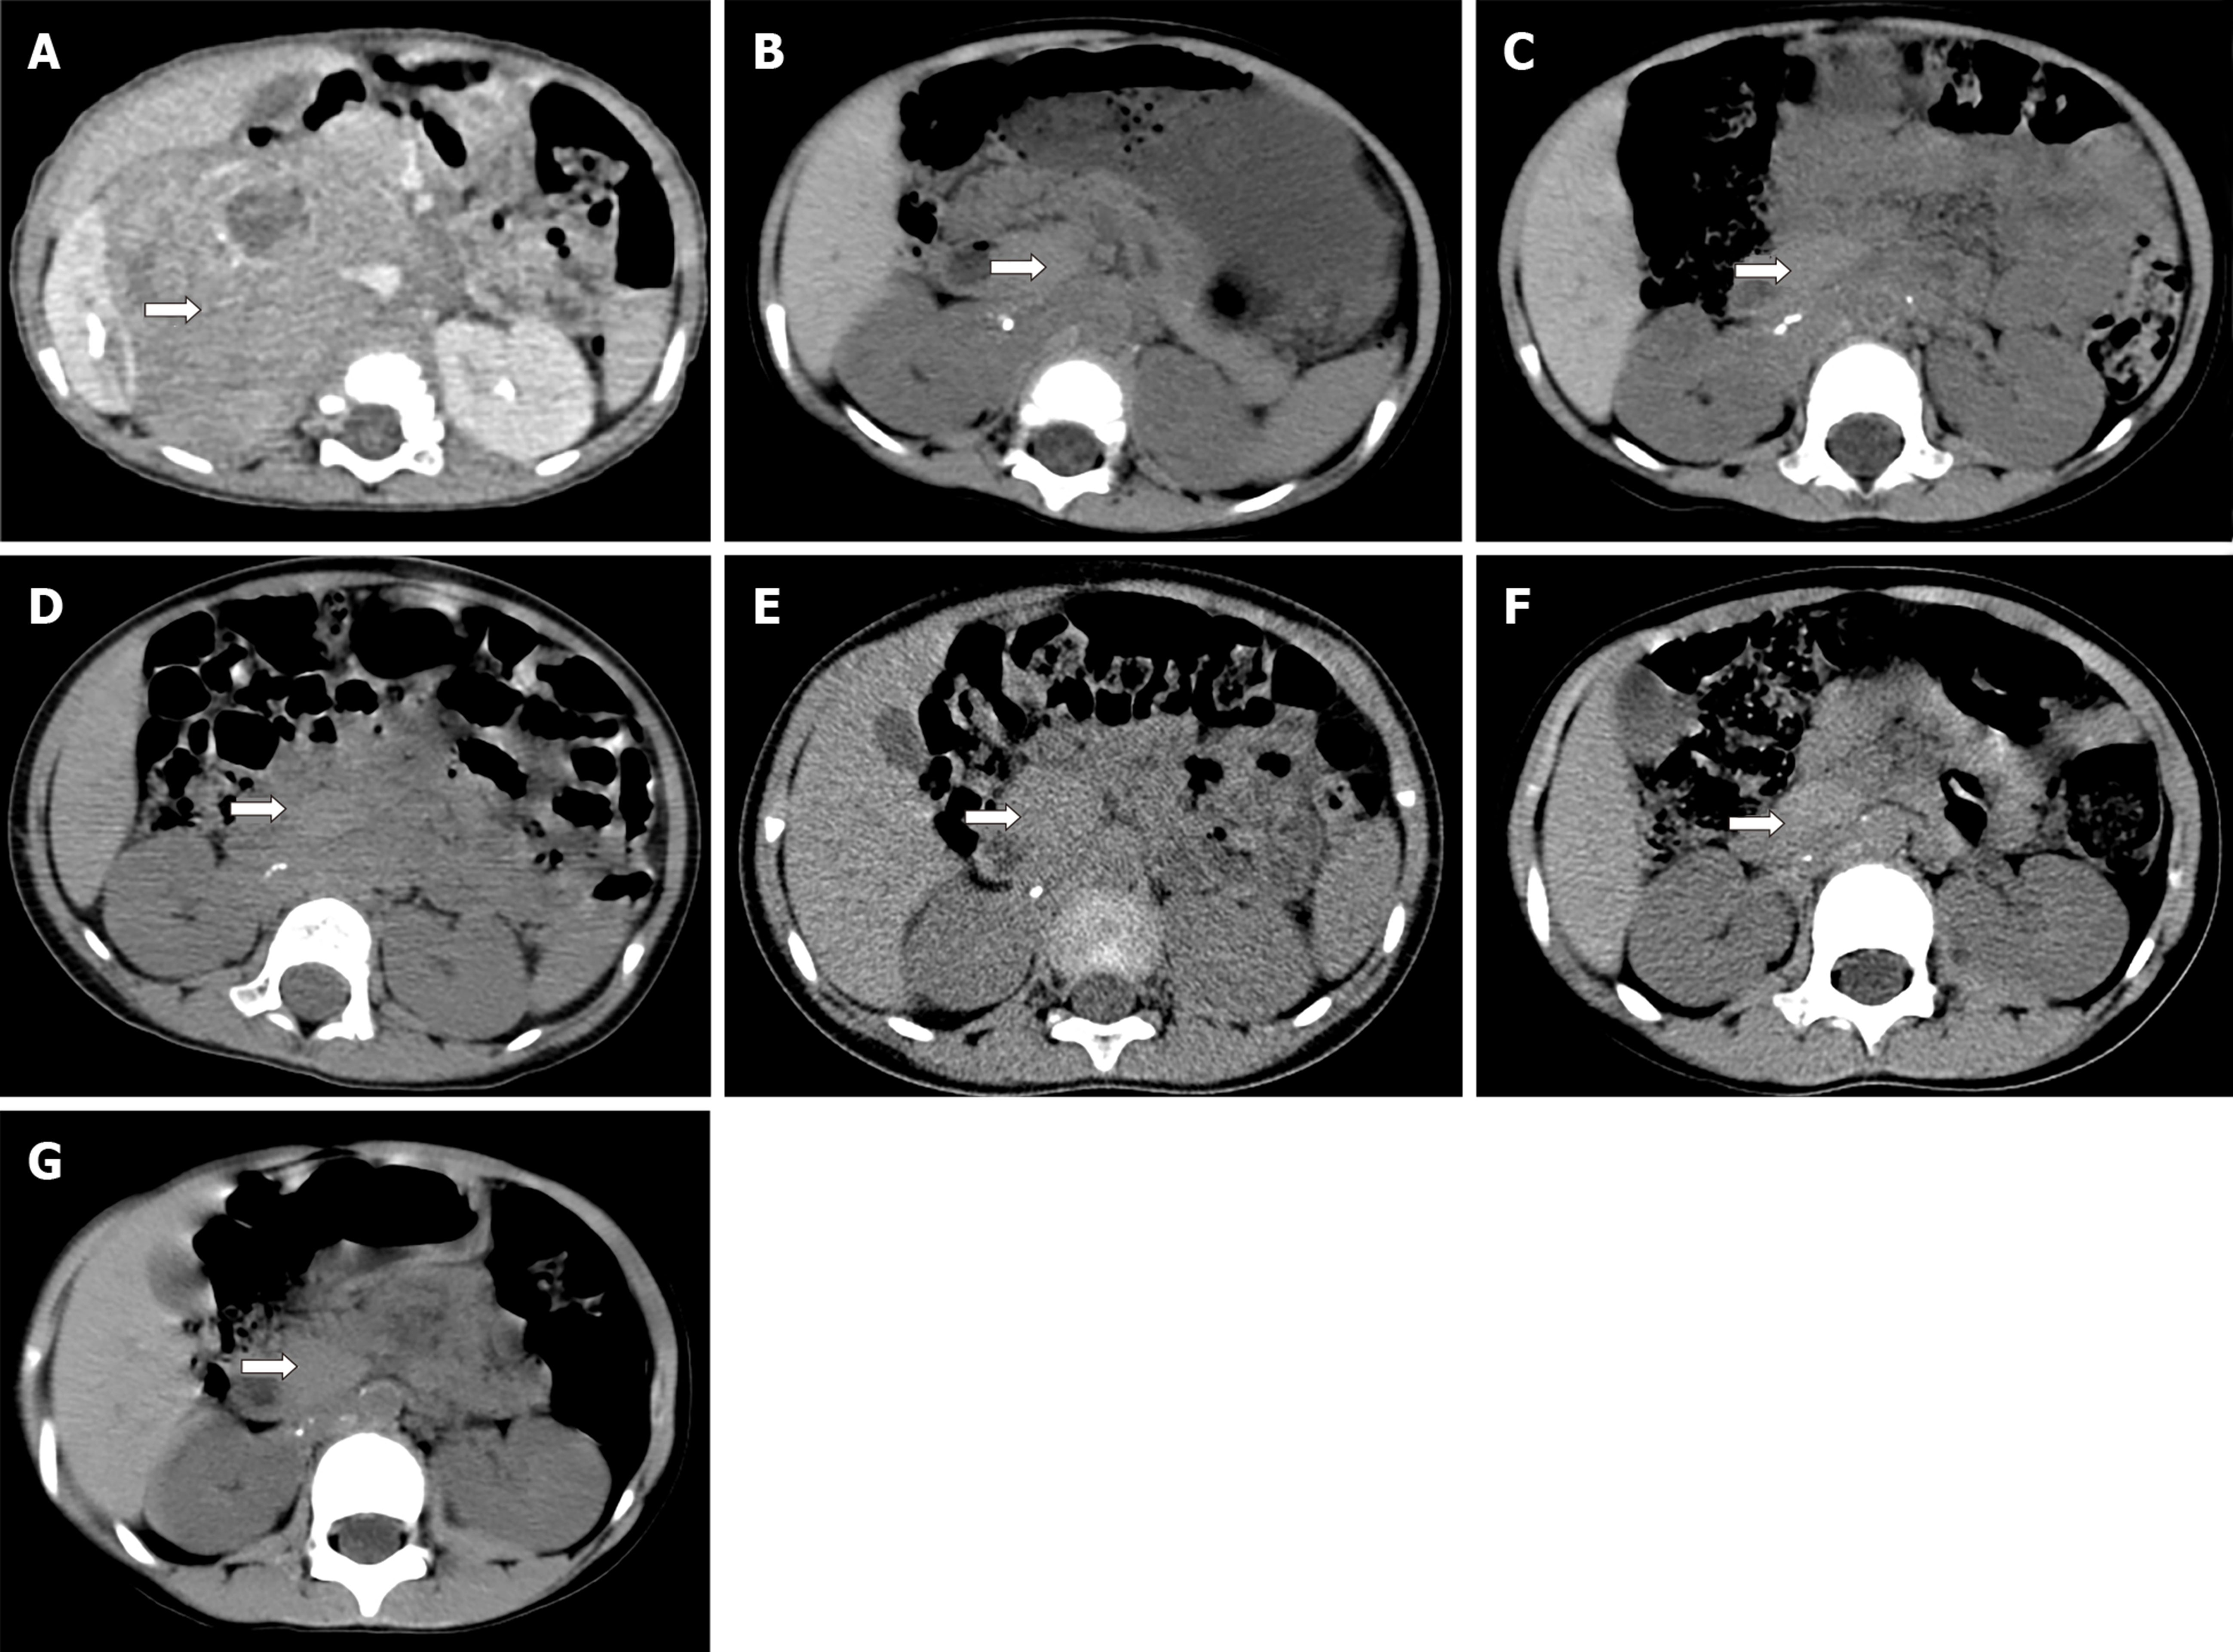
Figure 4 Abdominal computed tomography examination and follow-up images of the patient from June 2015 to July 2019; the arrow indicates the tumour.
During the follow-up period, the tumour gradually shrank, showing typical spontaneous regression. A: June 2015; B: October 2015; C: December 2015; D: August 2016; E: August 2017; F: October 2018; G: July 2019.
- Citation: Liu J, Wu XW, Hao XW, Duan YH, Wu LL, Zhao J, Zhou XJ, Zhu CZ, Wei B, Dong Q. Spontaneous regression of stage III neuroblastoma: A case report. World J Clin Cases 2020; 8(2): 436-443
- URL: https://www.wjgnet.com/2307-8960/full/v8/i2/436.htm
- DOI: https://dx.doi.org/10.12998/wjcc.v8.i2.436


