©The Author(s) 2020.
World J Clin Cases. Sep 6, 2020; 8(17): 3835-3840
Published online Sep 6, 2020. doi: 10.12998/wjcc.v8.i17.3835
Published online Sep 6, 2020. doi: 10.12998/wjcc.v8.i17.3835
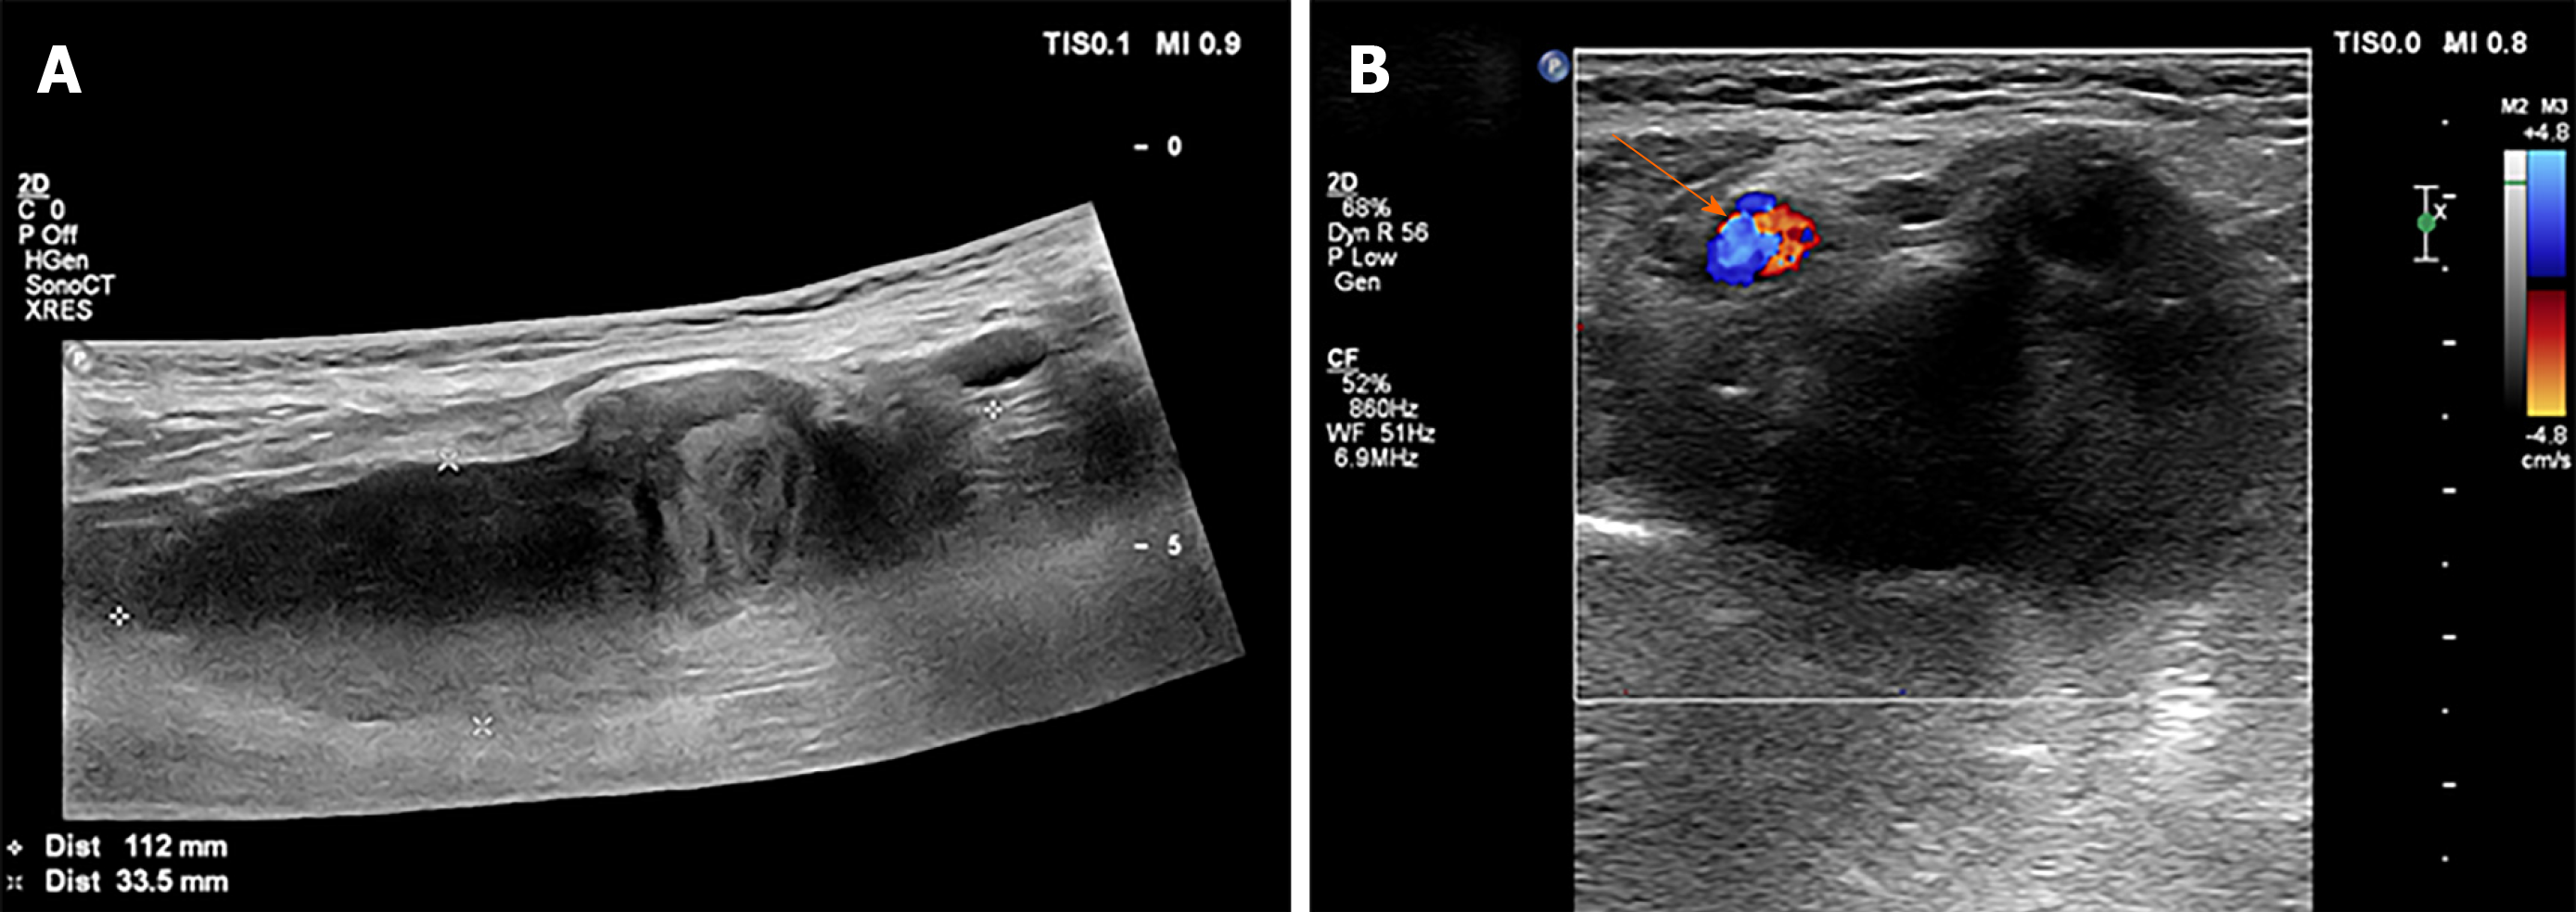
Figure 1 Findings of gray-scale ultrasound.
A and B: The gray-scale ultrasound revealed a mainly hypoechoic mass of approximately 11.2 cm × 3.5 cm × 3.4 cm beside the left brachial artery (arrow), with a hyperechoic area of approximately 3.3 cm × 2.3 cm and an anechoic area of about 0.7 cm × 0.3 cm.
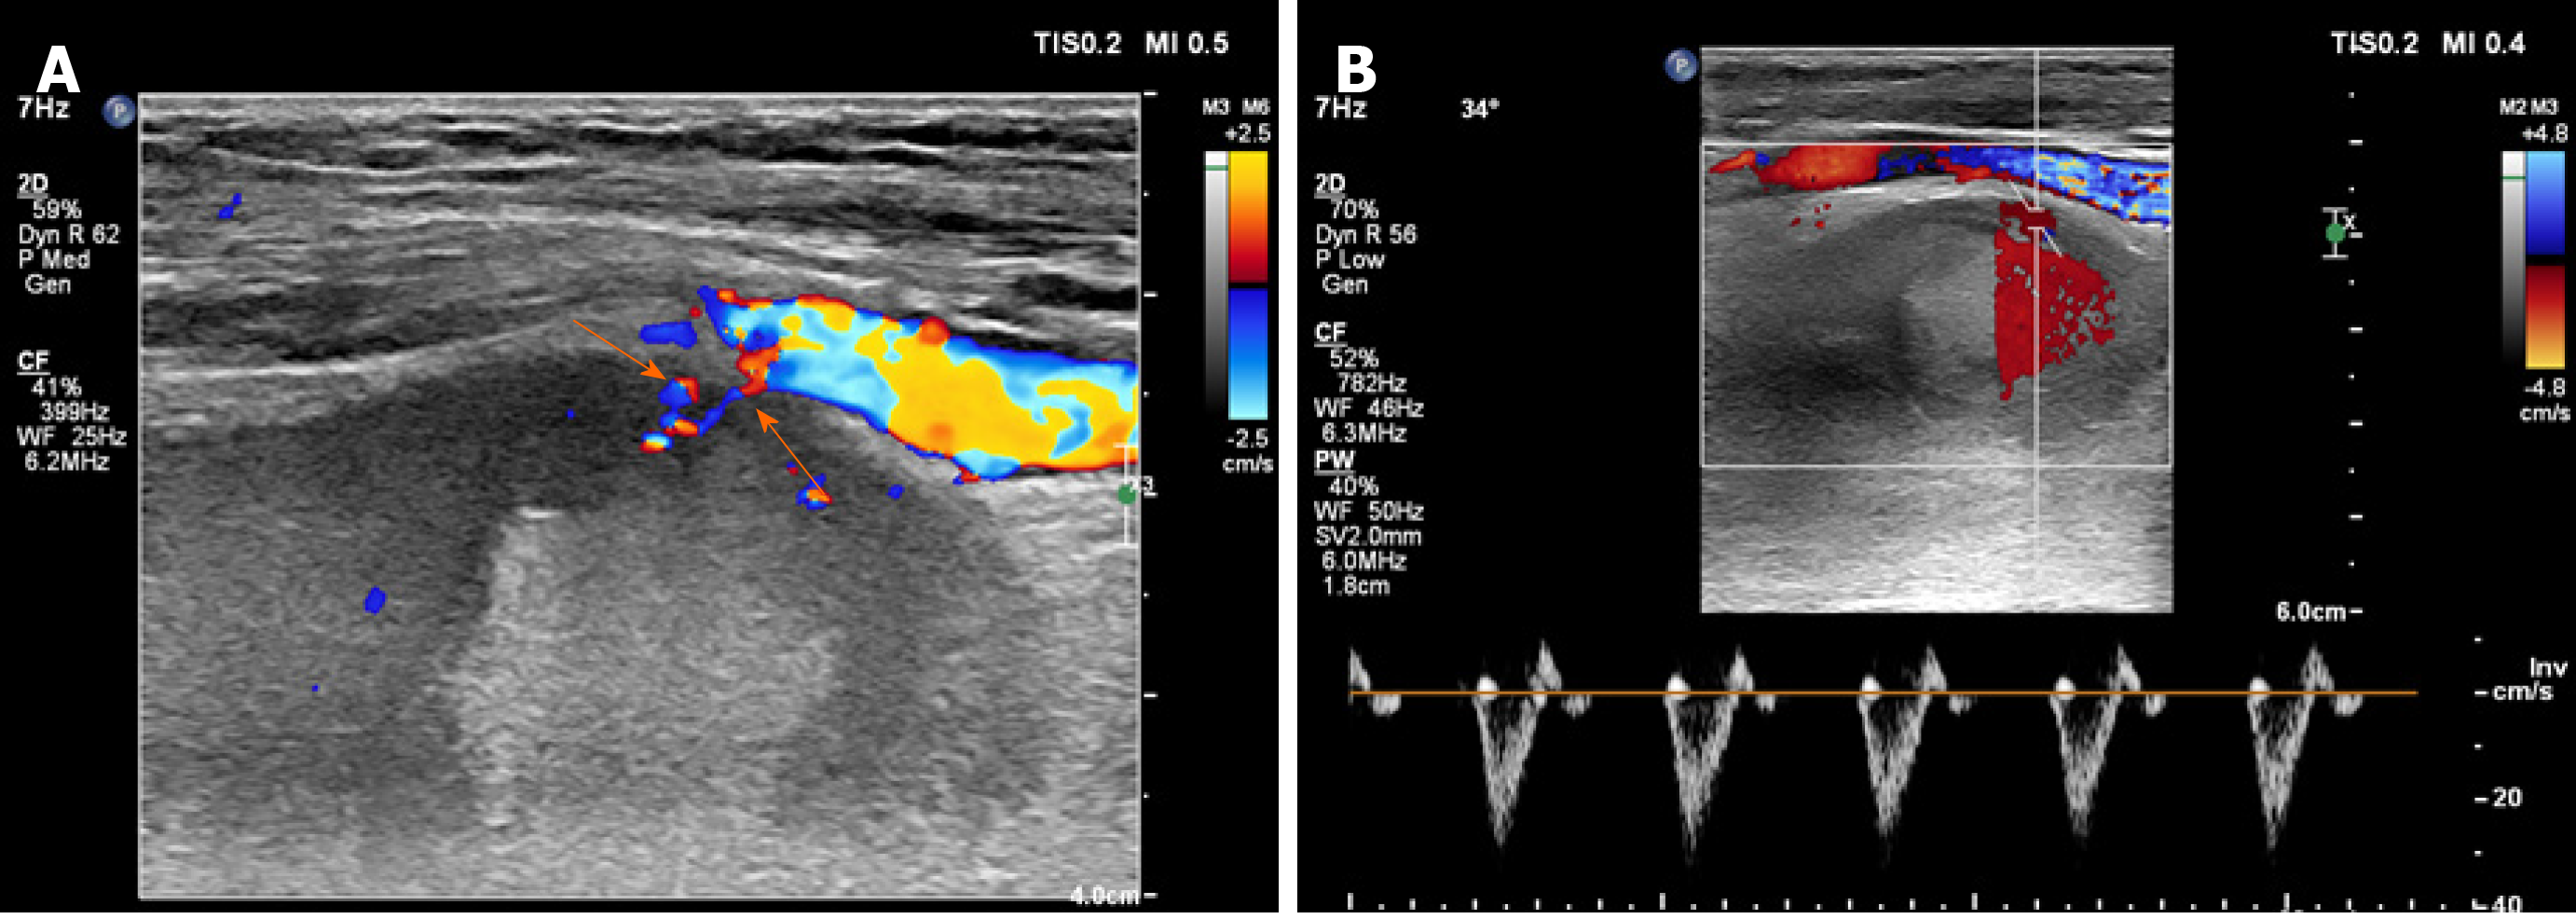
Figure 2 Findings of color Doppler ultrasound.
A: The color Doppler ultrasound revealed blood flow signals of arteries branching into the hematoma (arrow); B: A narrow band of blood flow was detected in the hypoechoic area with a three-phase wave arterial flow spectrum.
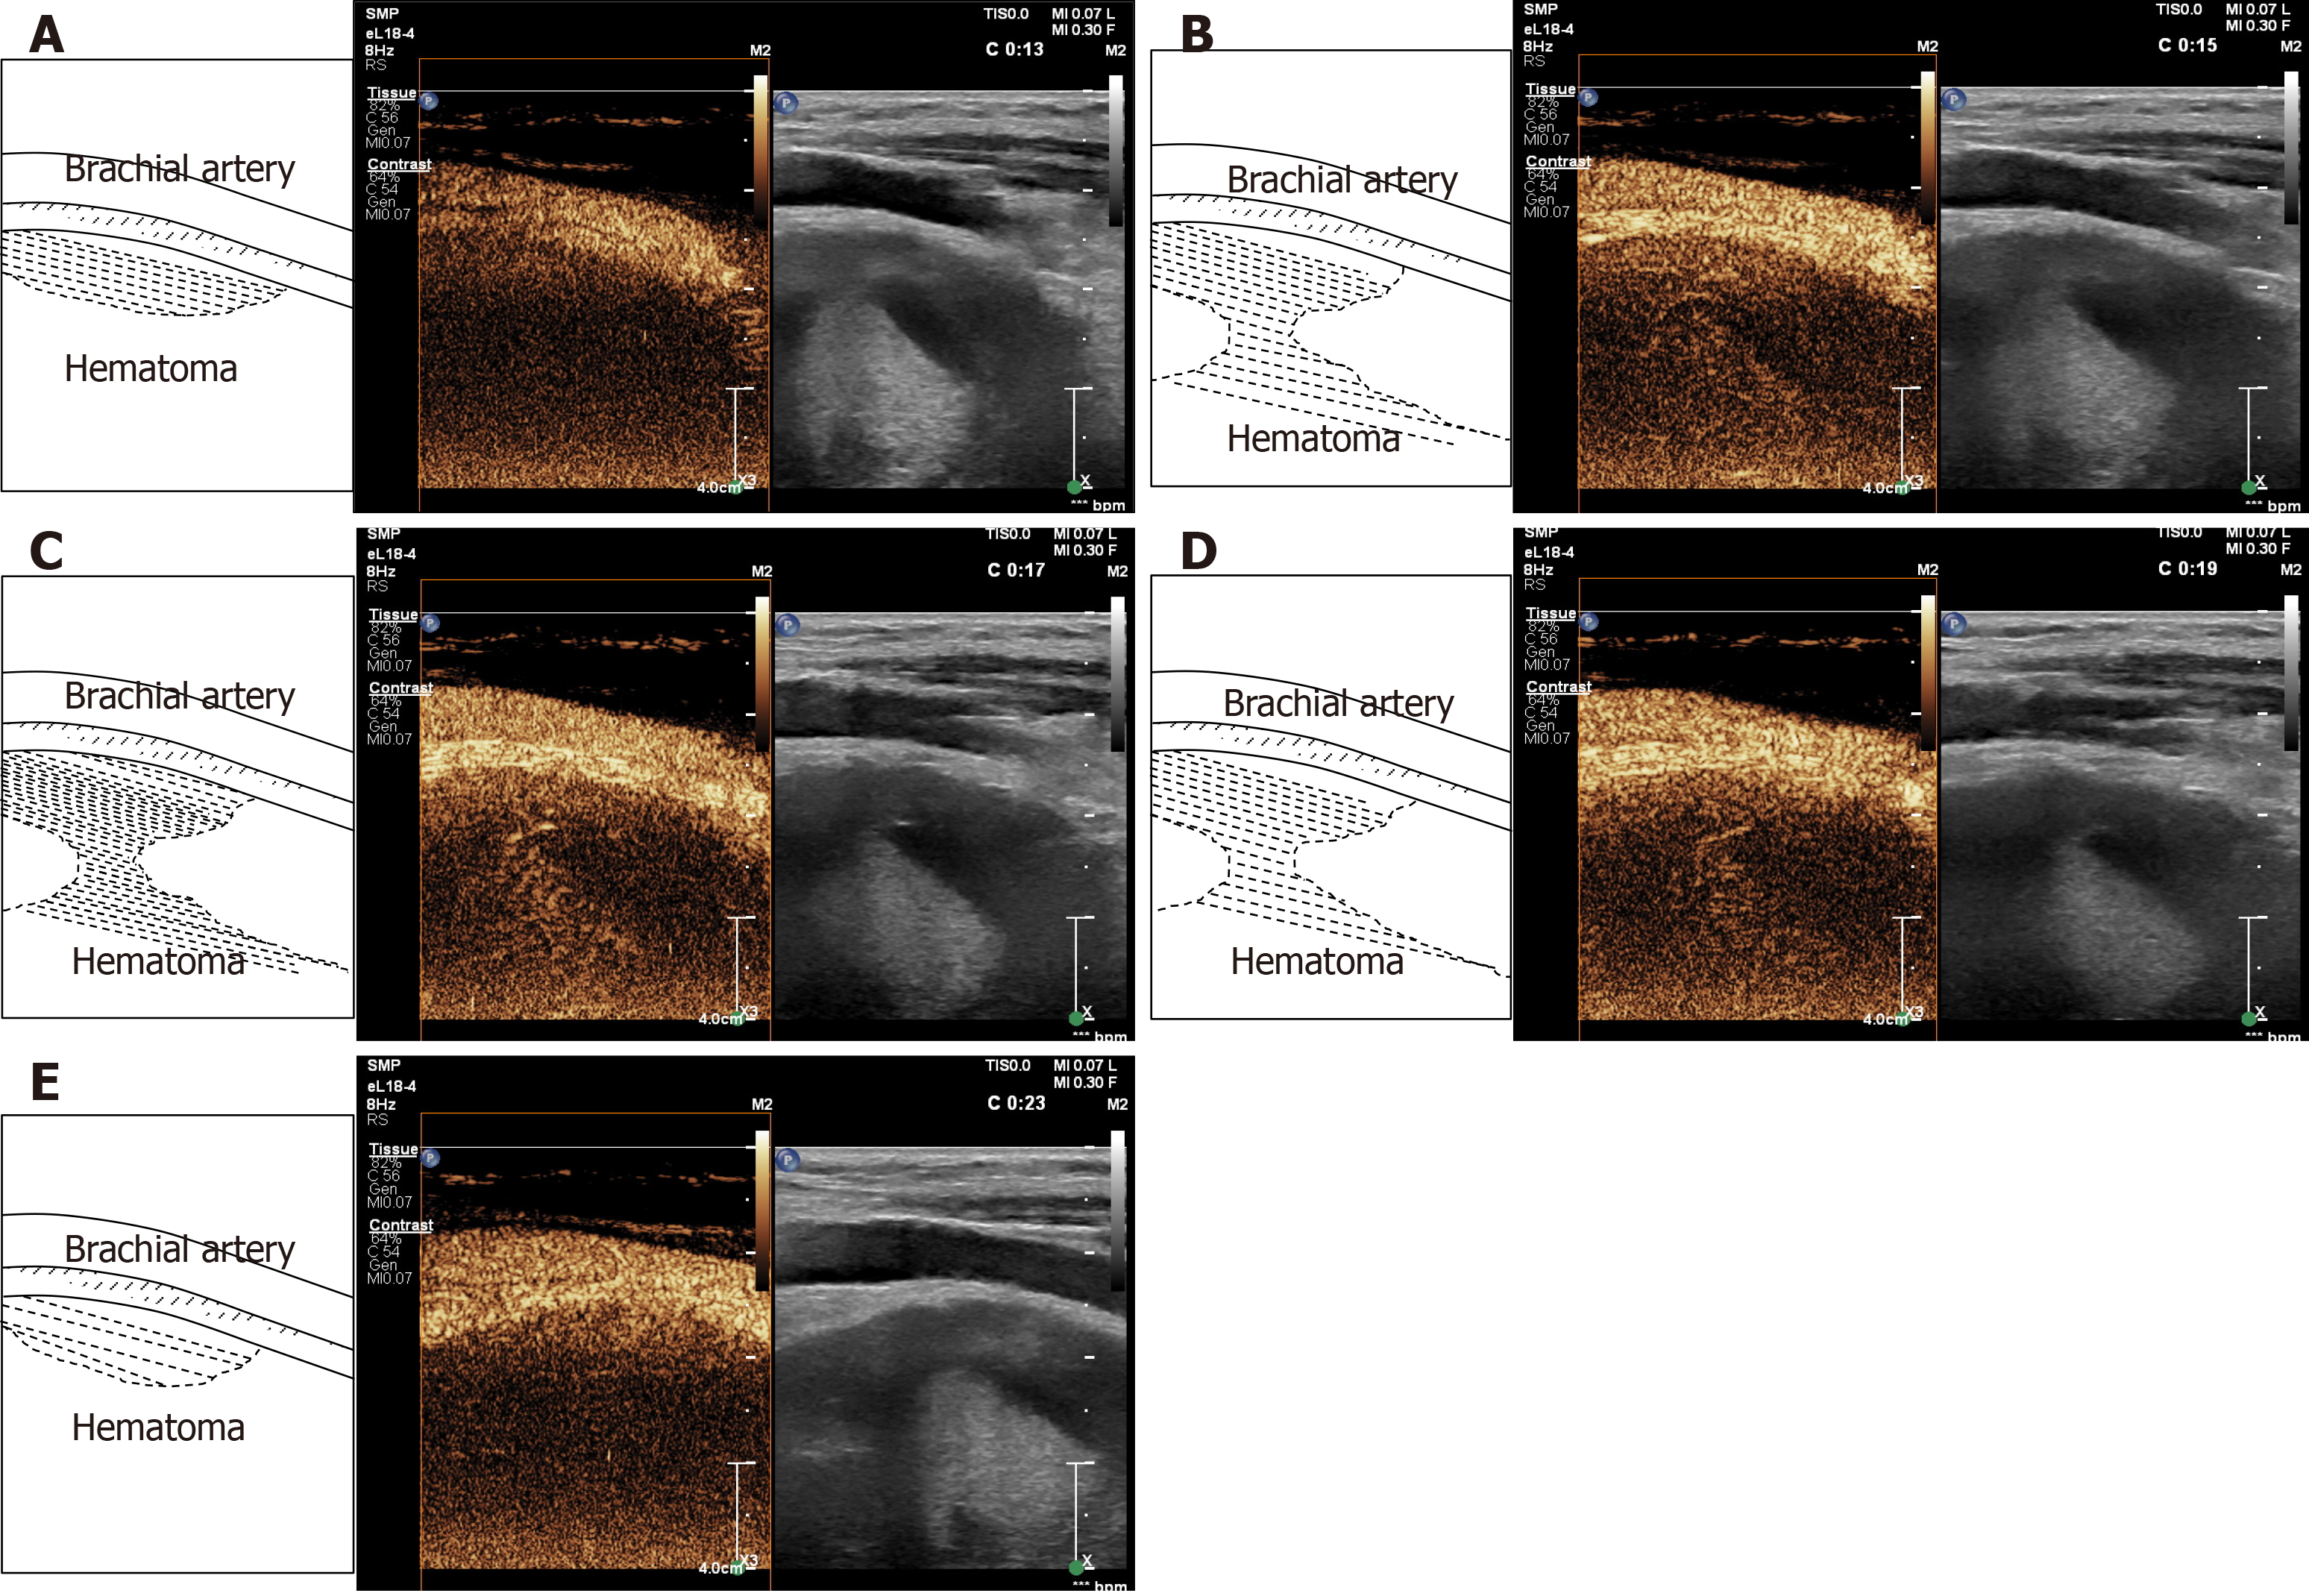
Figure 3 Findings of contrast-enhanced ultrasound.
A: Microbubbles were first detected at 13 s emerging from the brachial artery into the hematoma; B-D: Microbubbles diffused into the hematoma with the local surge of red blood cells; E: Microbubbles disappeared after approximately 23 s.
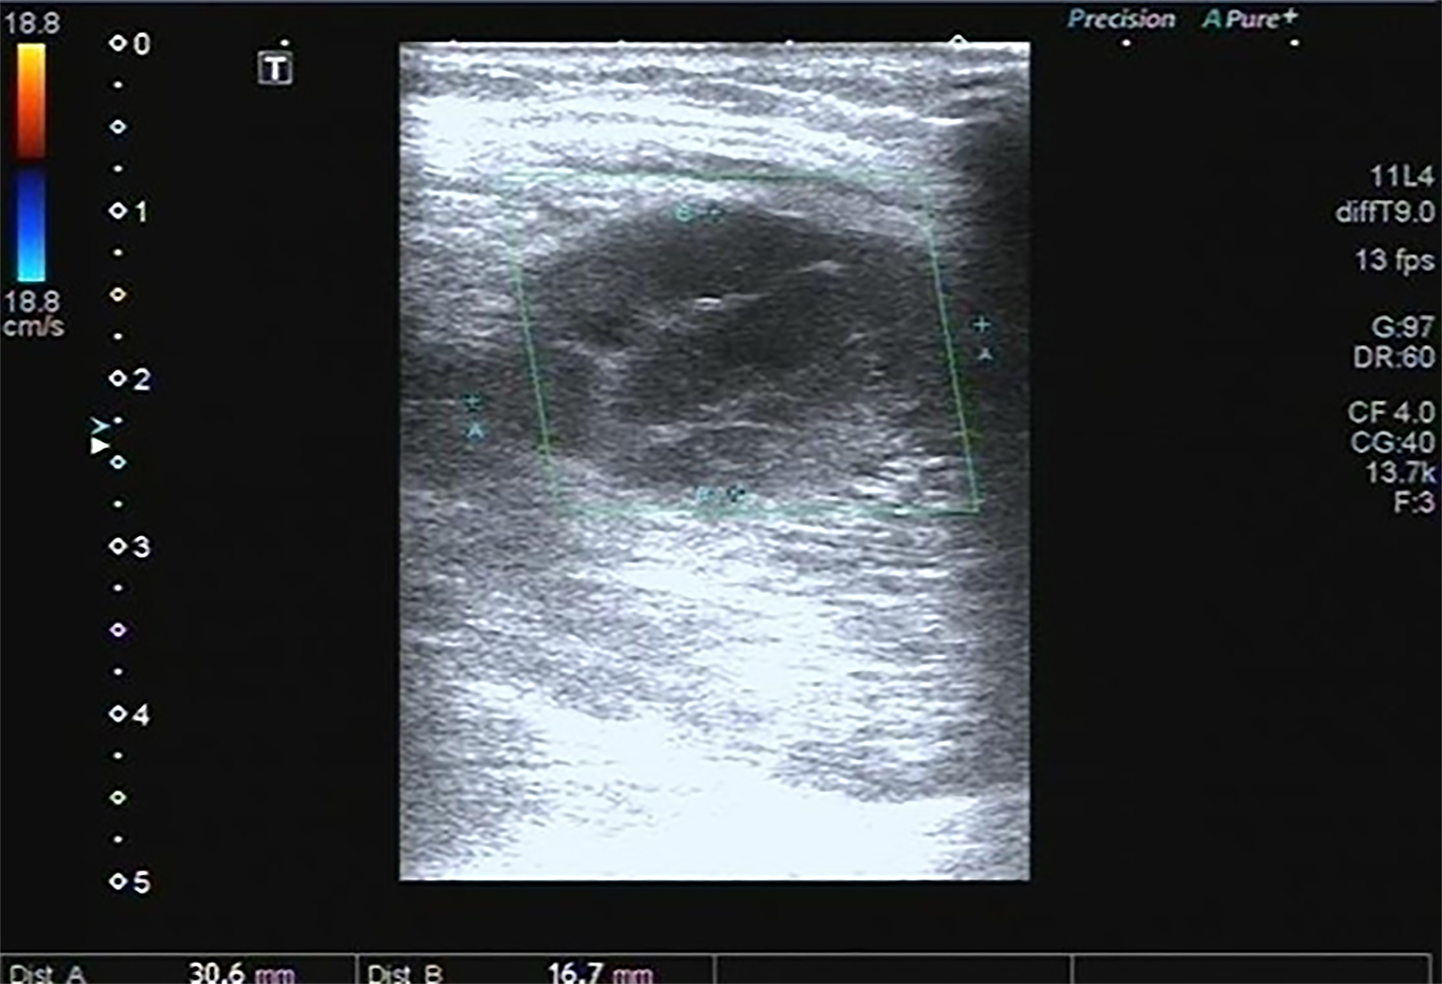
Figure 4 Findings of ultrasound 20 d later.
After pressure bandaging treatment, the hematoma became smaller (3.1 cm × 1.7 cm) and organized.
- Citation: Ma JJ, Zhang B. Diagnosis of an actively bleeding brachial artery hematoma by contrast-enhanced ultrasound: A case report. World J Clin Cases 2020; 8(17): 3835-3840
- URL: https://www.wjgnet.com/2307-8960/full/v8/i17/3835.htm
- DOI: https://dx.doi.org/10.12998/wjcc.v8.i17.3835


