Copyright
©The Author(s) 2020.
World J Clin Cases. Jun 26, 2020; 8(12): 2473-2483
Published online Jun 26, 2020. doi: 10.12998/wjcc.v8.i12.2473
Published online Jun 26, 2020. doi: 10.12998/wjcc.v8.i12.2473
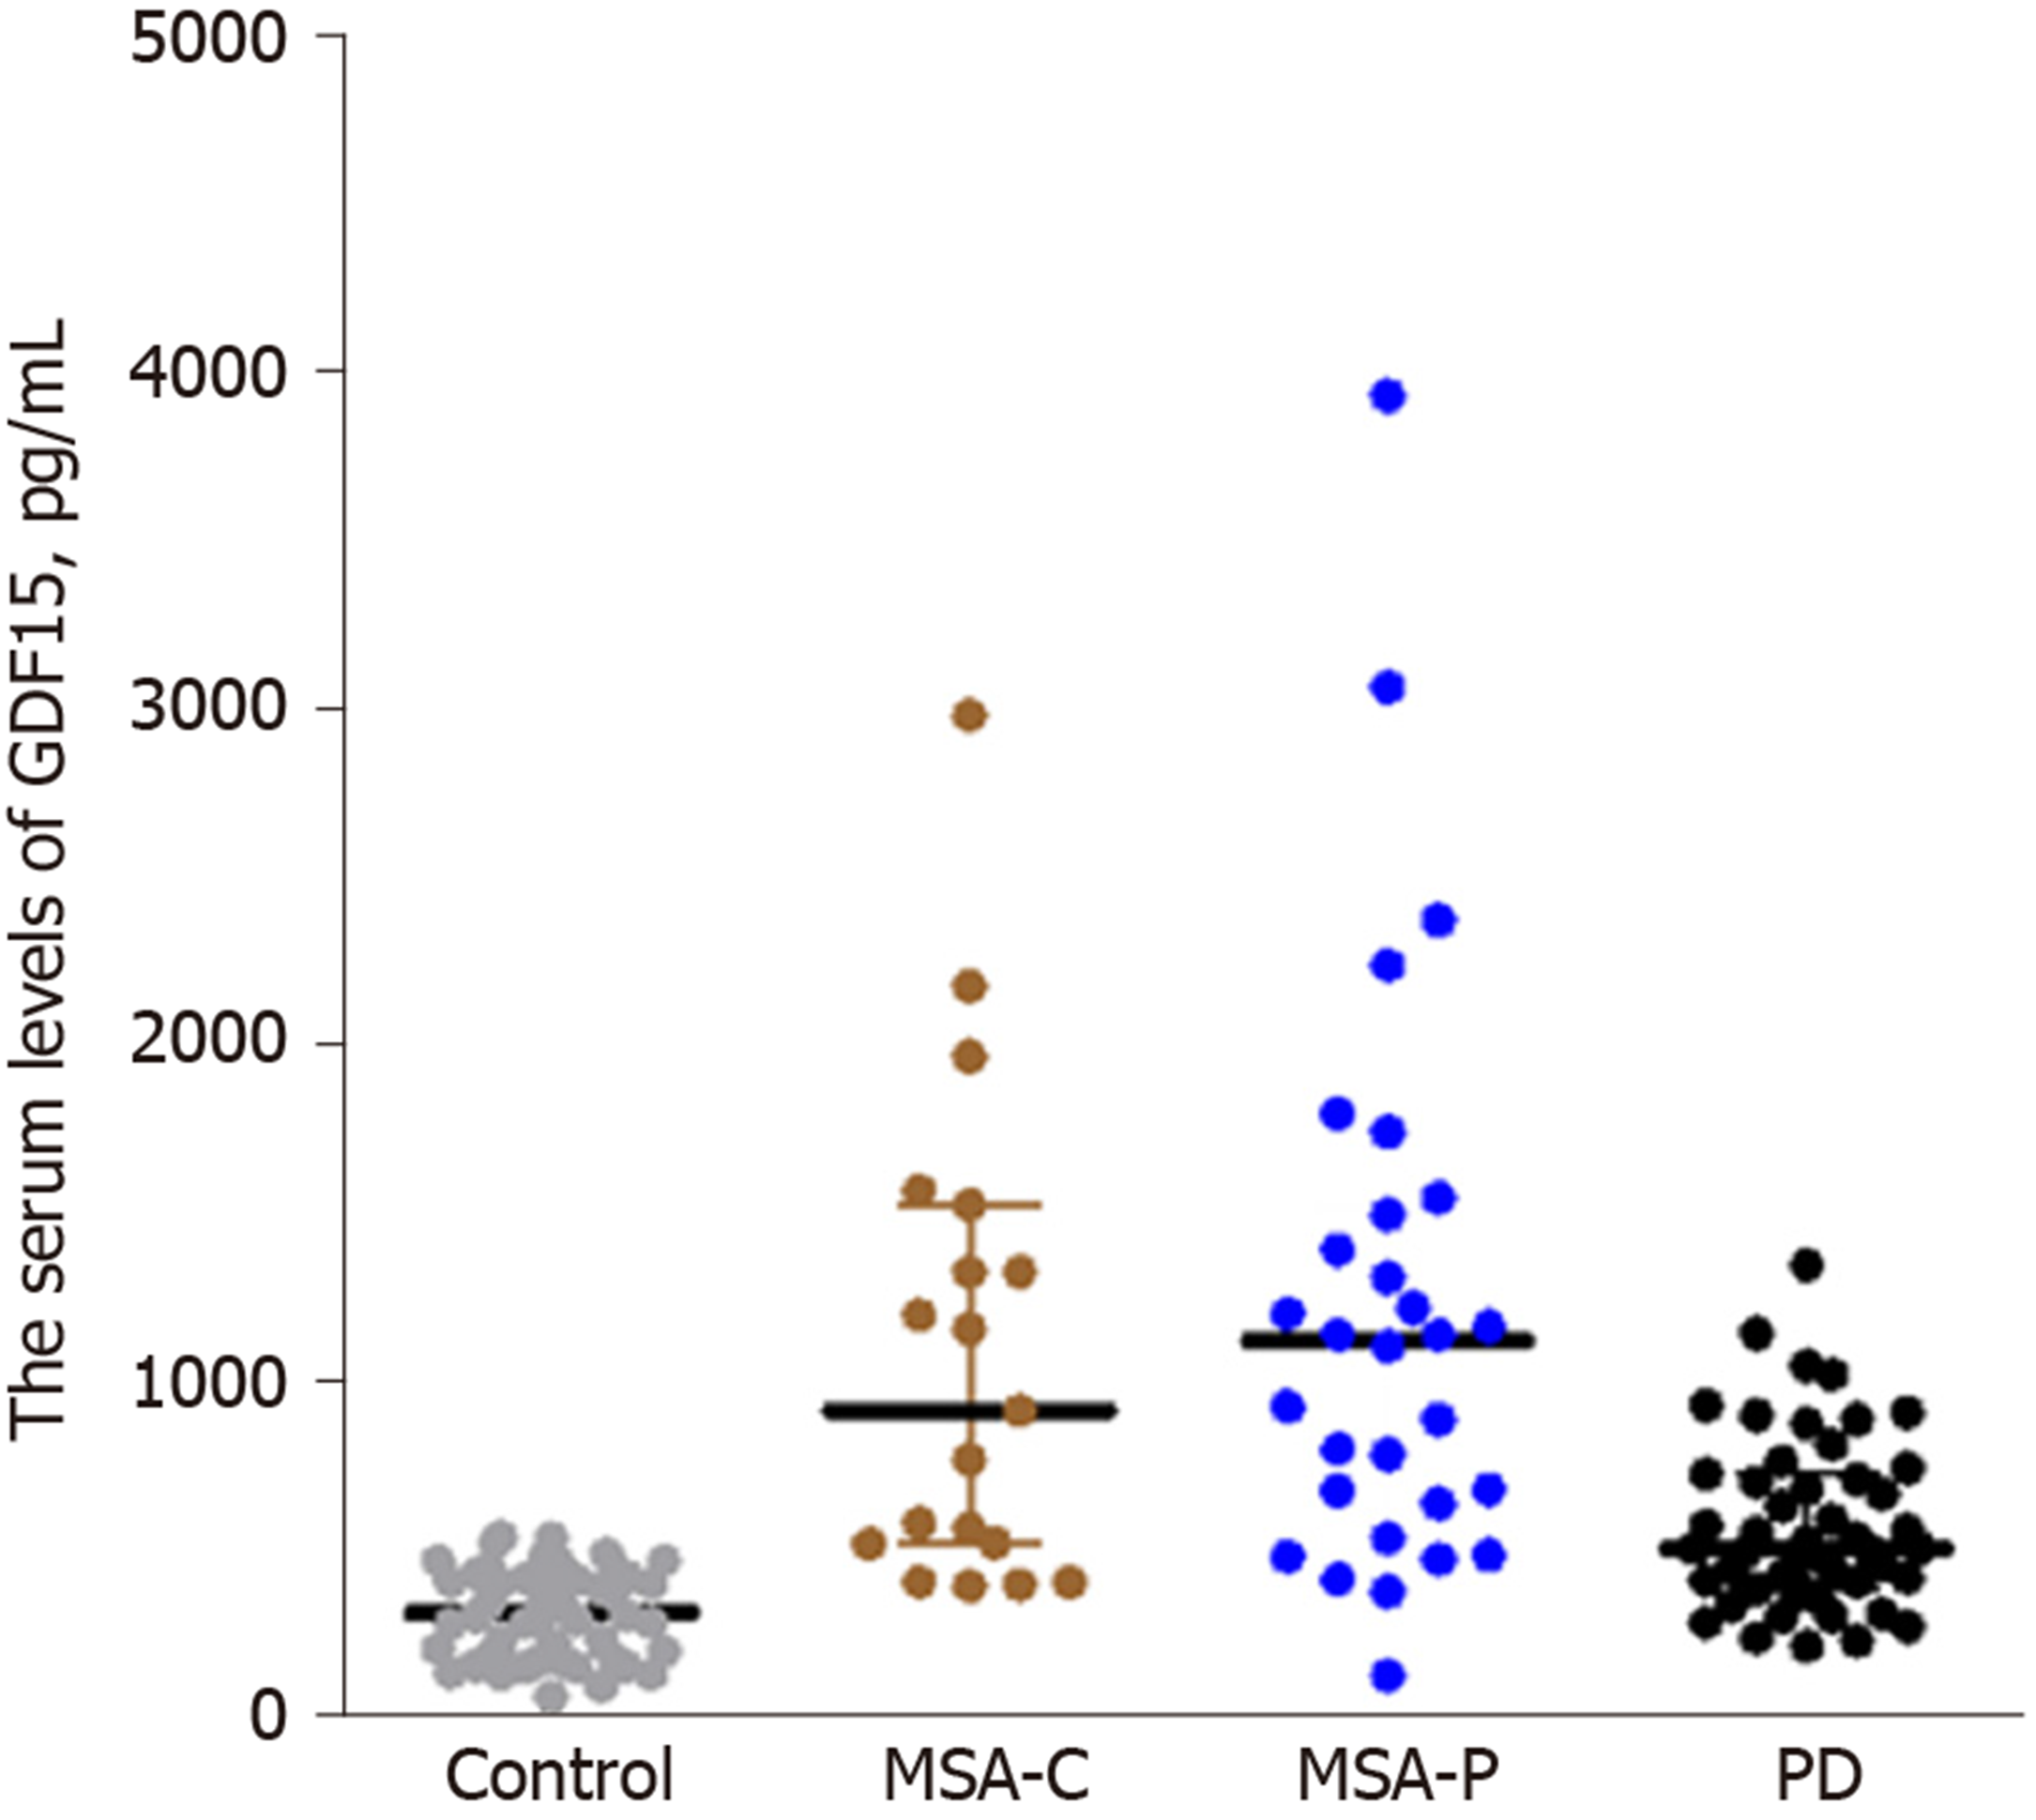
Figure 1 The serum levels of growth differentiation factor 15 in multiple system atrophy-parkinsonian type patients, multiple system atrophy-cerebellar type patients and Parkinson disease patients.
Serum growth differentiation factor 15 levels in multiple system atrophy-parkinsonian type patients and multiple system atrophy-cerebellar type patients were both significantly higher than those in Parkinson disease patients (P = 0.000, 0.000, respectively). MSA-P: Multiple system atrophy-parkinsonian type; MSA-C: Multiple system atrophy-cerebellar type; MSA: Multiple system atrophy; PD: Parkinson disease; GDF15: Growth differentiation factor 15.
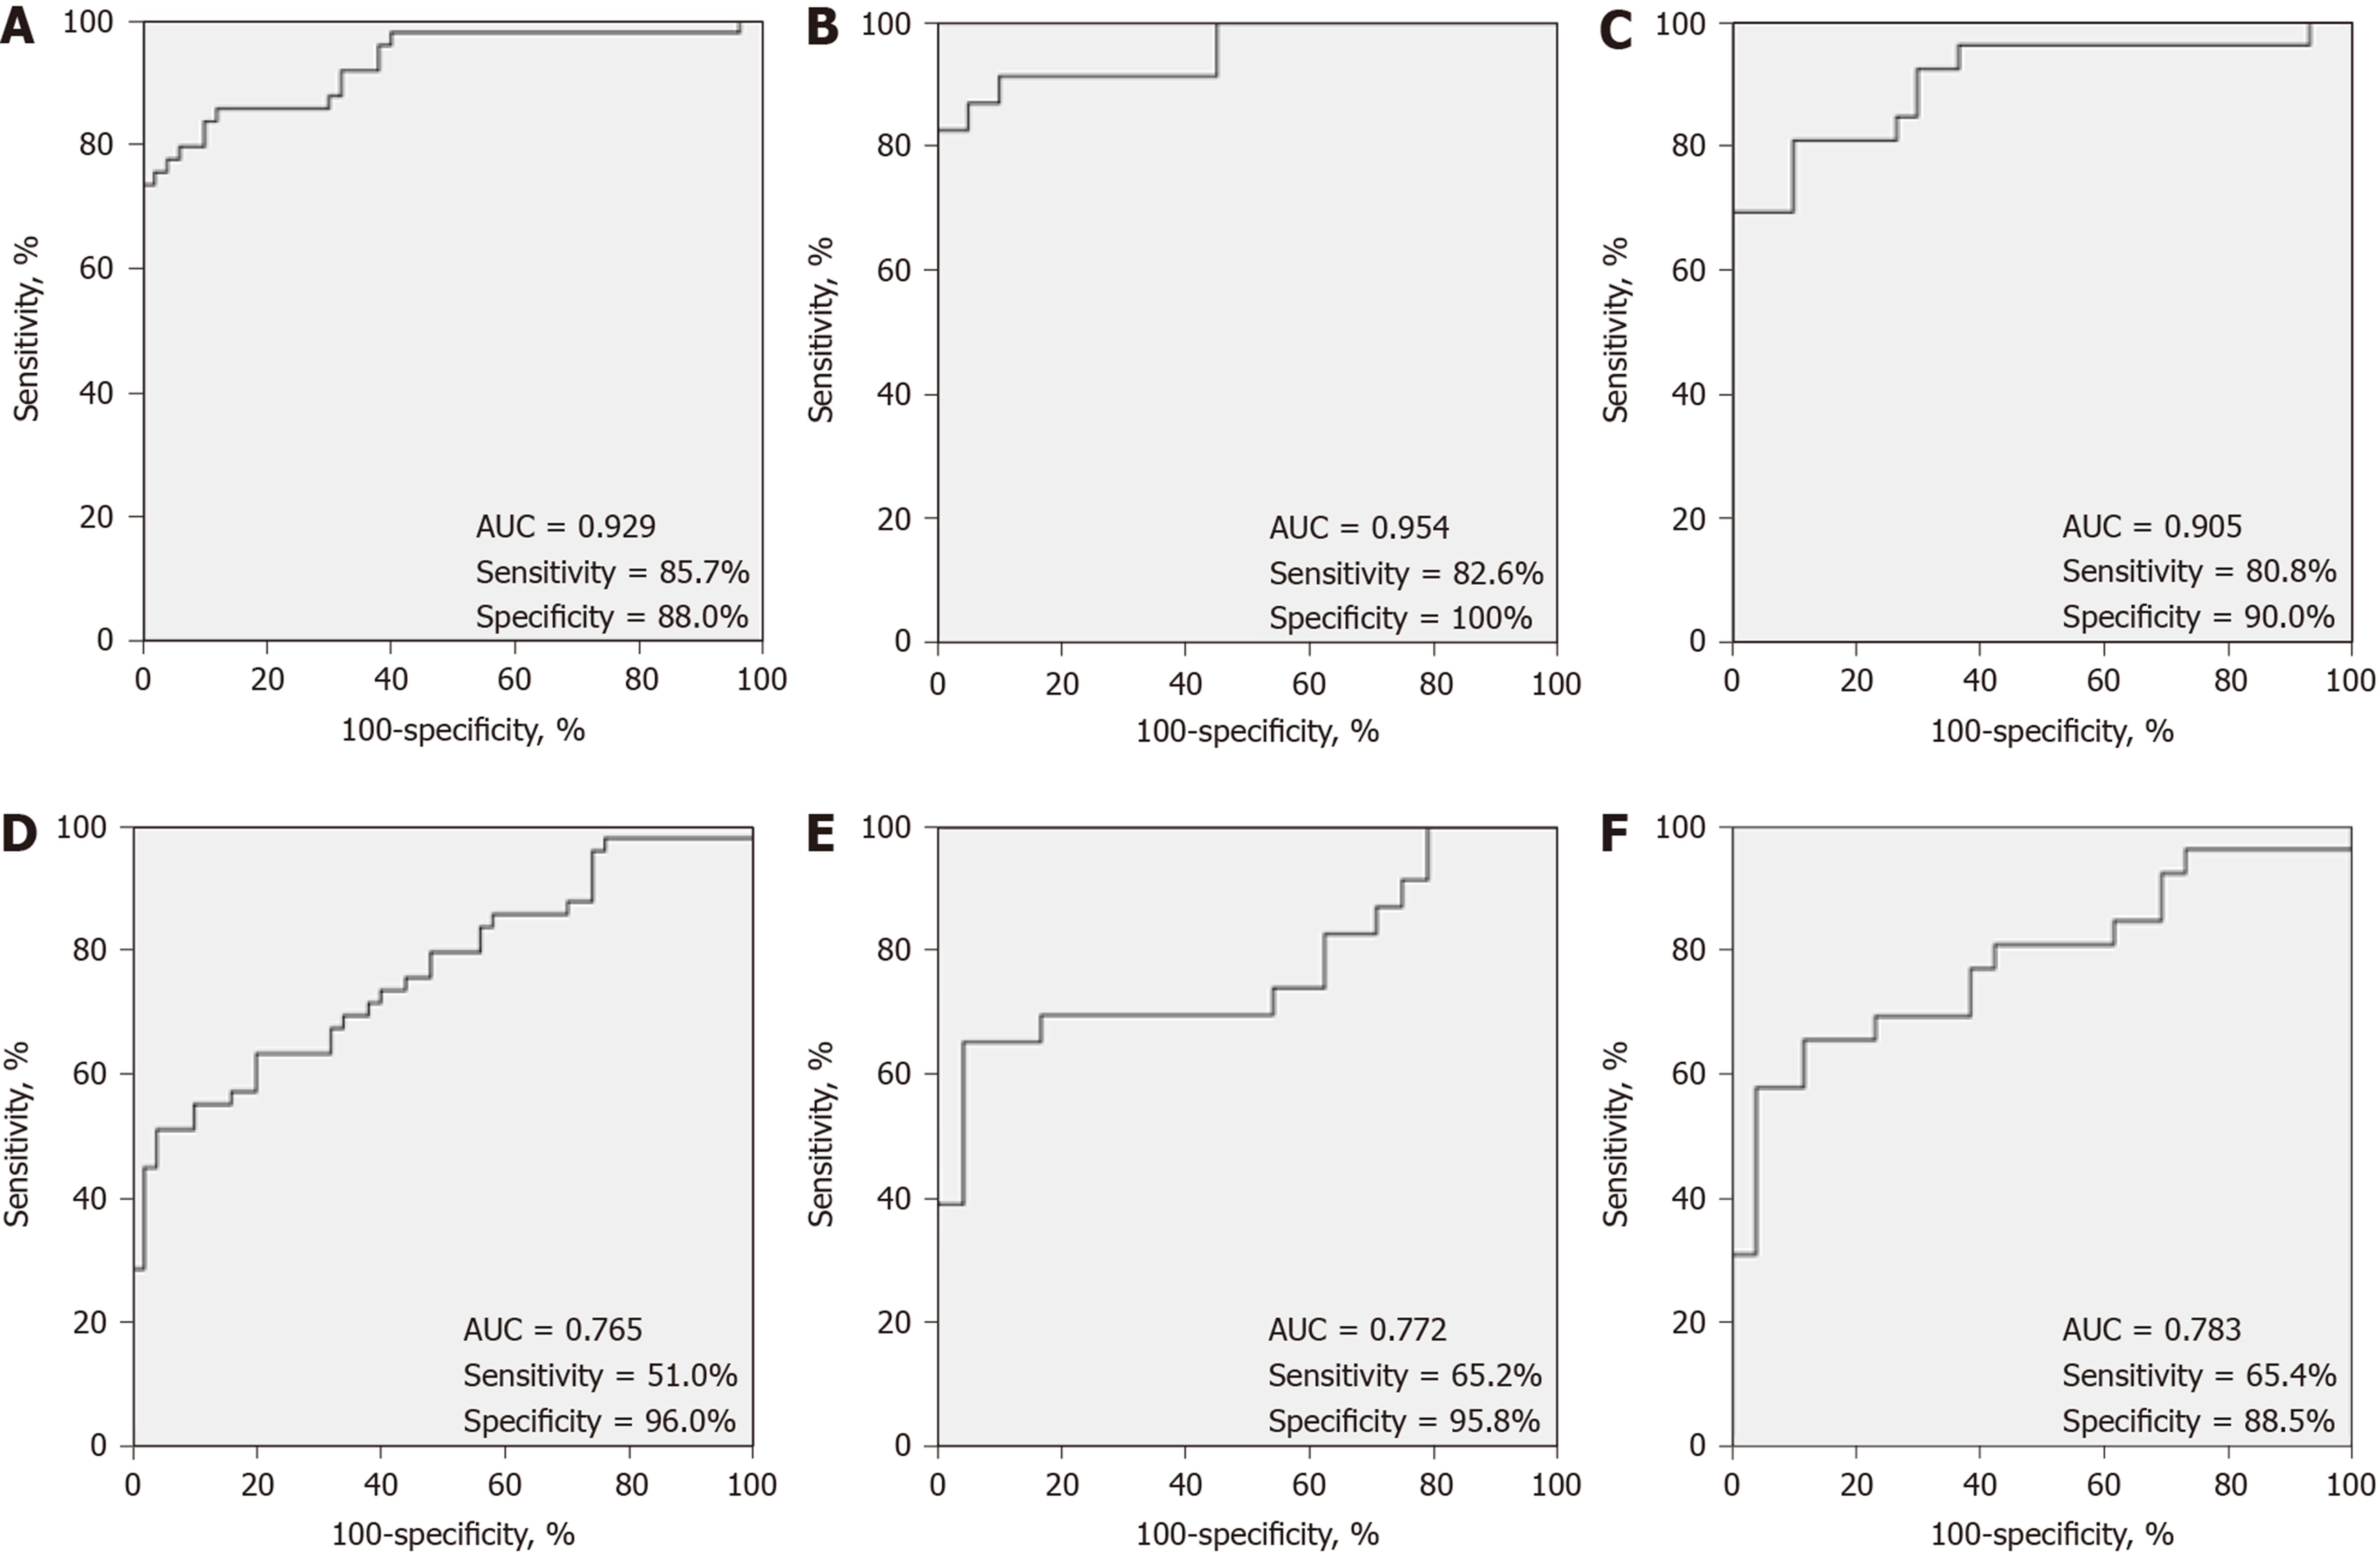
Figure 2 Receiver-operating characteristic curve analysis of growth differentiation factor 15 for the diagnosis of multiple system atrophy.
A: Total multiple system atrophy (MSA) patients vs total controls; B: Male MSA patients vs male controls; C: Female MSA patients vs female controls; D: Total MSA patients vs total Parkinson disease patients; E: Male MSA patients vs male Parkinson disease patients; F: Female MSA patients vs female controls. AUC: Area under the receiver-operating characteristic curve.
- Citation: Yue T, Lu H, Yao XM, Du X, Wang LL, Guo DD, Liu YM. Elevated serum growth differentiation factor 15 in multiple system atrophy patients: A case control study. World J Clin Cases 2020; 8(12): 2473-2483
- URL: https://www.wjgnet.com/2307-8960/full/v8/i12/2473.htm
- DOI: https://dx.doi.org/10.12998/wjcc.v8.i12.2473


