Copyright
©The Author(s) 2020.
World J Clin Cases. Jun 6, 2020; 8(11): 2255-2265
Published online Jun 6, 2020. doi: 10.12998/wjcc.v8.i11.2255
Published online Jun 6, 2020. doi: 10.12998/wjcc.v8.i11.2255
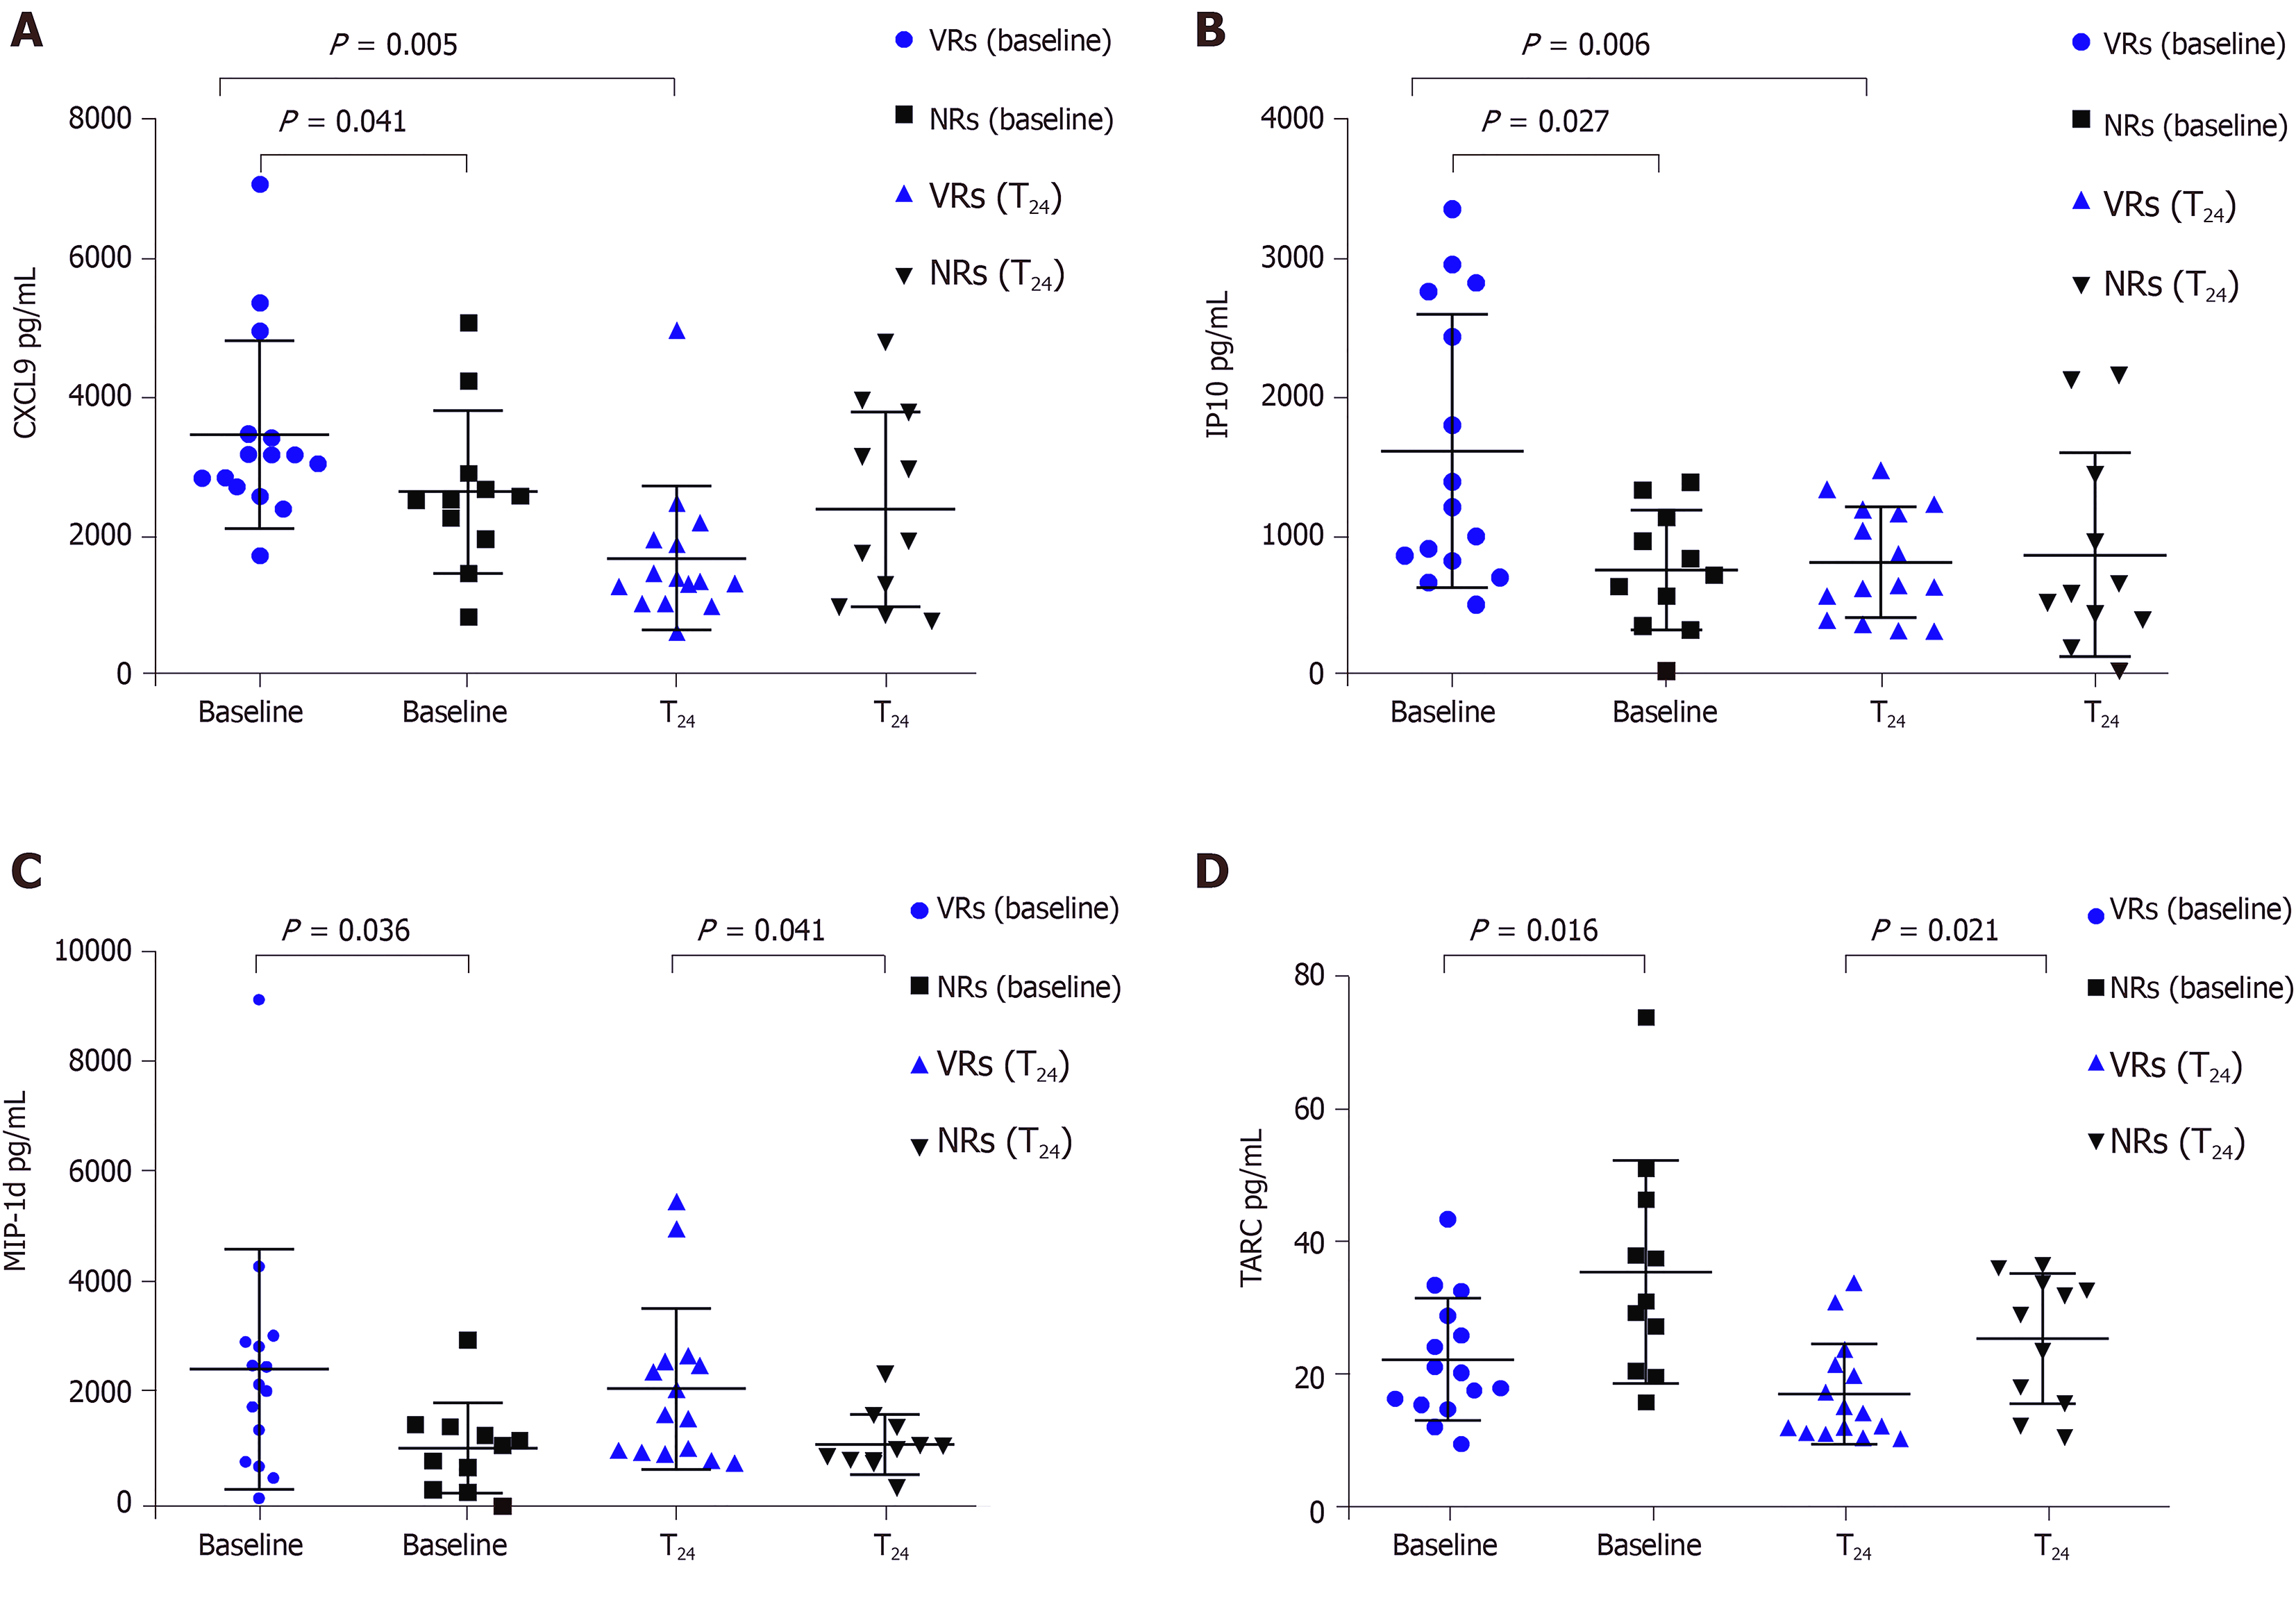
Figure 1 Serum levels of cytokines in chronic hepatitis B patients according to treatment phases and responses to peginterferon α-2a.
A: CXC-chemokine ligand 9; B: Interferon gamma-induced protein 10; C: Macrophge inhibitory protein-1 delta; D: Thymus and activation-regulated chemokine. VRs: Virological responders, NRs: Non-virological responders; CXCL9: CXC-chemokine ligand 9; IP10: Interferon gamma-induced protein 10; MIP-1d: Macrophge inhibitory protein-1 delta; TARC: Thymus and activation-regulated chemokine.
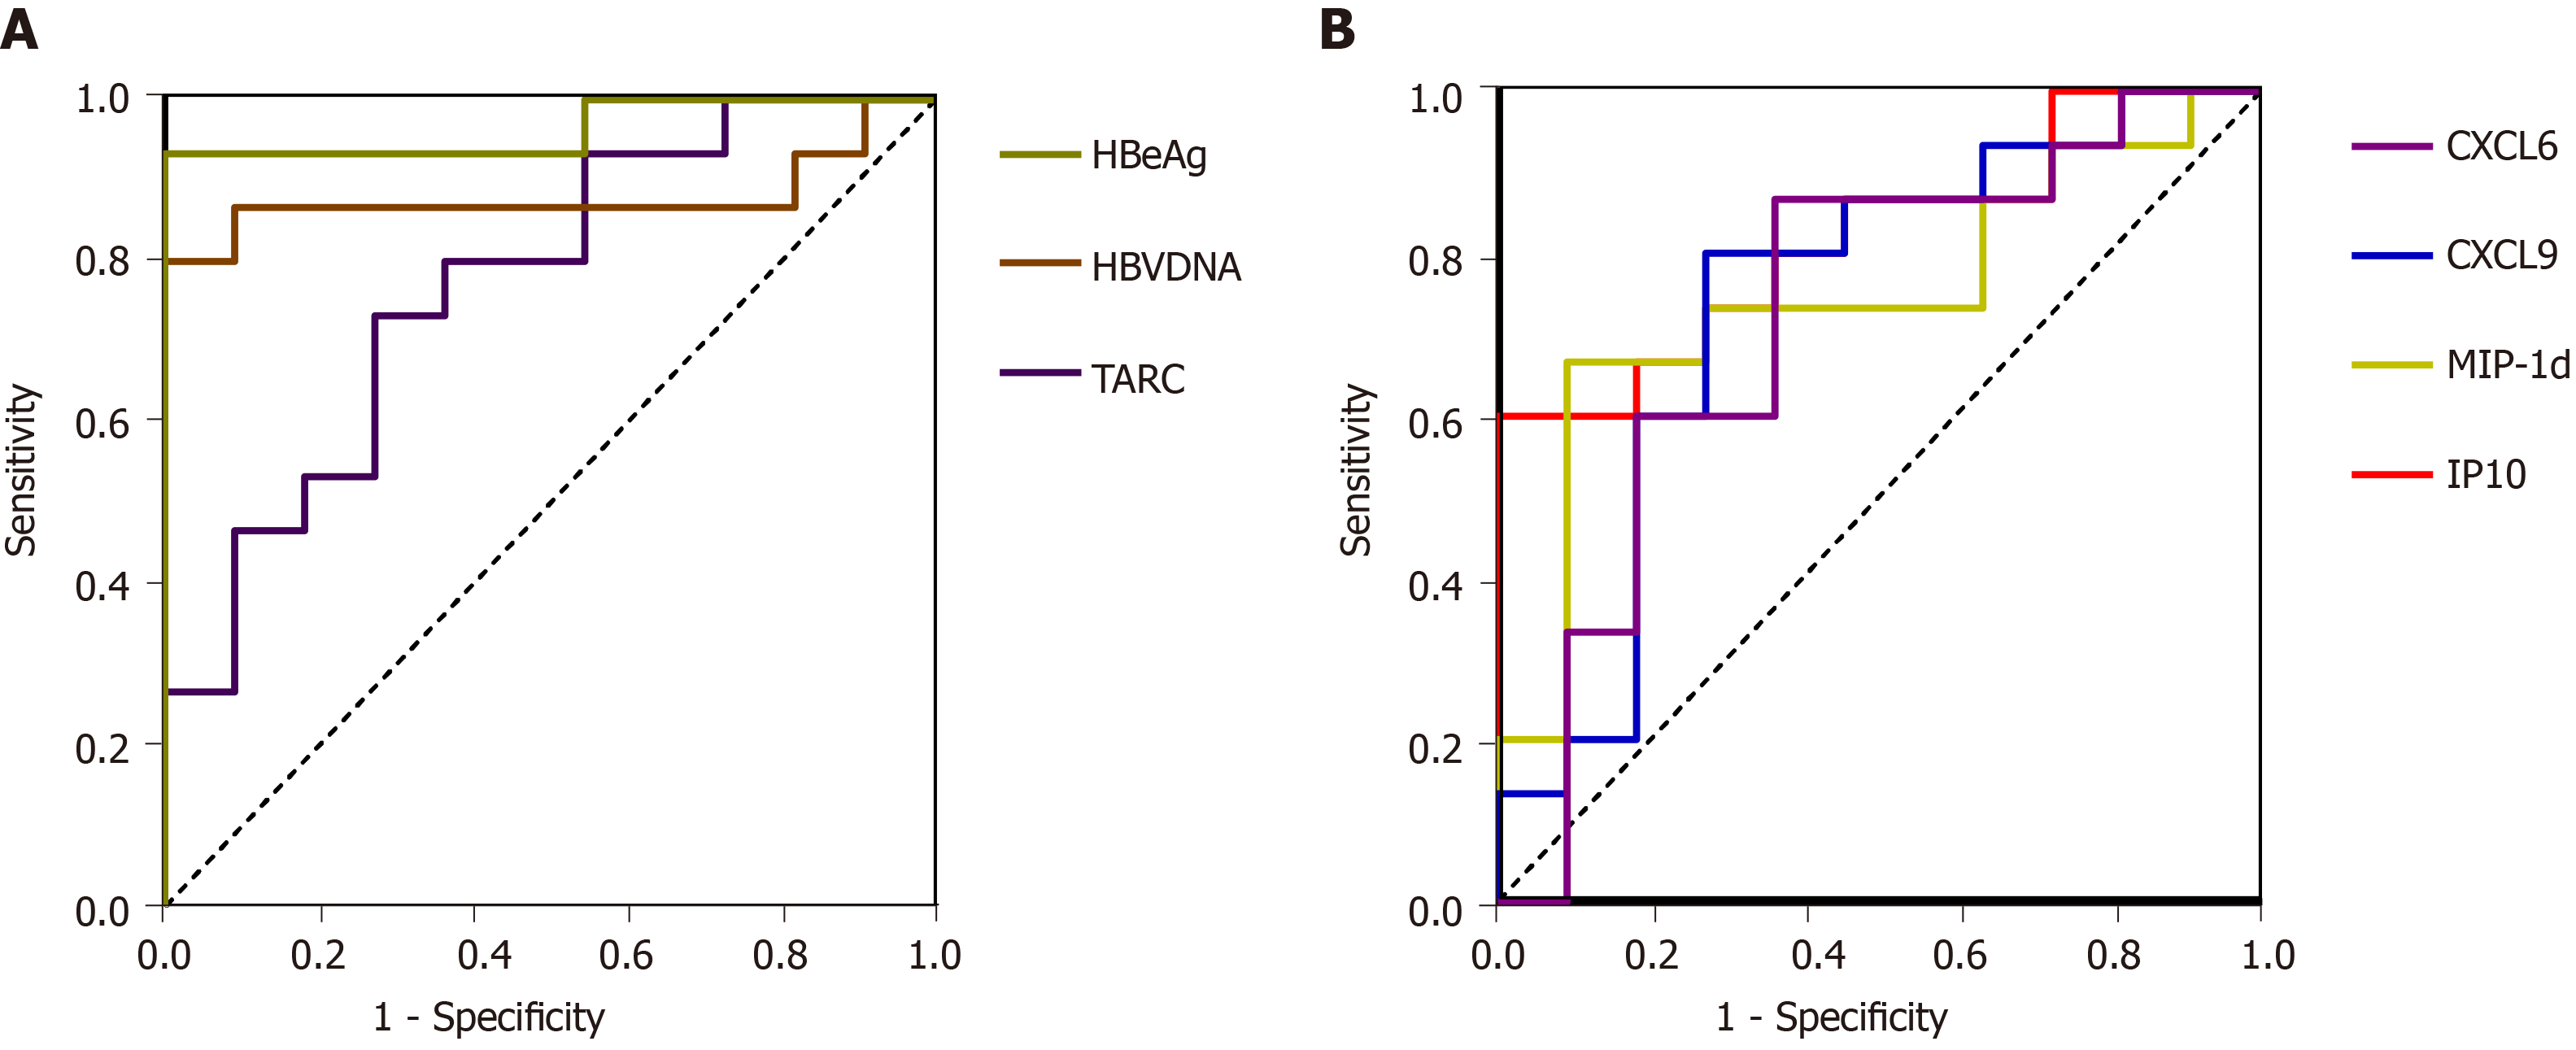
Figure 2 Receiver operating characteristic curves of hepatitis B virus deoxyribonucleic acid, hepatitis B e antigen, and cytokines for predicting virological responses.
A: The receiver operating characteristic curves values of the serum hepatitis B virus deoxyribonucleic acid and hepatitis B e antigen levels measured before peginterferon therapy were 0.879 and 0.964, respectively. The sensitivity and specificity of the baseline thymus and activation-regulated chemokine were 72.70% and 73.30%, respectively; B: The sensitivity and specificity of the baseline macrophge inhibitory protein-1 delta, CXC-chemokine ligand 9, CXC-chemokine ligand 6, and interferon gamma-induced protein 10 levels in predicting virological responder were 69.20% and 84.60%, 76.90% and 76.90%, 61.50% and 84.60%, and 61.50% and 92.30%, respectively. HBeAg: Hepatitis B e antigen; HBV: Hepatitis B virus; TARC: Thymus and activation-regulated chemokine; CXCL6: CXC-chemokine ligand 6; MIP-1d: Macrophge inhibitory protein-1 delta; IP10: Interferon gamma-induced protein 10.
- Citation: Fu WK, Cao J, Mi NN, Huang CF, Gao L, Zhang JD, Yue P, Bai B, Lin YY, Meng WB. Cytokines predict virological response in chronic hepatitis B patients receiving peginterferon alfa-2a therapy. World J Clin Cases 2020; 8(11): 2255-2265
- URL: https://www.wjgnet.com/2307-8960/full/v8/i11/2255.htm
- DOI: https://dx.doi.org/10.12998/wjcc.v8.i11.2255


