Copyright
©The Author(s) 2019.
World J Clin Cases. Mar 6, 2019; 7(5): 600-615
Published online Mar 6, 2019. doi: 10.12998/wjcc.v7.i5.600
Published online Mar 6, 2019. doi: 10.12998/wjcc.v7.i5.600
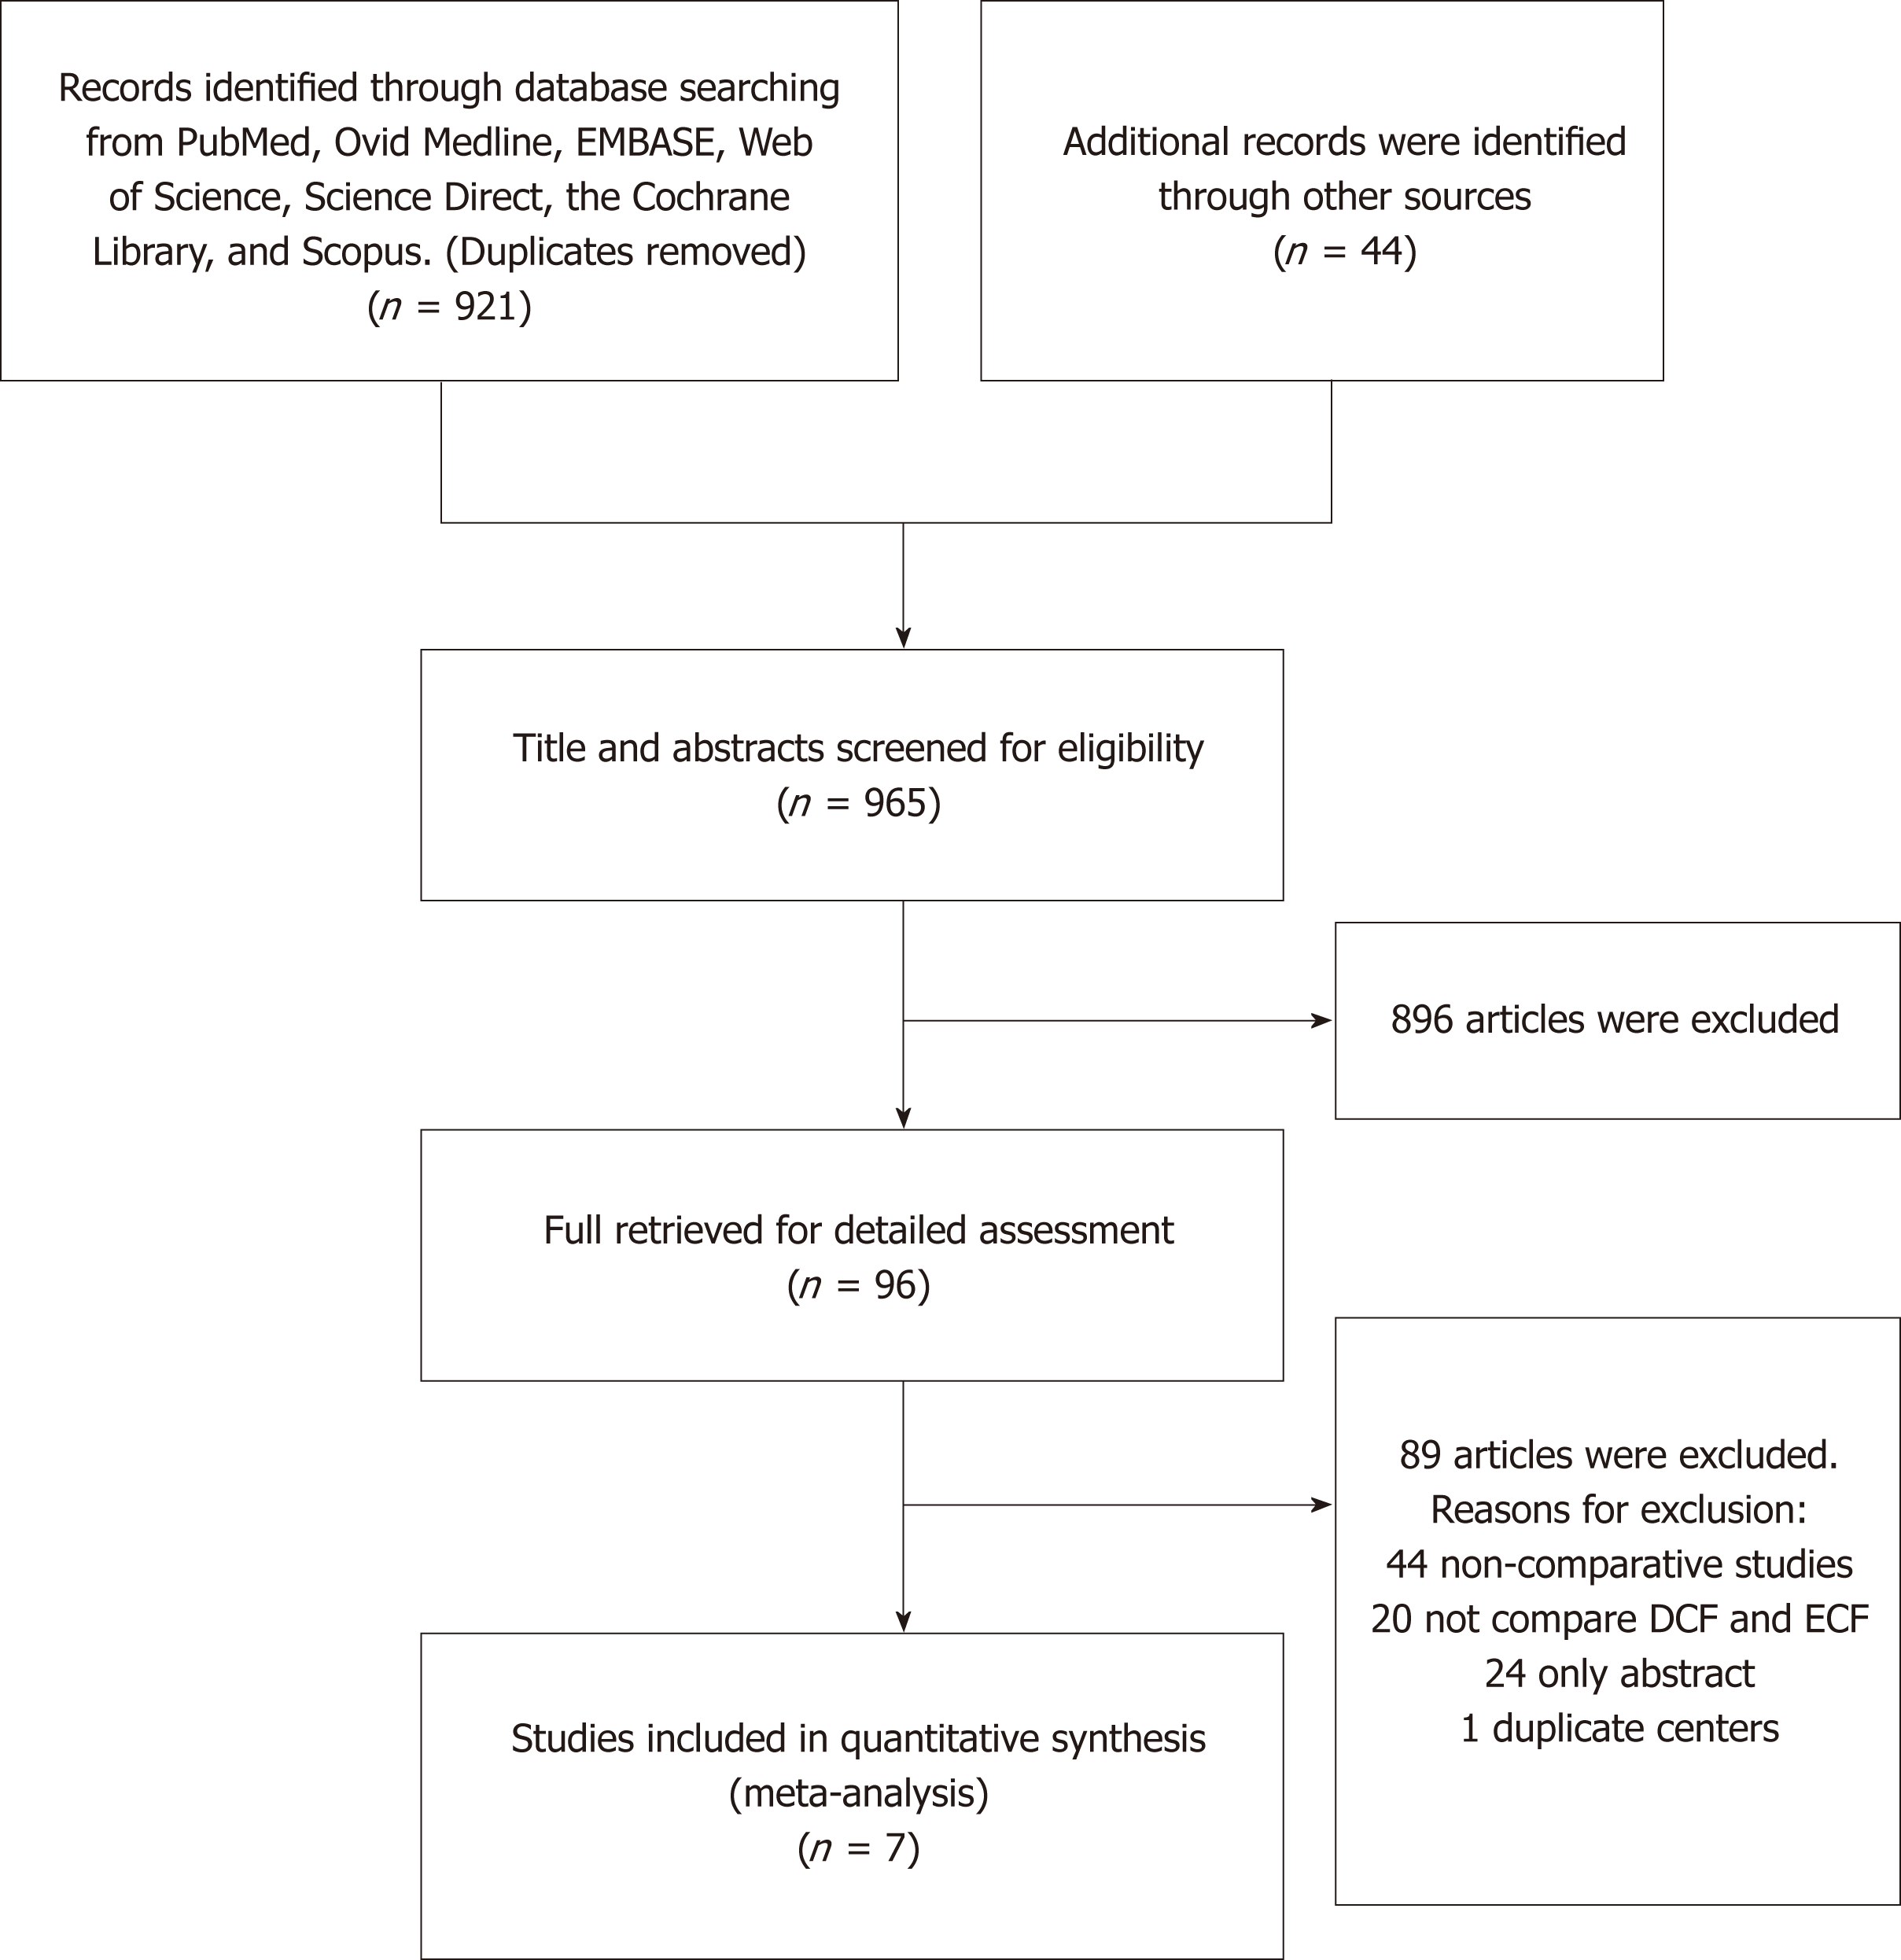
Figure 1 Flow chart of the study selection.
ECF: Epirubicin, cisplatin, and 5-fluorouracil; DCF: Docetaxel, cisplatin, and 5-fluorouracil.
Figure 2 Forest plot of hazard ratio of progression-free survival associated with docetaxel, cisplatin, and 5-fluorouracil vs epirubicin, cisplatin, and 5-fluorouracil.
ECF: Epirubicin, cisplatin, and 5-fluorouracil; DCF: Docetaxel, cisplatin, and 5-fluorouracil.
Figure 3 Forest plot of hazard ratio of overall survival associated with docetaxel, cisplatin, and 5-fluorouracil vs epirubicin, cisplatin, and 5-fluorouracil.
ECF: Epirubicin, cisplatin, and 5-fluorouracil; DCF: Docetaxel, cisplatin, and 5-fluorouracil.
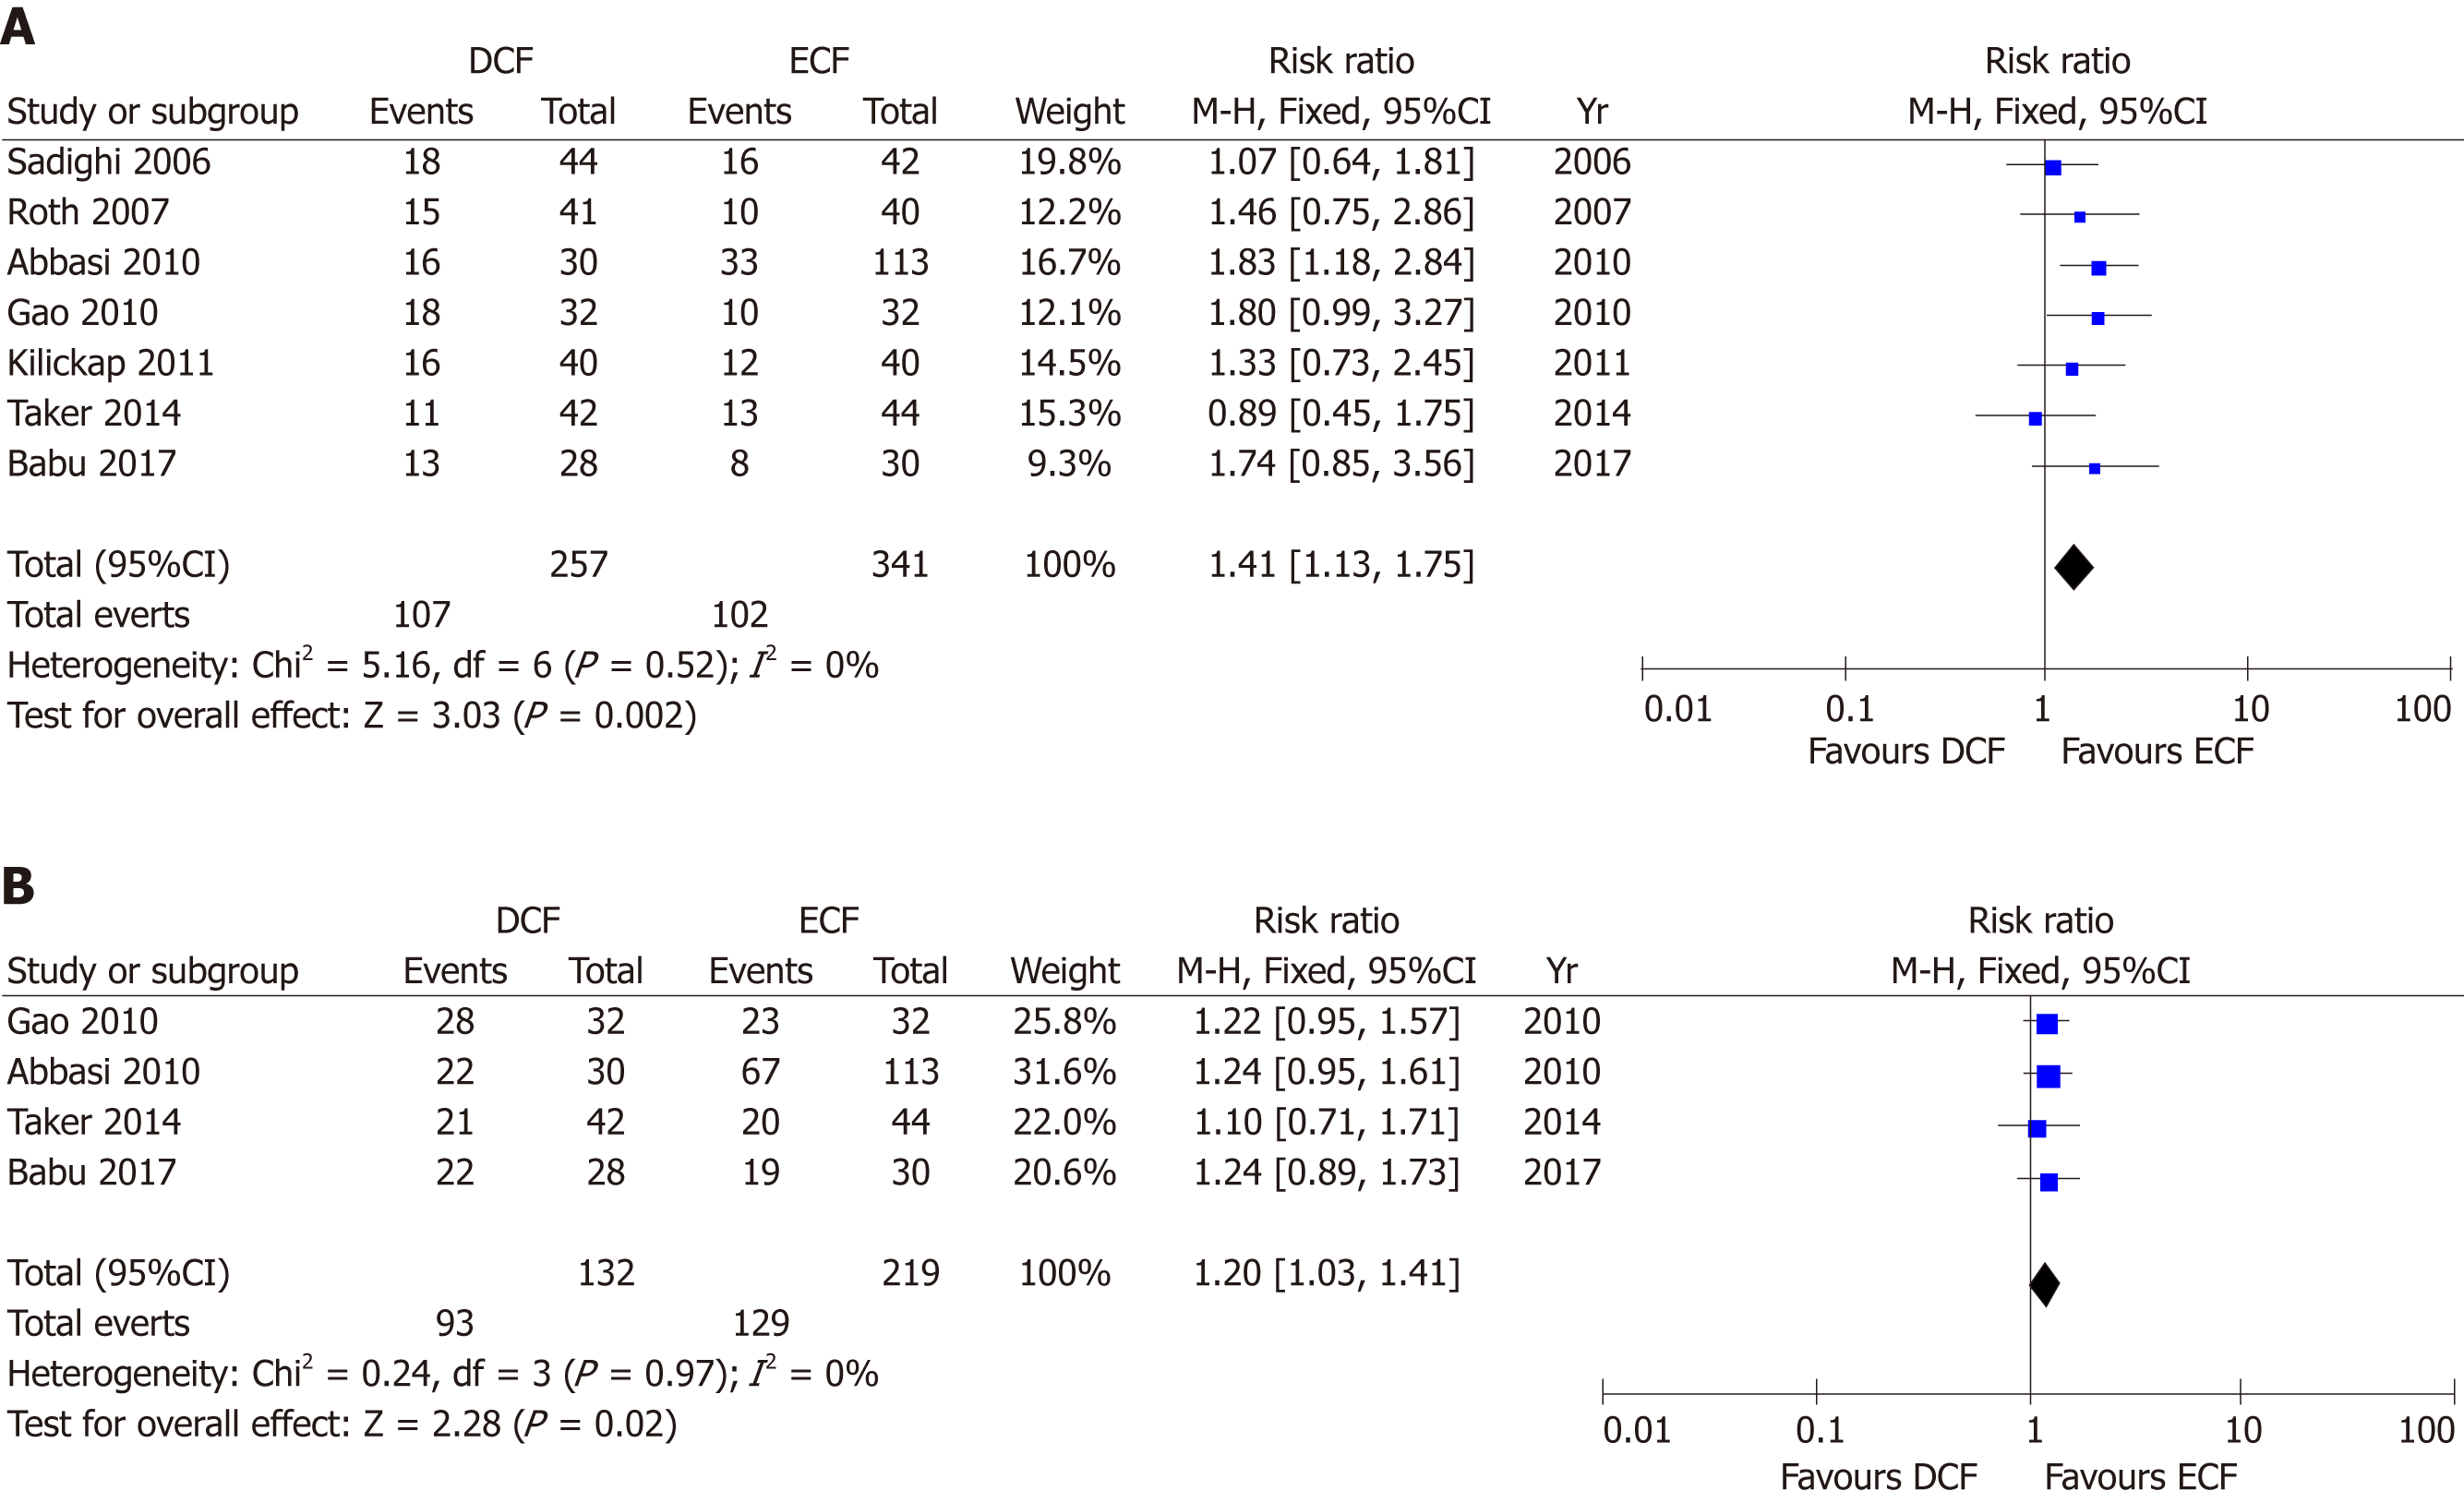
Figure 4 Forest plots of risk ratios of objective response rate (A) and disease control rate (B) associated with docetaxel, cisplatin, and 5-fluorouracil vs epirubicin, cisplatin, and 5-fluorouracil.
ECF: Epirubicin, cisplatin, and 5-fluorouracil; DCF: Docetaxel, cisplatin, and 5-fluorouracil.
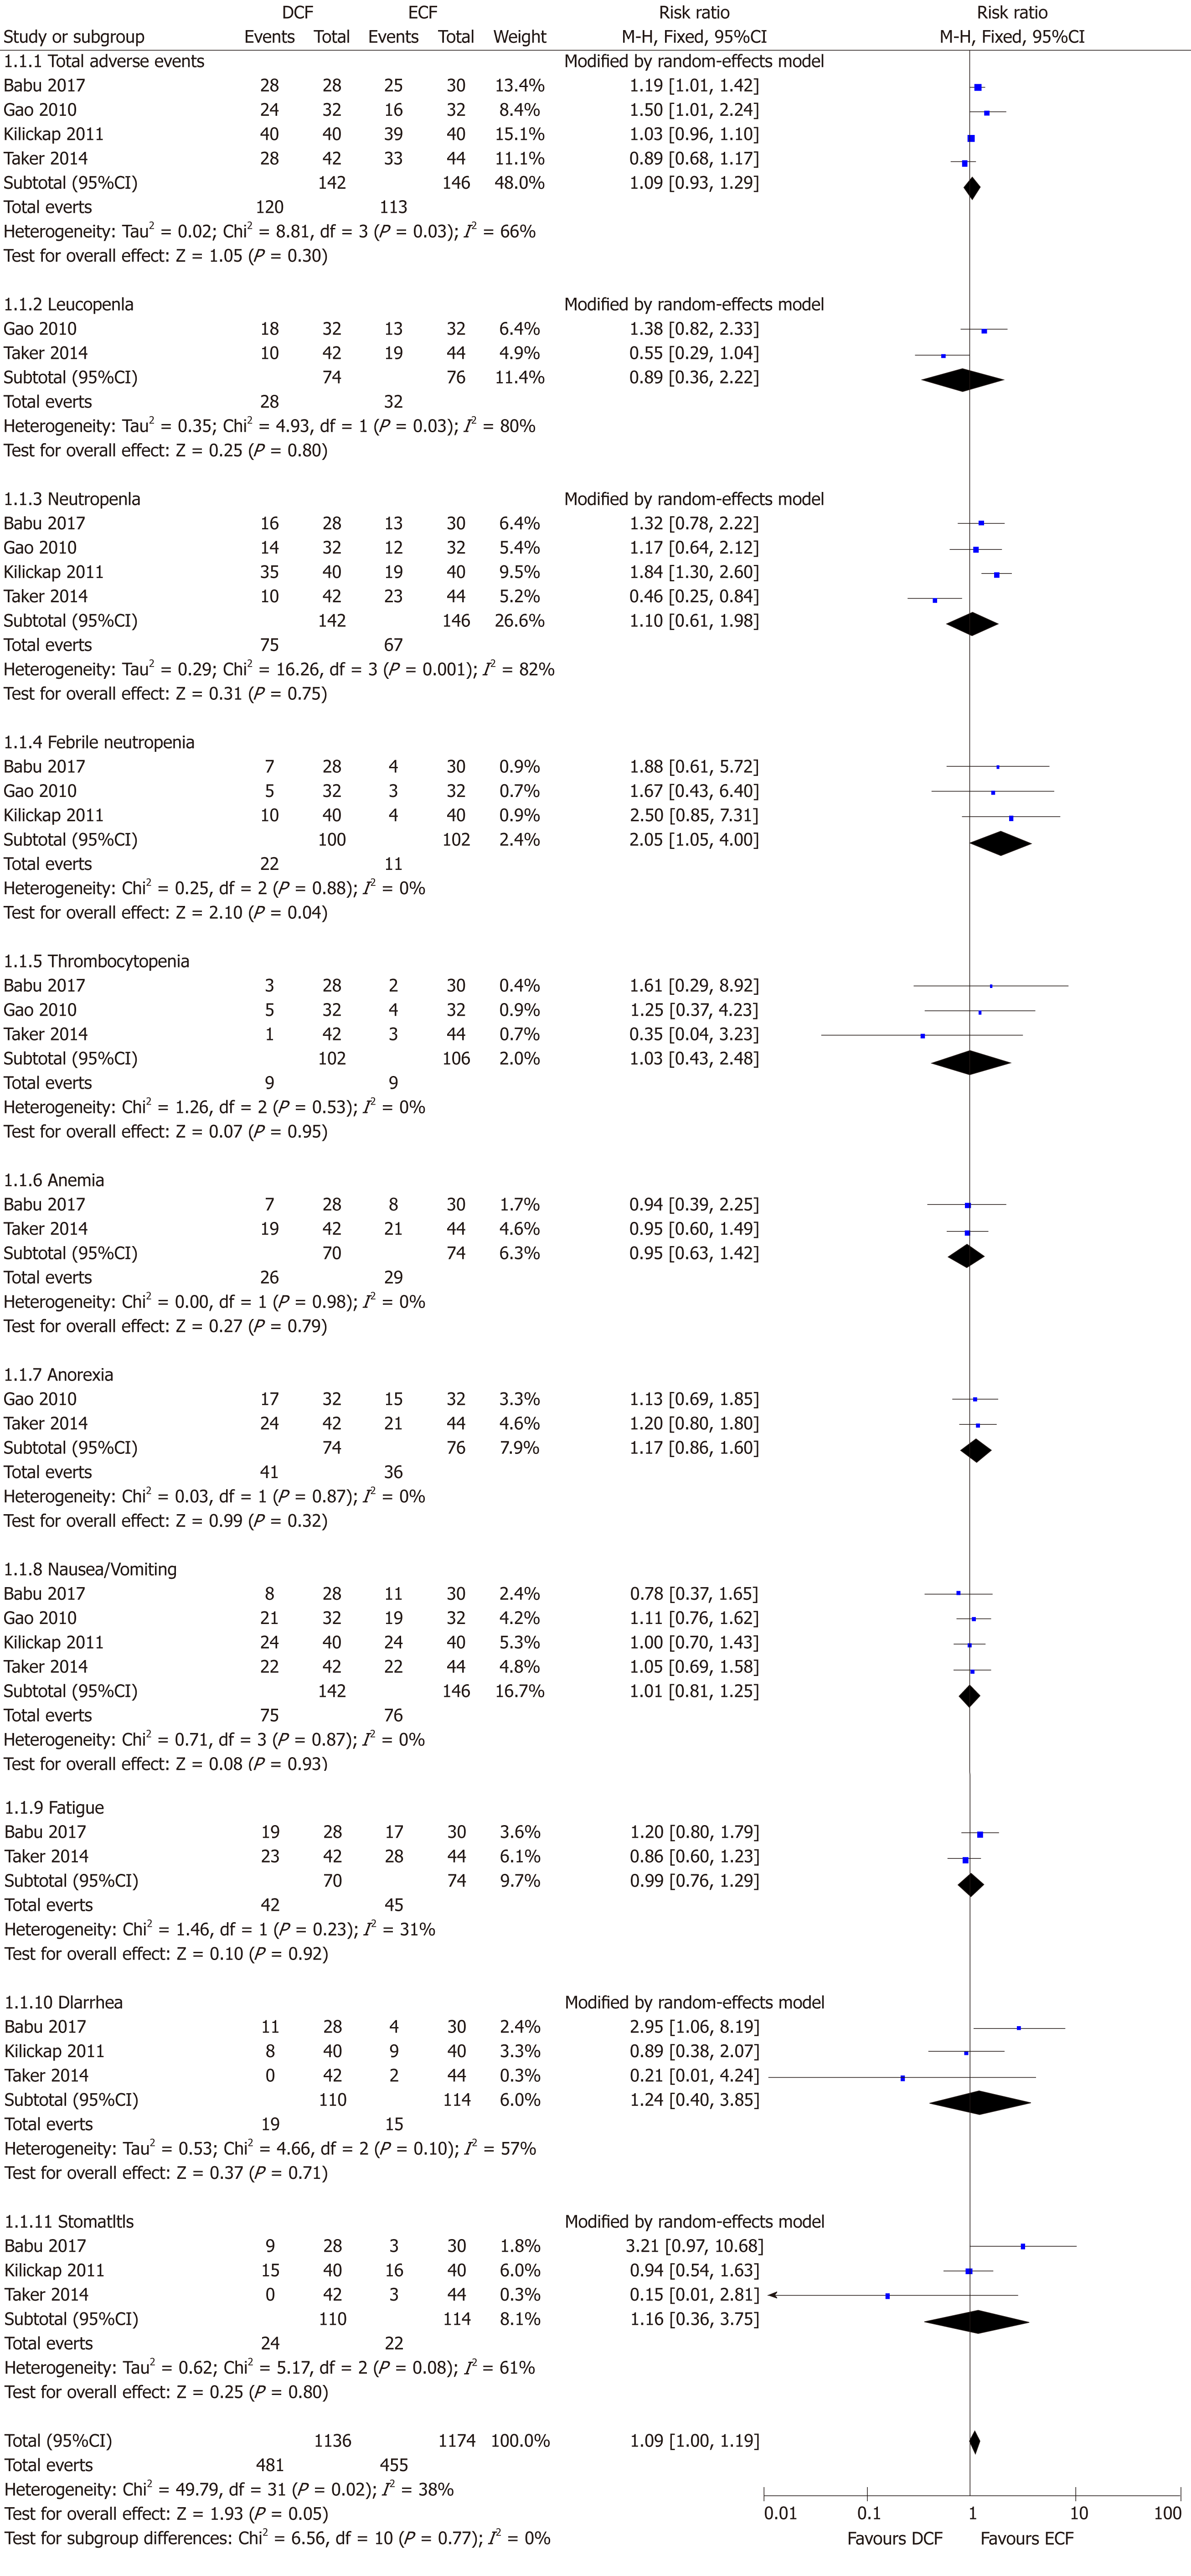
Figure 5 Forest plots of risk ratios of all-grade adverse effects associated with docetaxel, cisplatin, and 5-fluorouracil vs epirubicin, cisplatin, and 5-fluorouracil.
ECF: Epirubicin, cisplatin, and 5-fluorouracil; DCF: Docetaxel, cisplatin, and 5-fluorouracil.
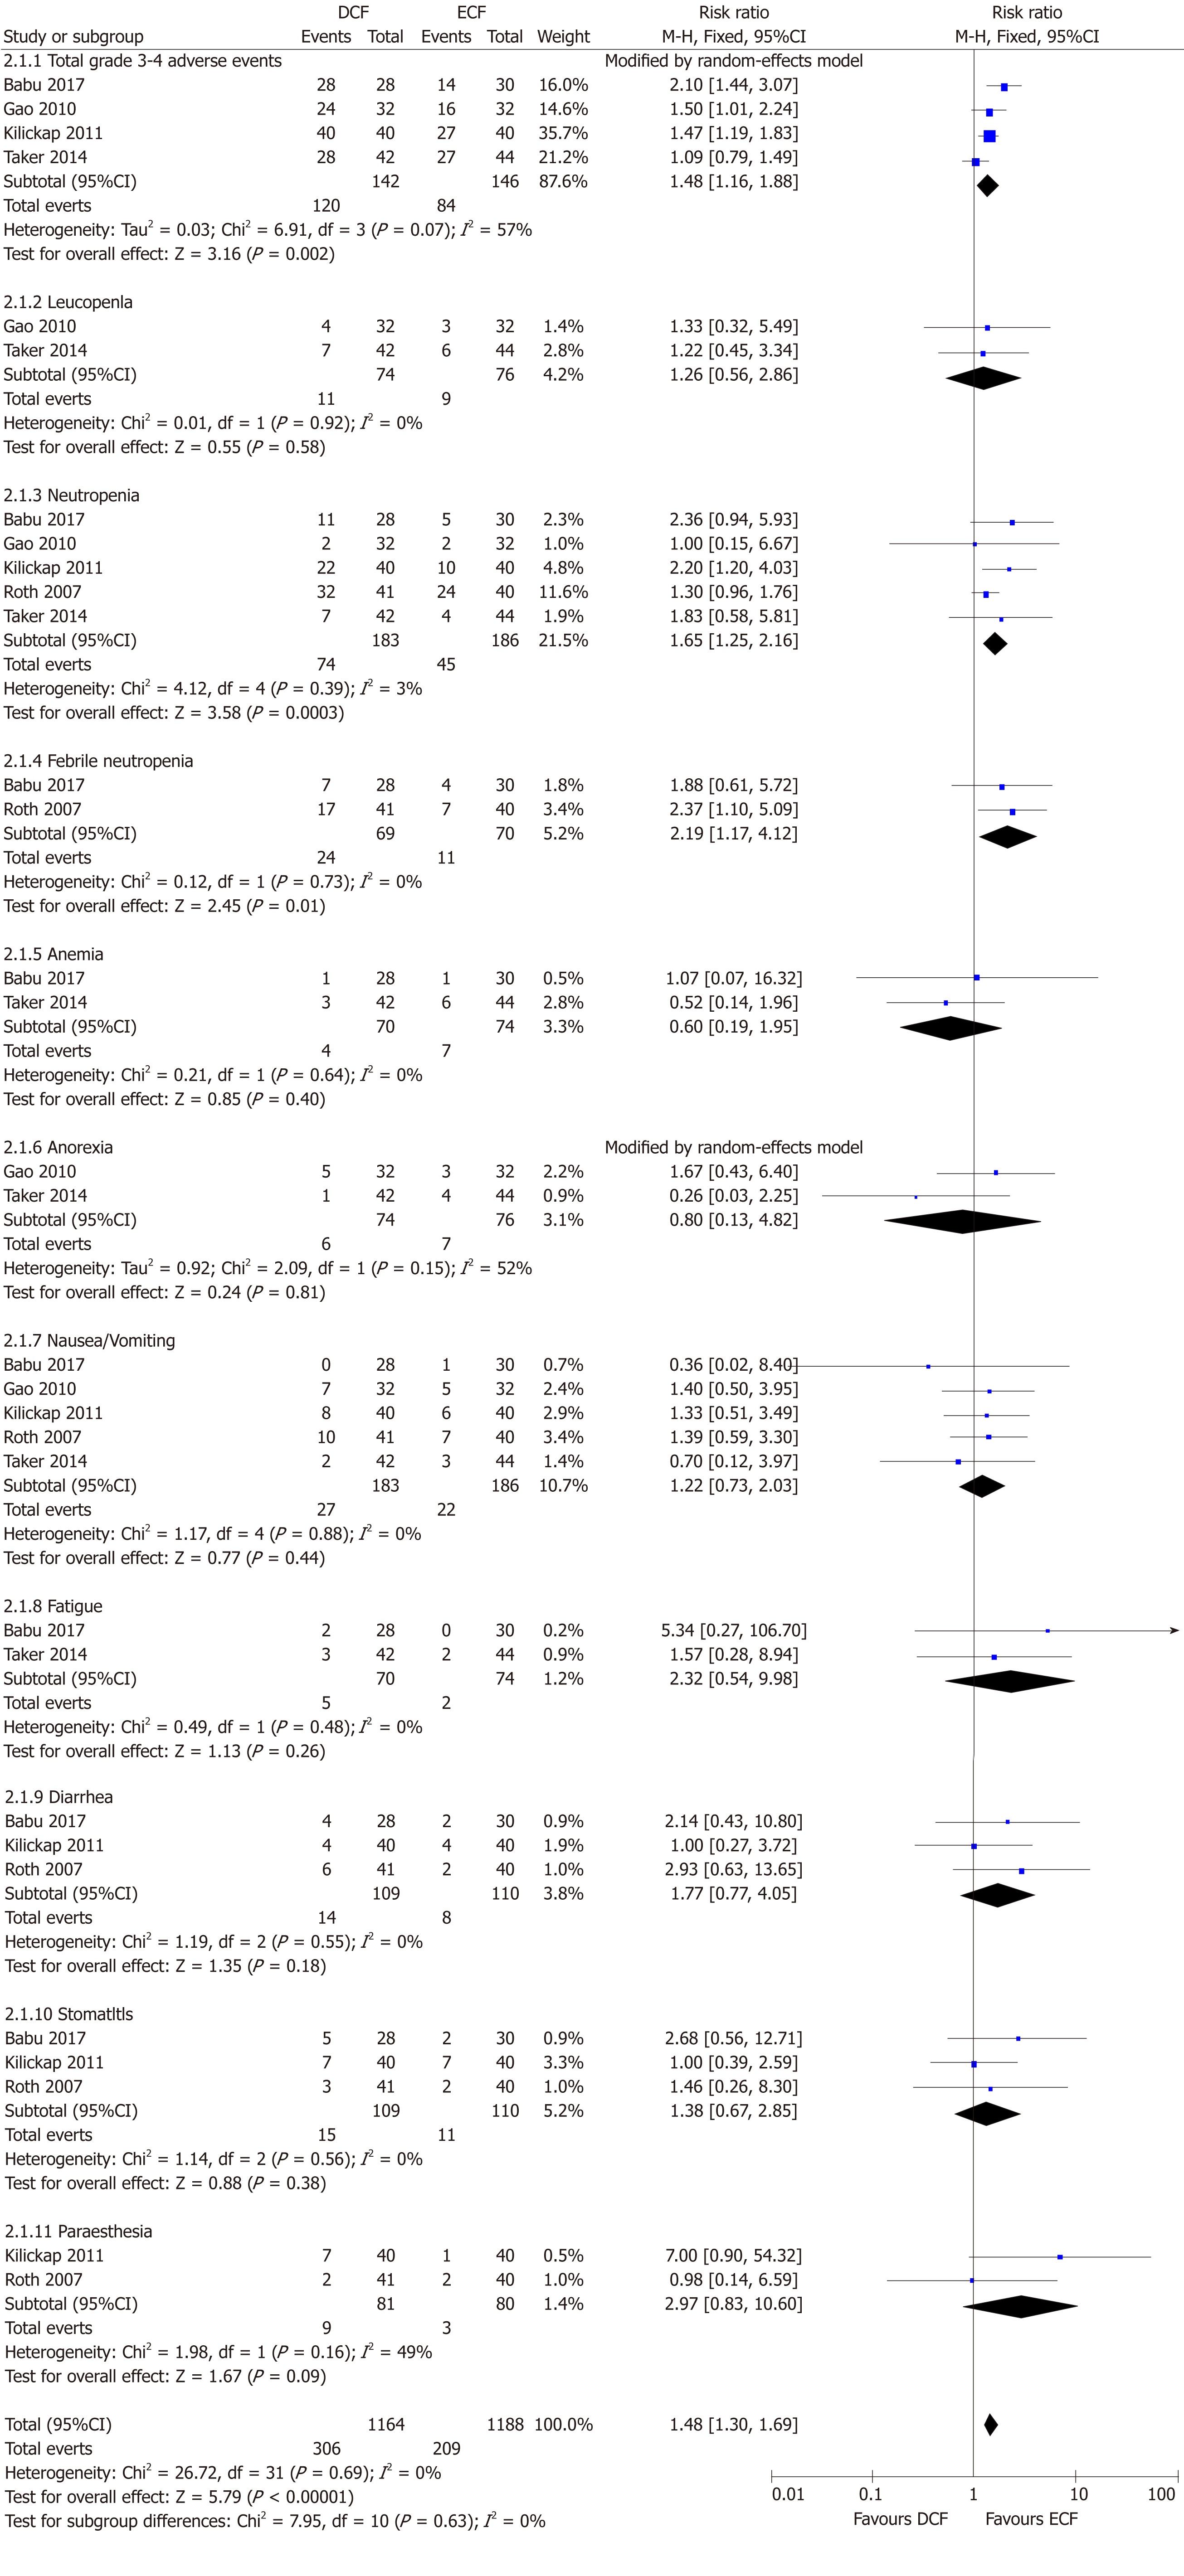
Figure 6 Forest plots of risk ratios of grade 3-4 adverse effects associated with docetaxel, cisplatin, and 5-fluorouracil vs epirubicin, cisplatin, and 5-fluorouracil.
ECF: Epirubicin, cisplatin, and 5-fluorouracil; DCF: Docetaxel, cisplatin, and 5-fluorouracil.
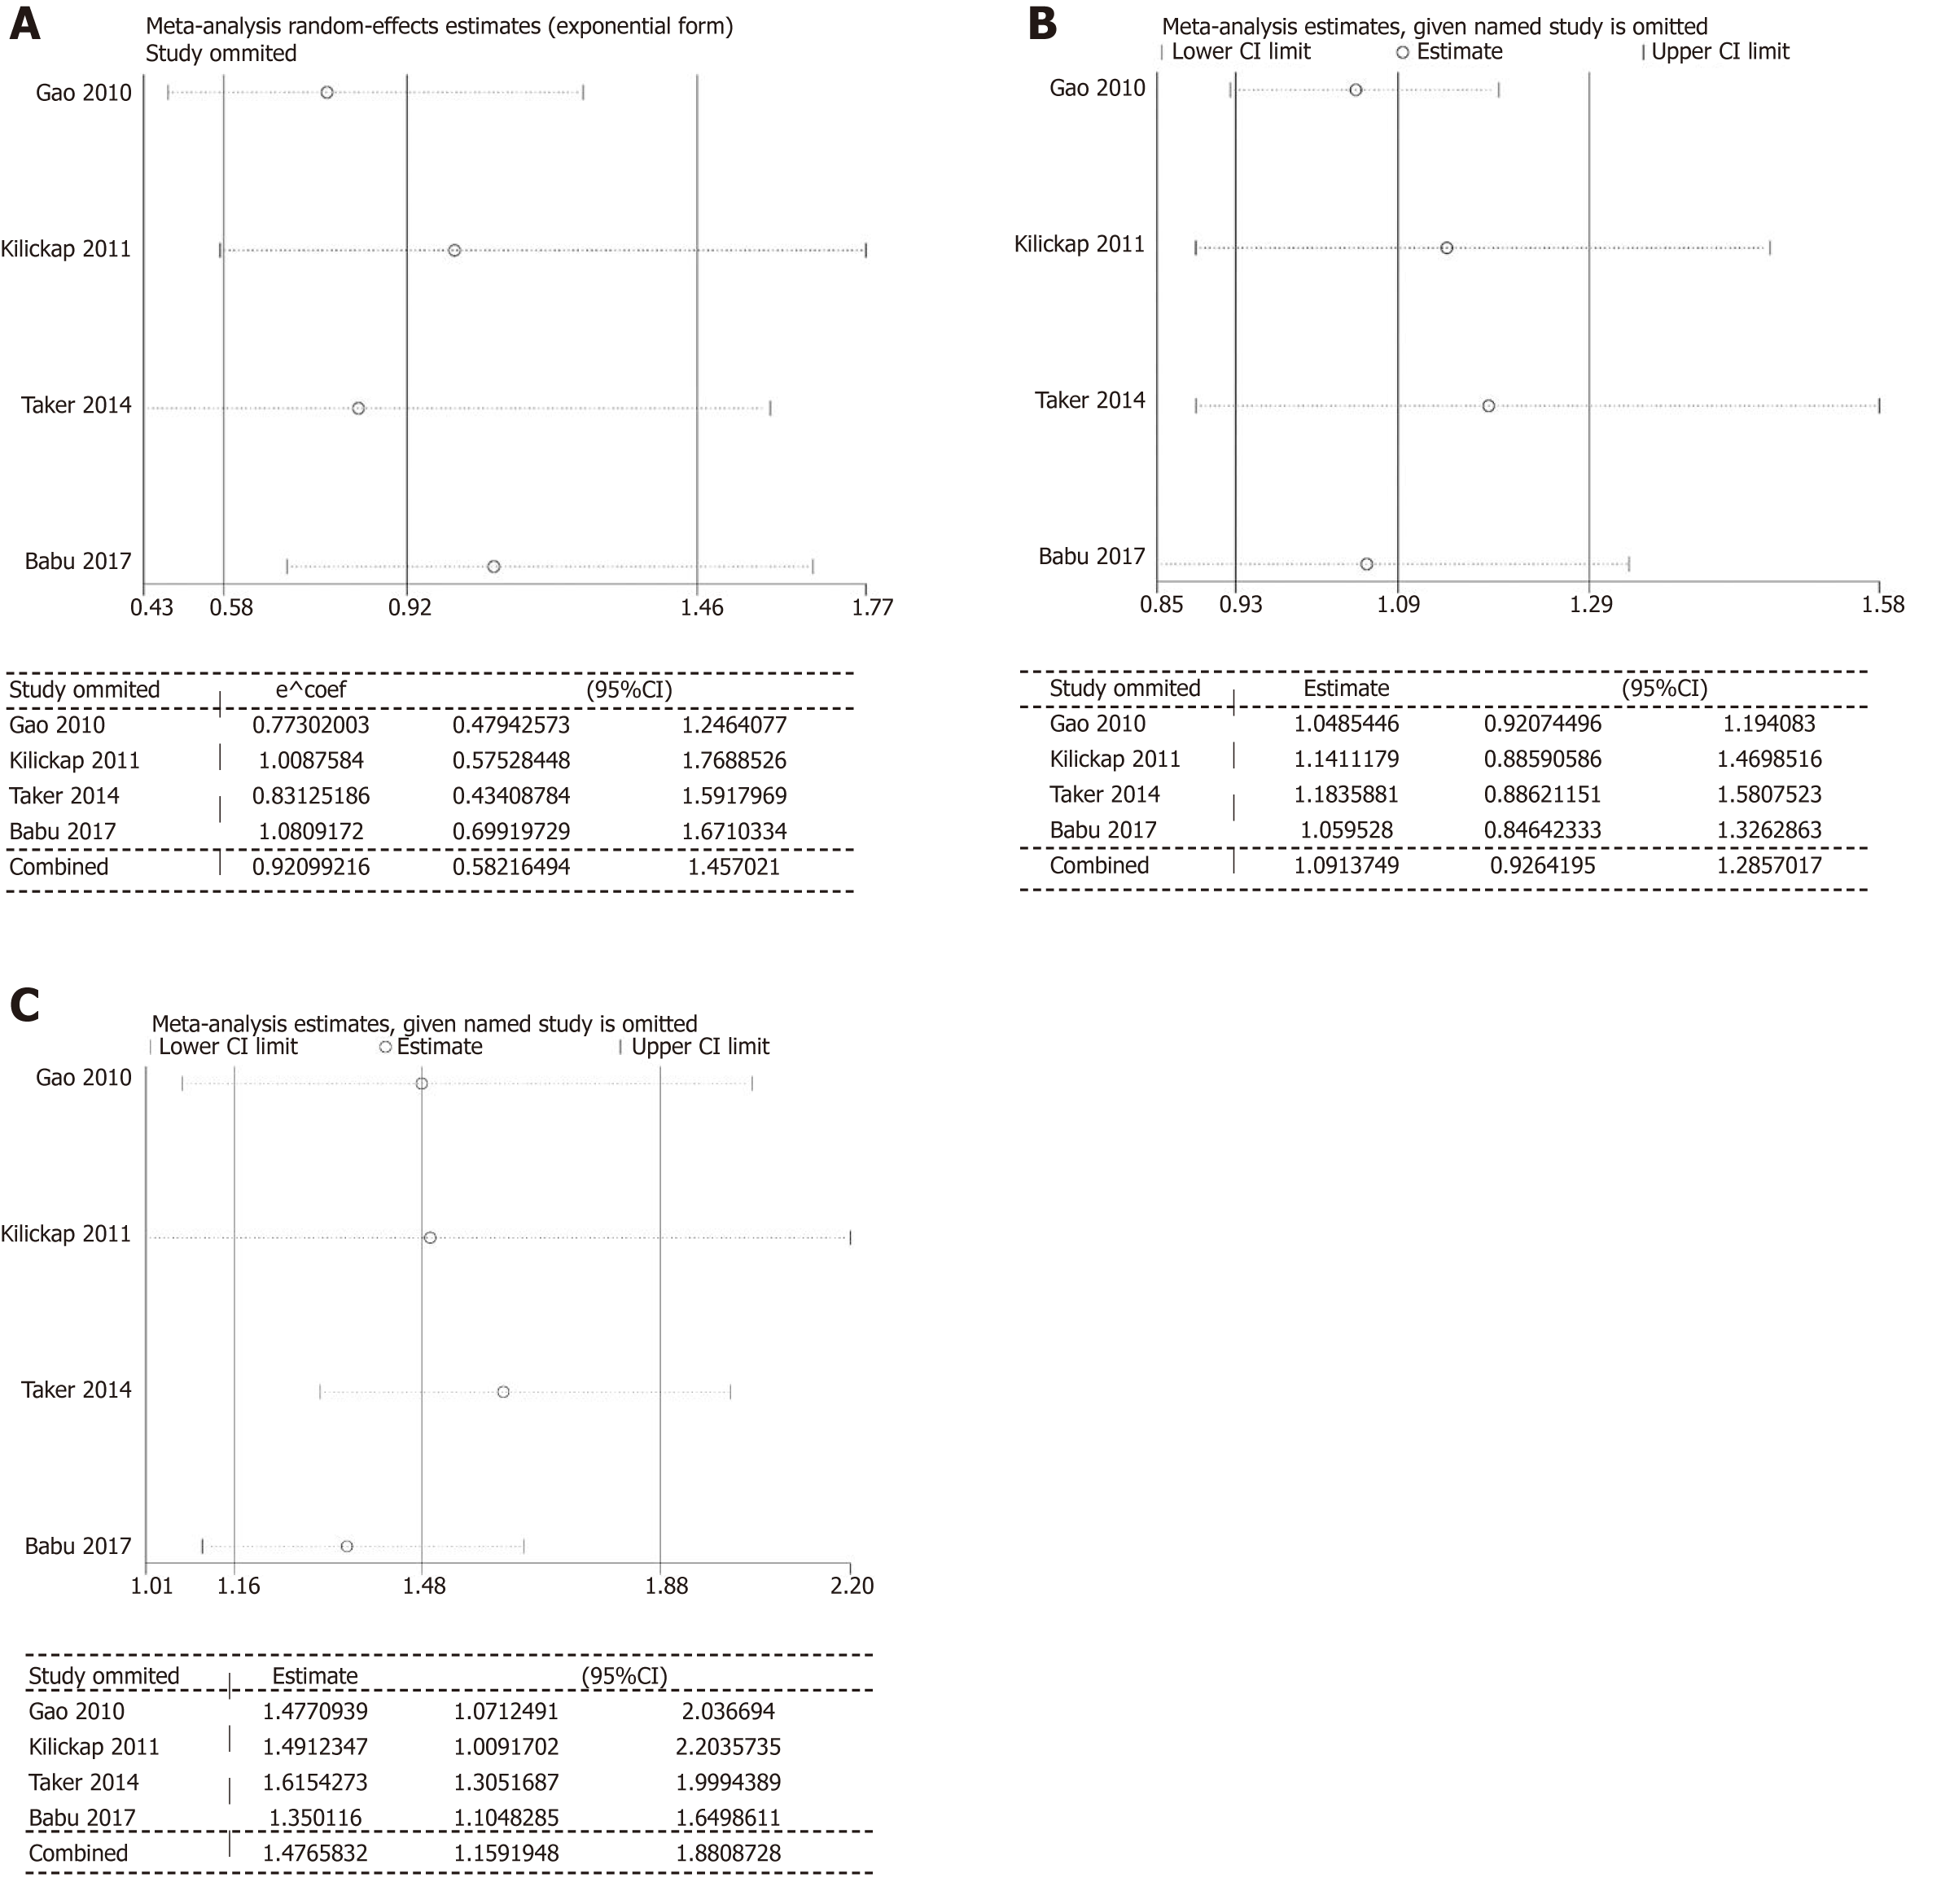
Figure 7 Meta-based influence analysis for comparisons of objective response rate (A), total adverse effects (B), and grade 3-4 adverse effects (C).
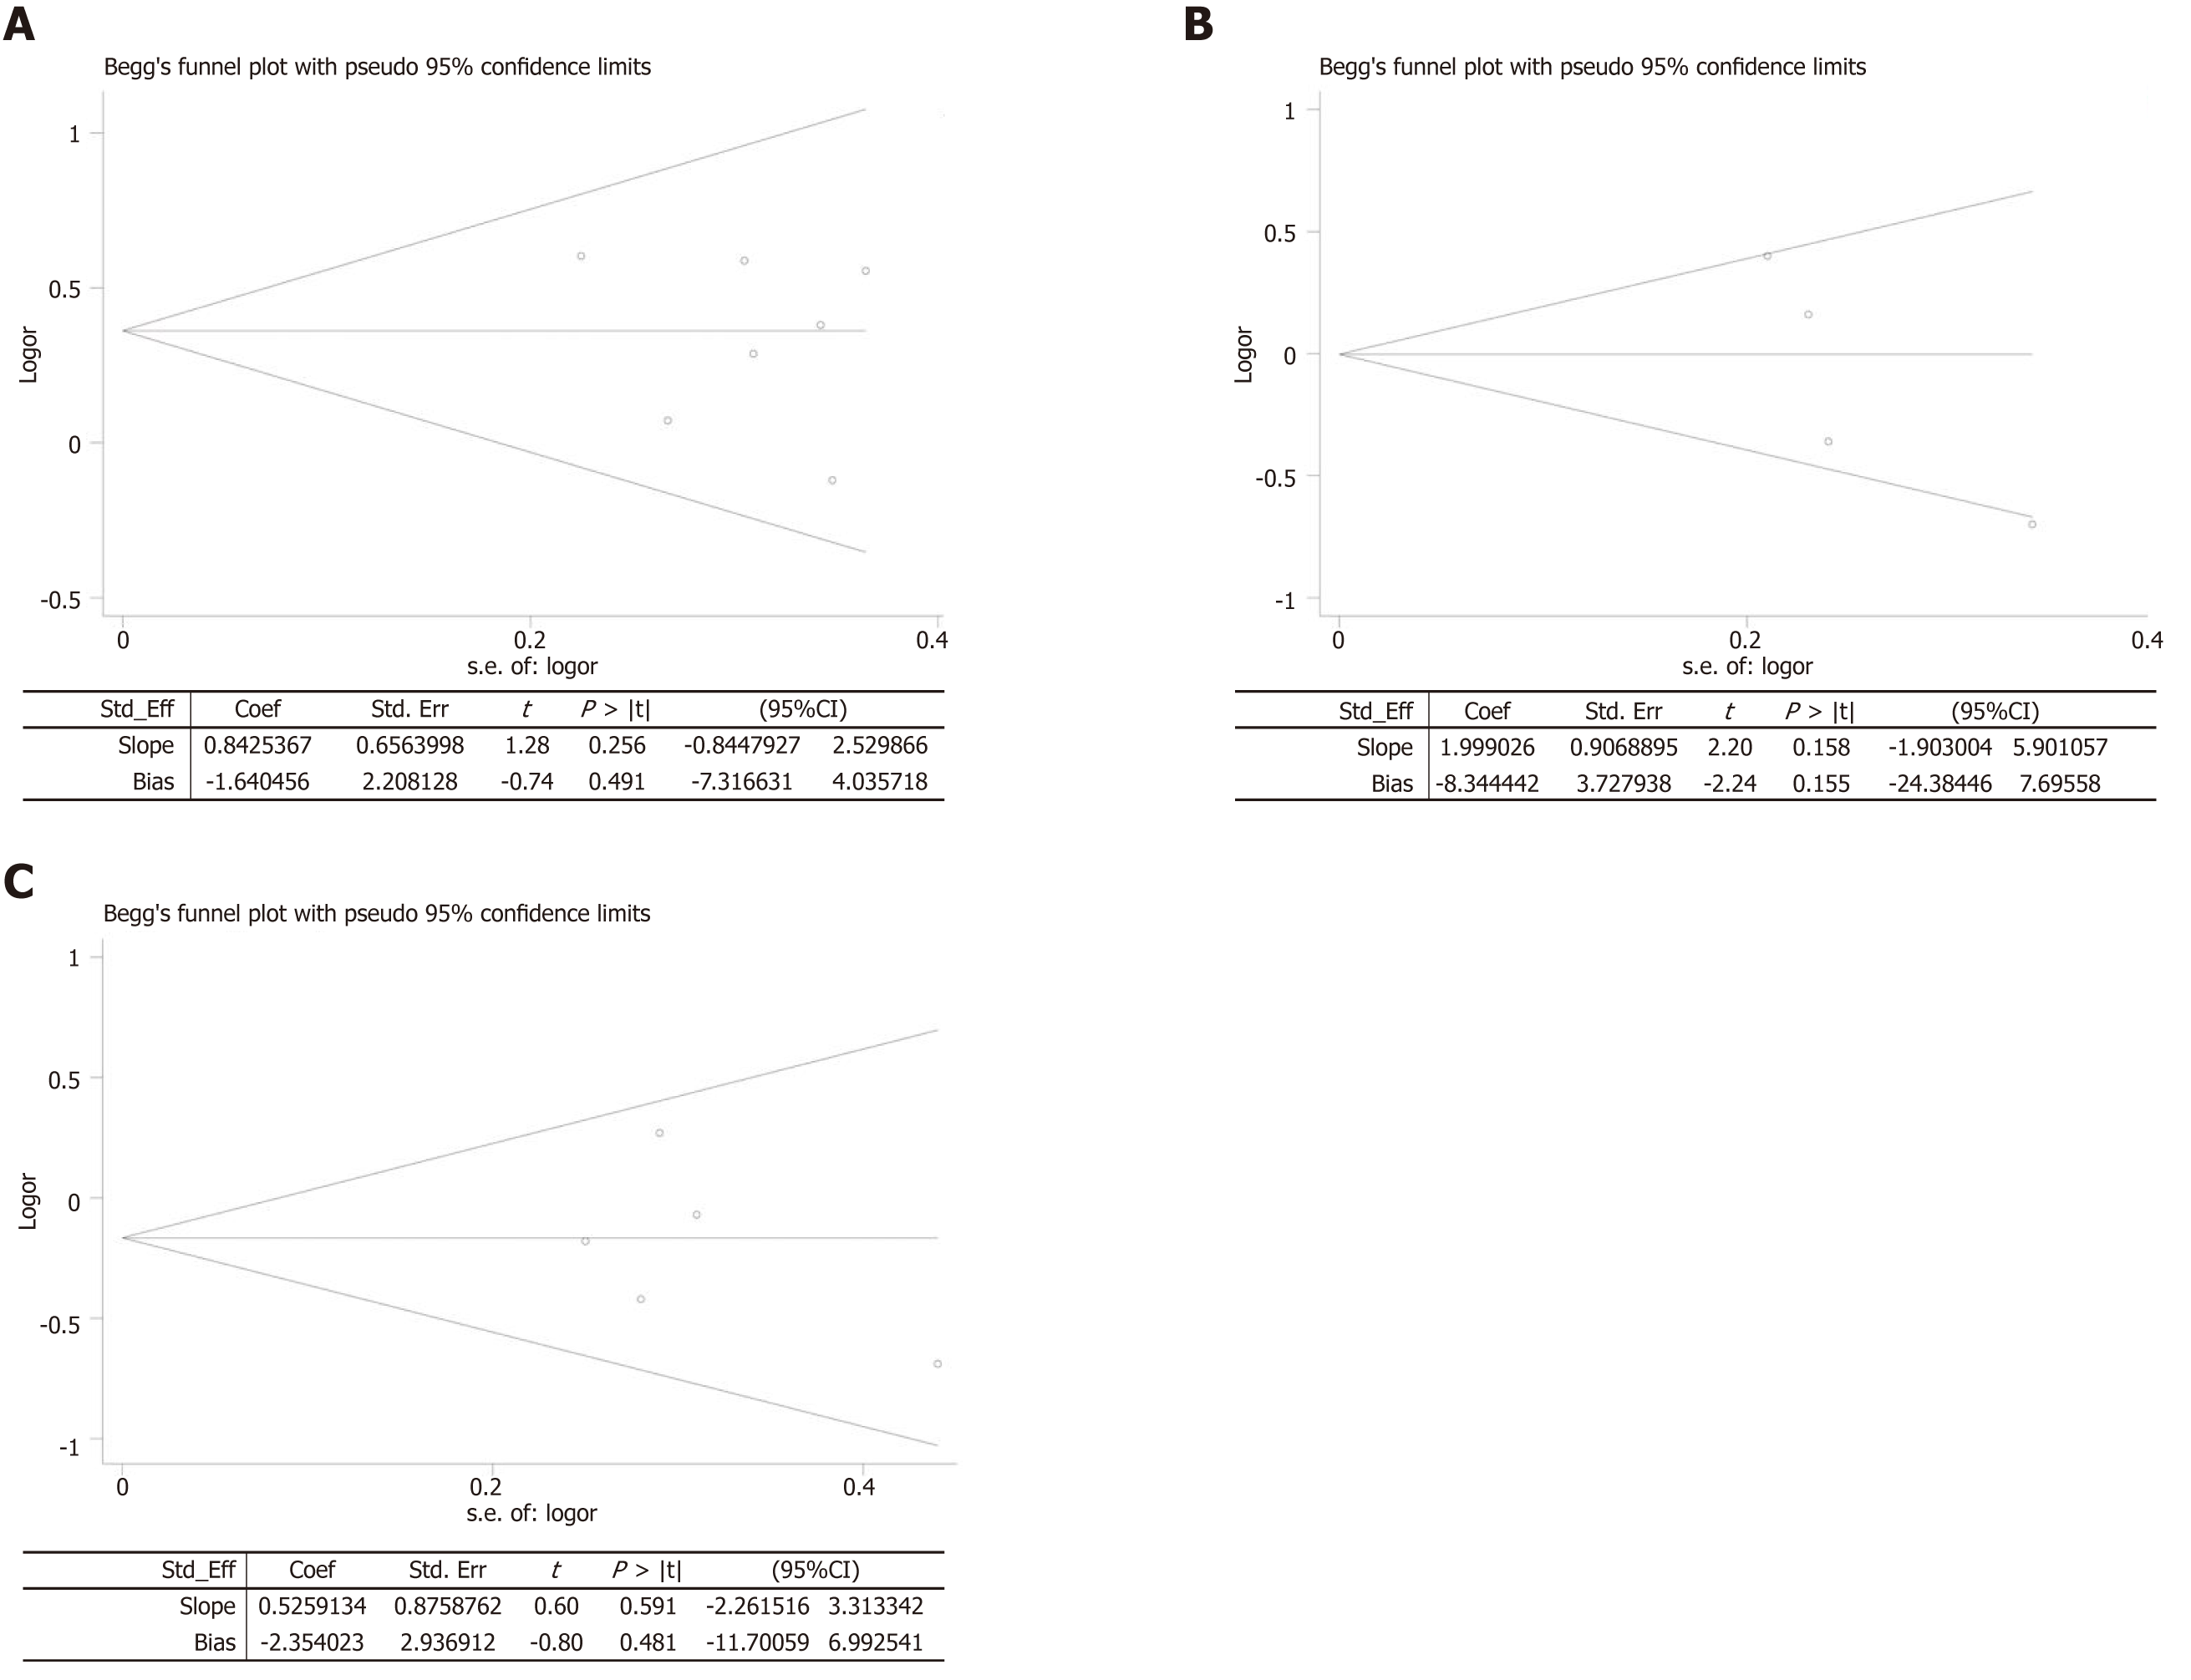
Figure 8 Begg’s and Egger’s tests for comparisons of objective response rate (A), progression-free survival (B), and overall survival (C).
- Citation: Li B, Chen L, Luo HL, Yi FM, Wei YP, Zhang WX. Docetaxel, cisplatin, and 5-fluorouracil compared with epirubicin, cisplatin, and 5-fluorouracil regimen for advanced gastric cancer: A systematic review and meta-analysis. World J Clin Cases 2019; 7(5): 600-615
- URL: https://www.wjgnet.com/2307-8960/full/v7/i5/600.htm
- DOI: https://dx.doi.org/10.12998/wjcc.v7.i5.600


