Copyright
©The Author(s) 2019.
World J Clin Cases. Mar 6, 2019; 7(5): 572-584
Published online Mar 6, 2019. doi: 10.12998/wjcc.v7.i5.572
Published online Mar 6, 2019. doi: 10.12998/wjcc.v7.i5.572
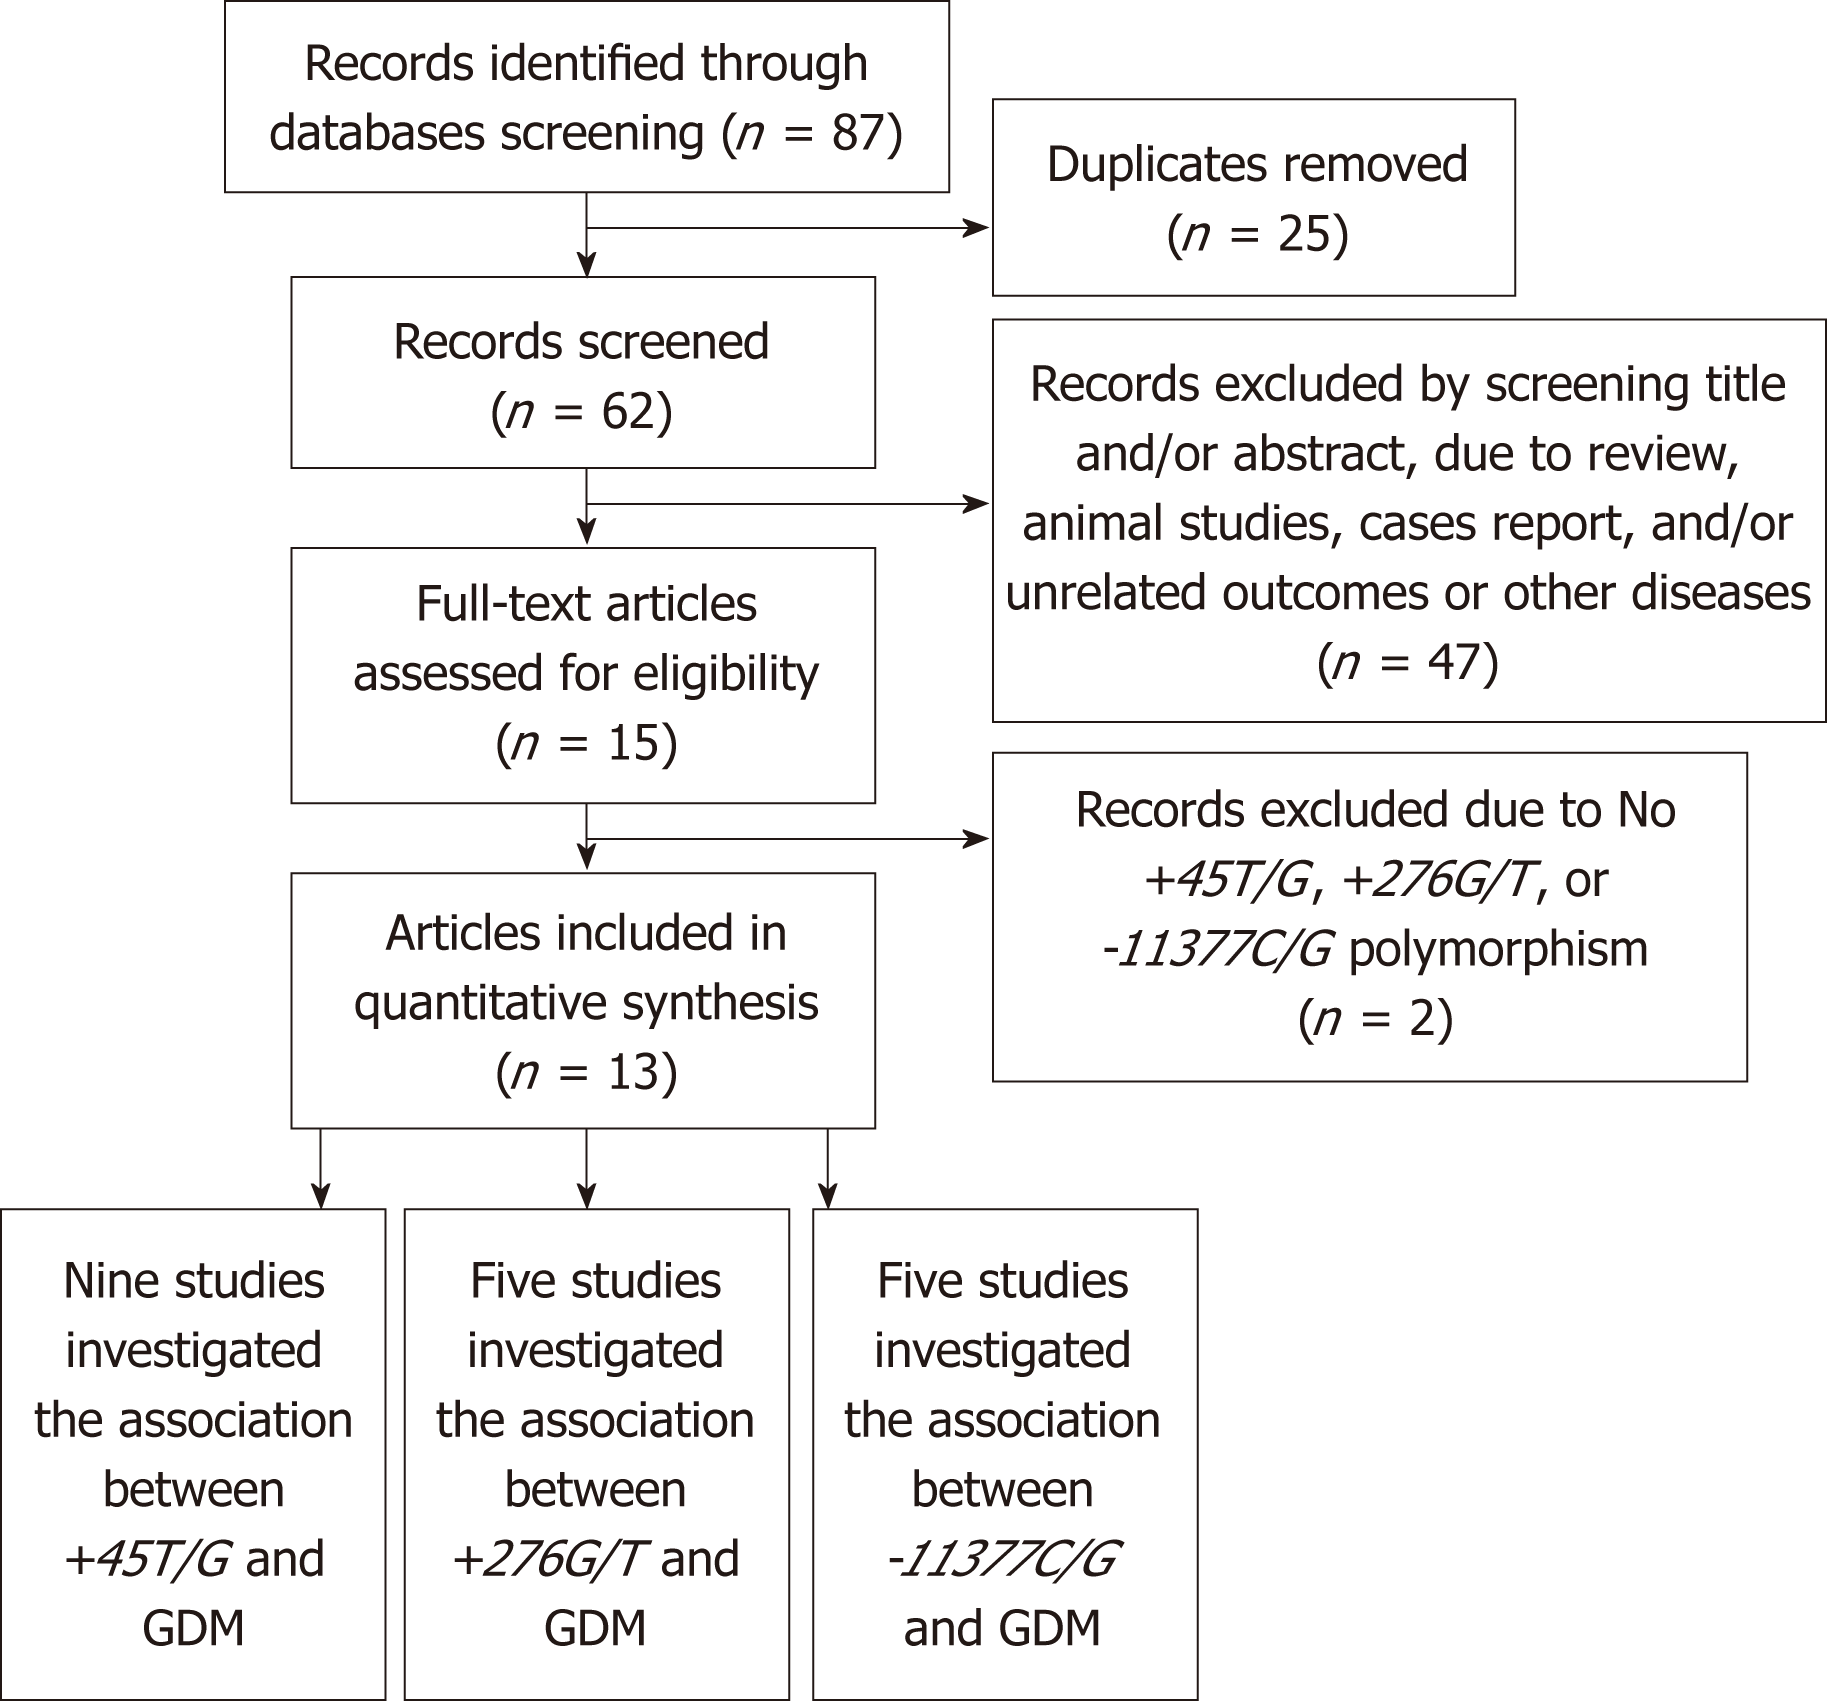
Figure 1 Flow diagram of study selection.
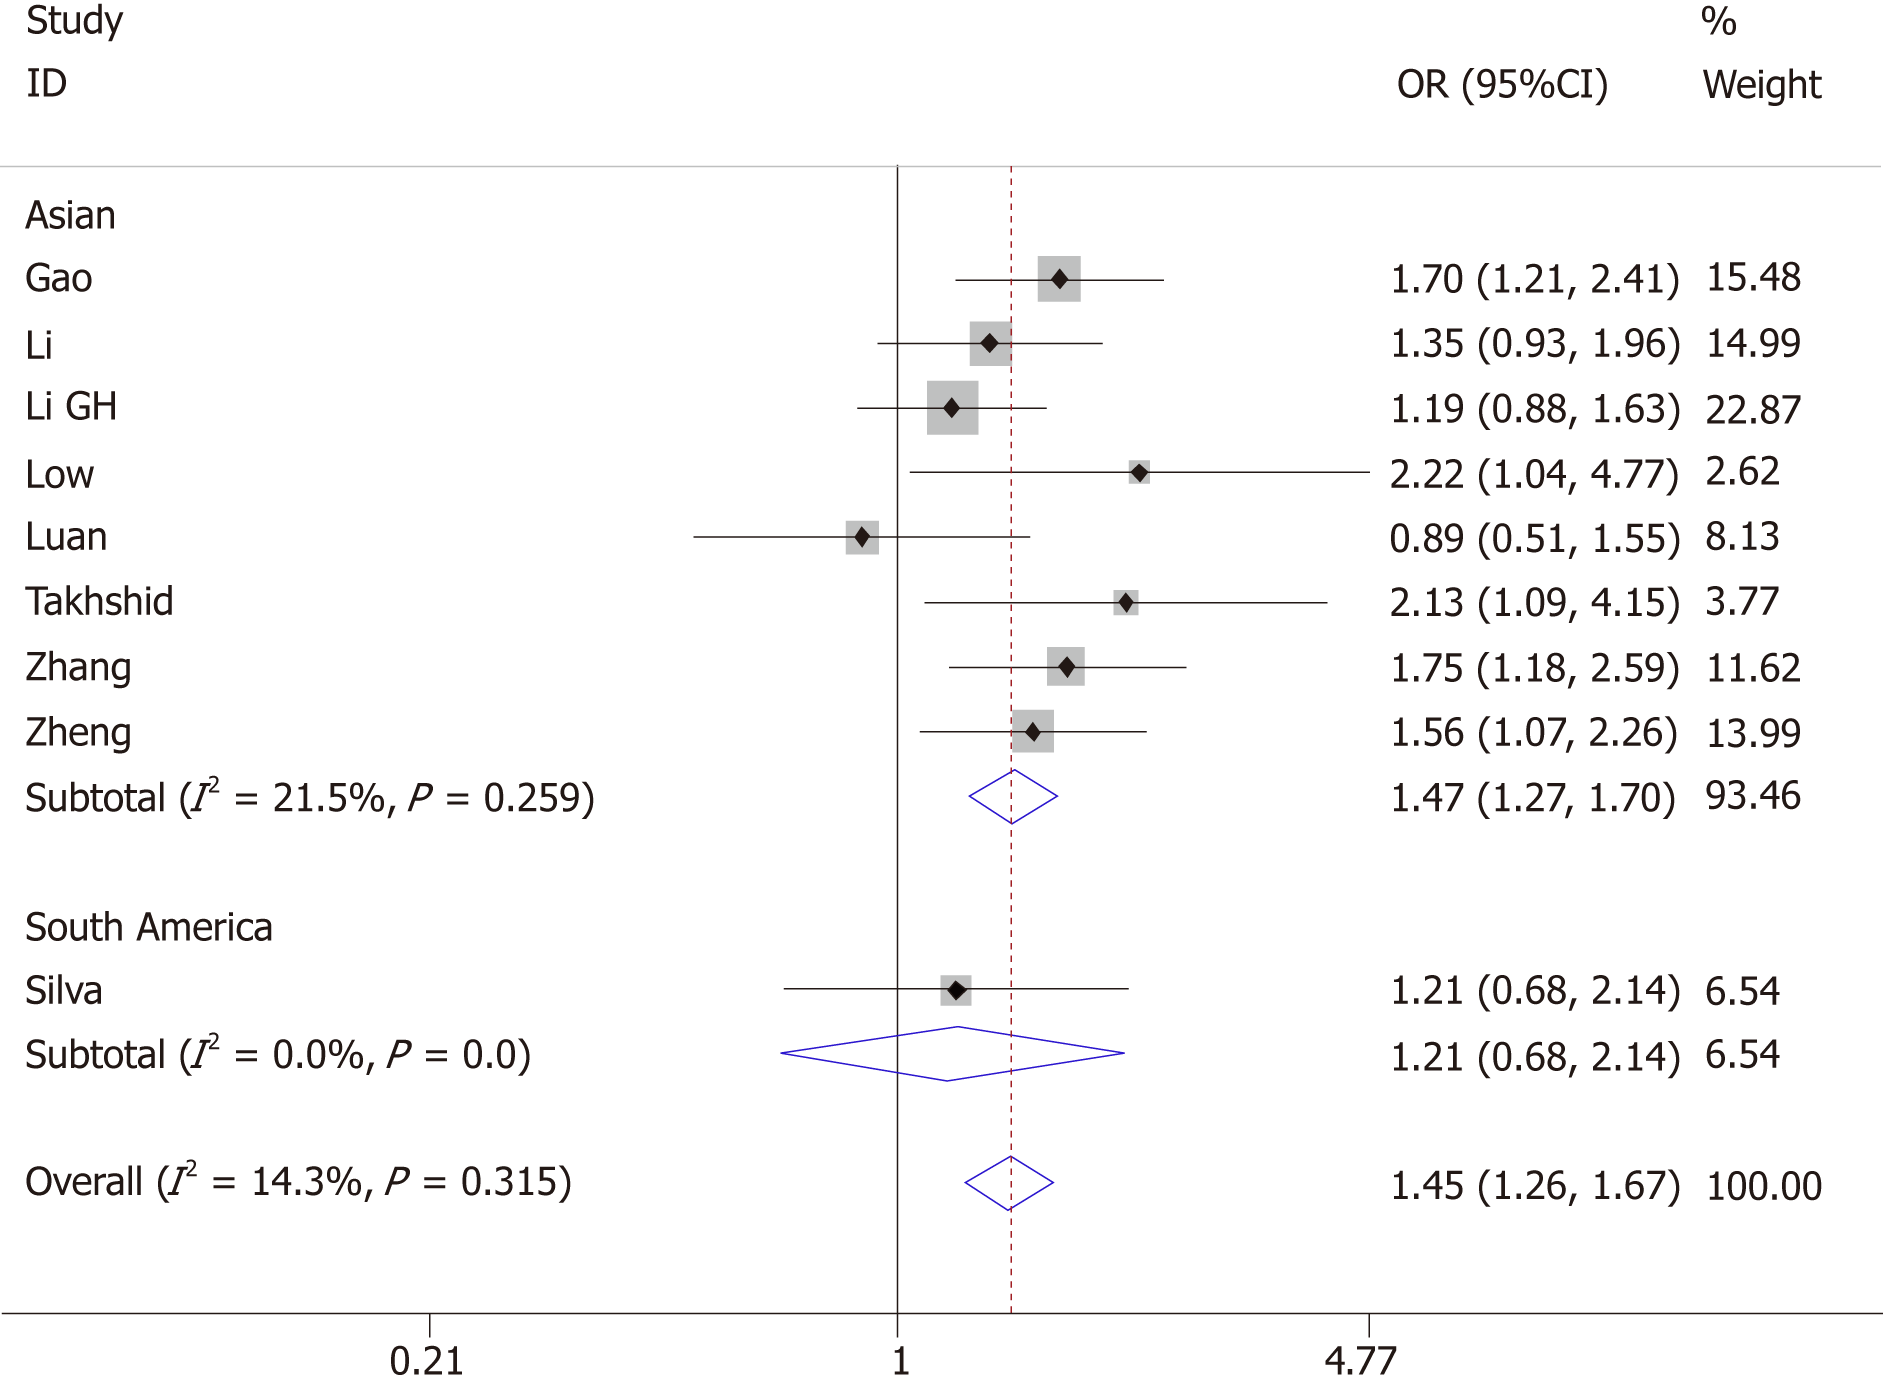
Figure 2 Forest plot for the association of ADIPOQ +45T/G polymorphism and gestational diabetes mellitus under the allelic model.
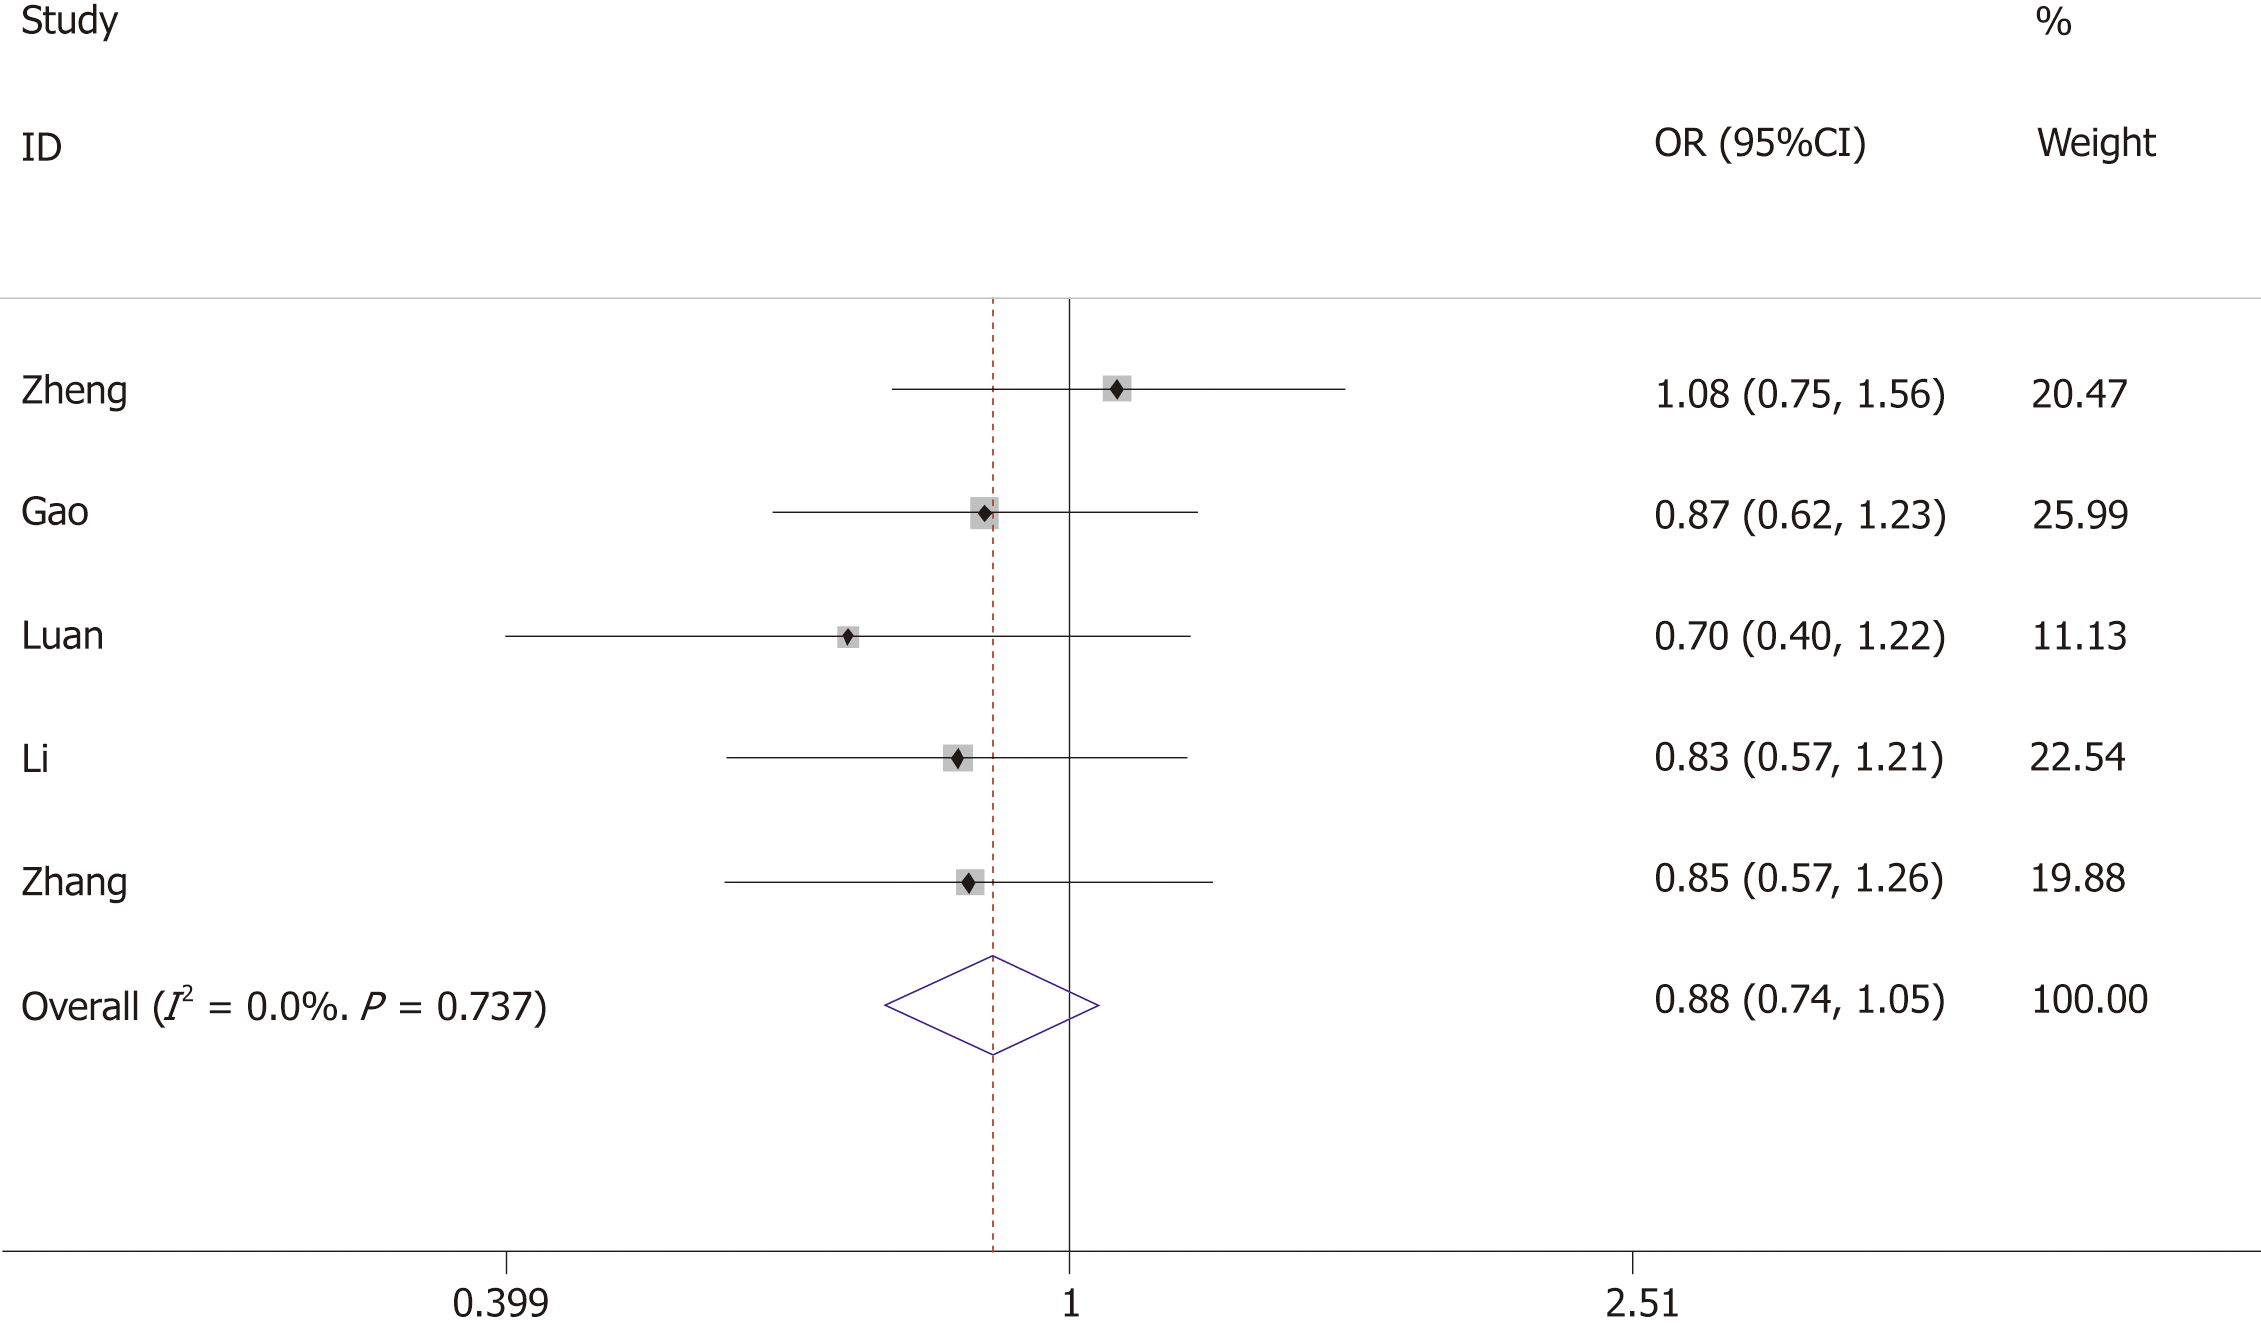
Figure 3 Forest plot for the association of ADIPOQ +276G/T polymorphism and gestational diabetes mellitus under the allelic model.
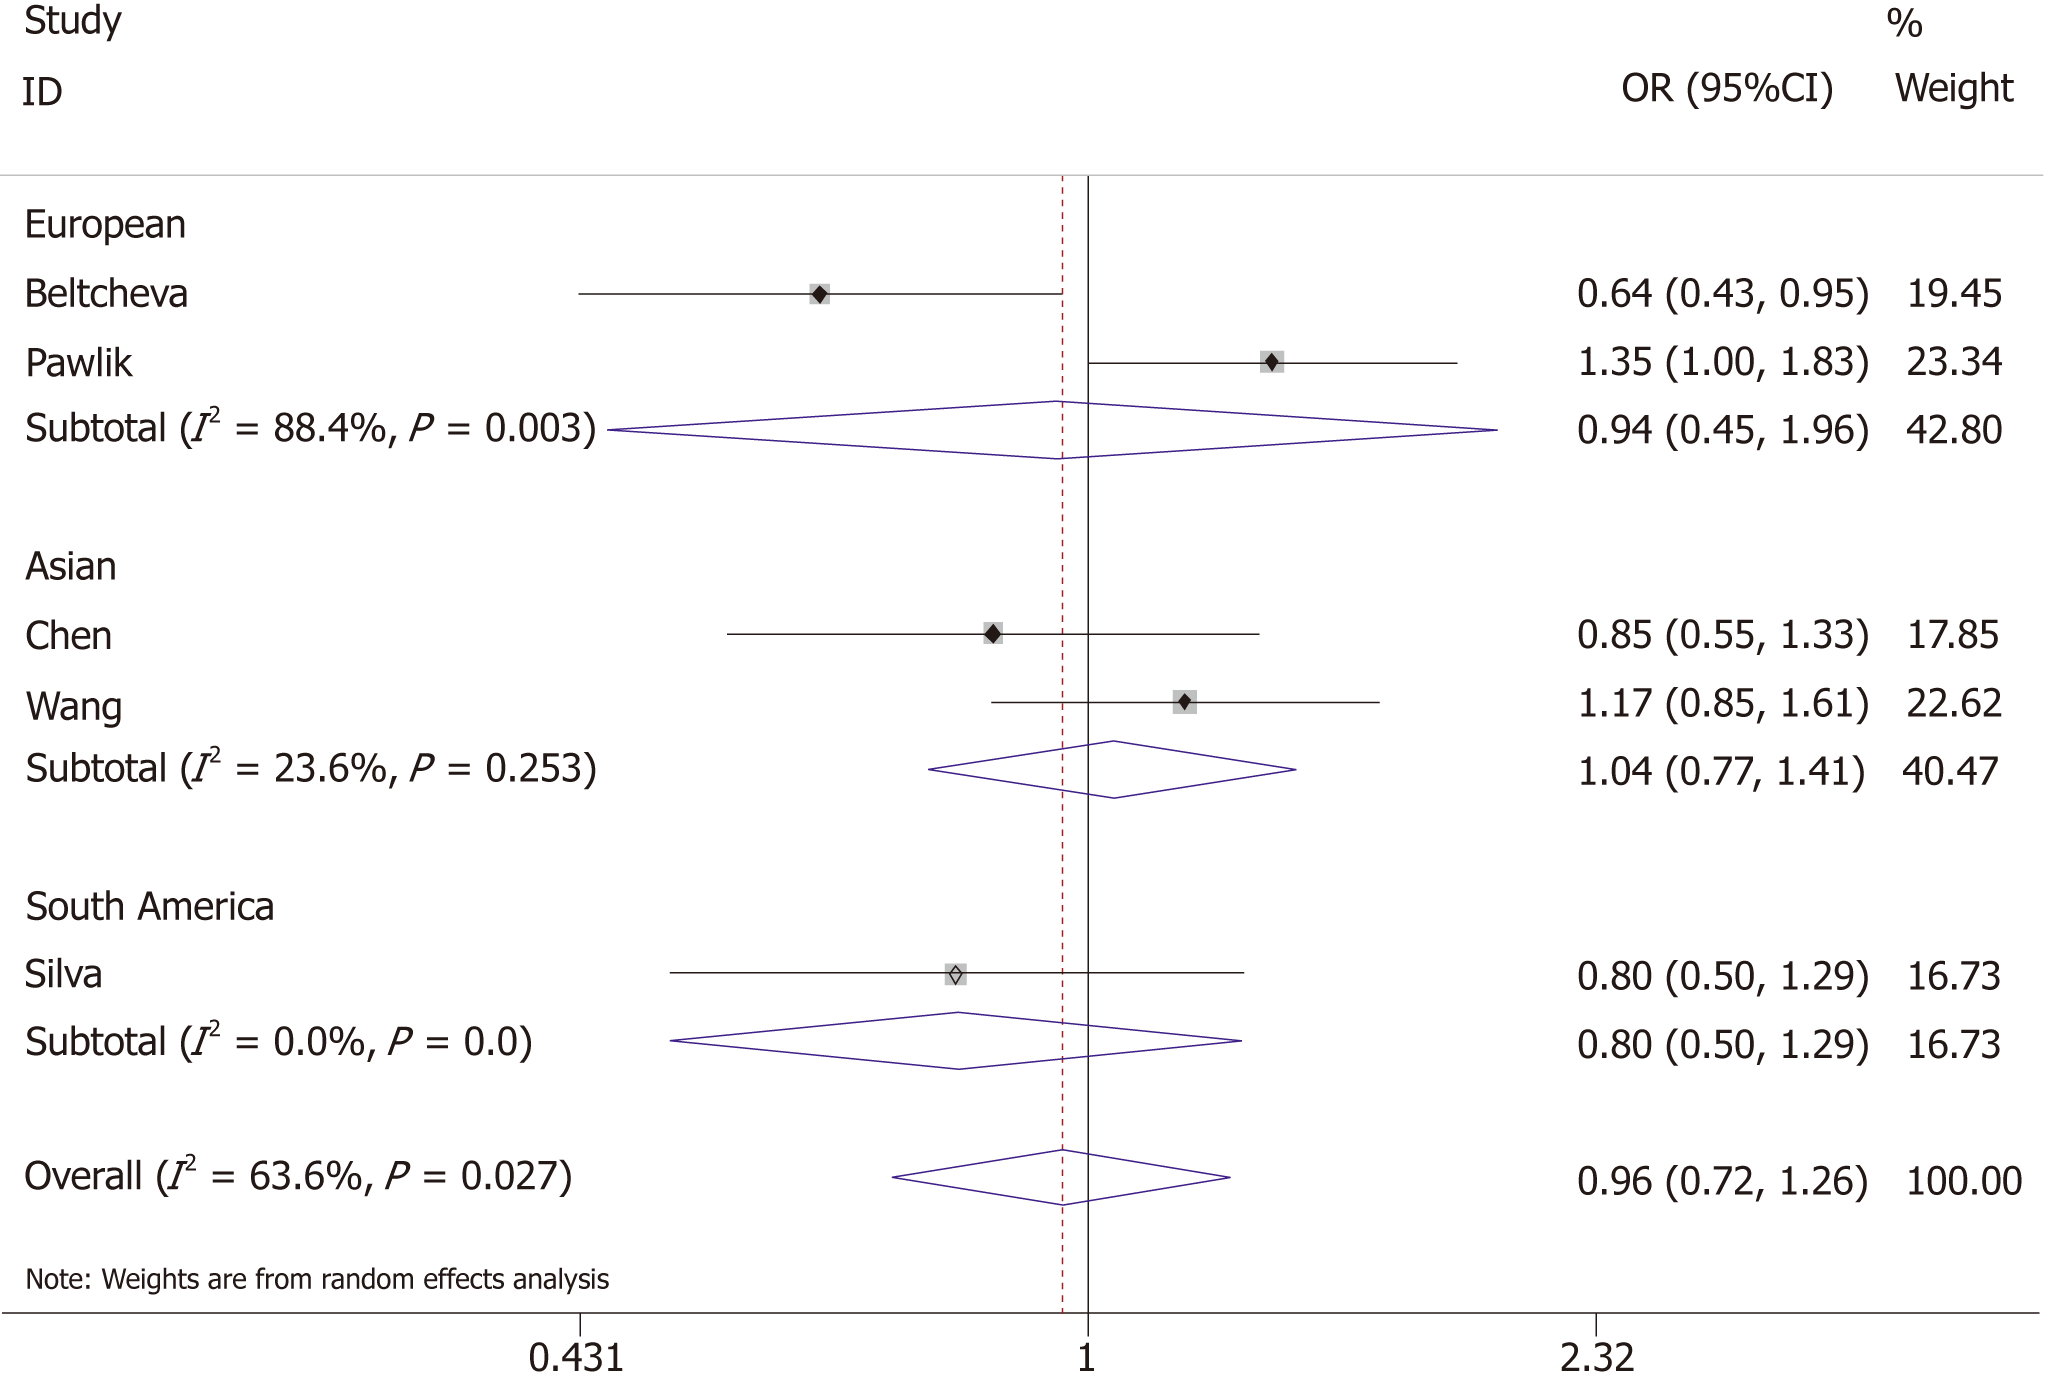
Figure 4 Forest plot for the association of ADIPOQ -11377C/G polymorphism and gestational diabetes mellitus under the allelic model.
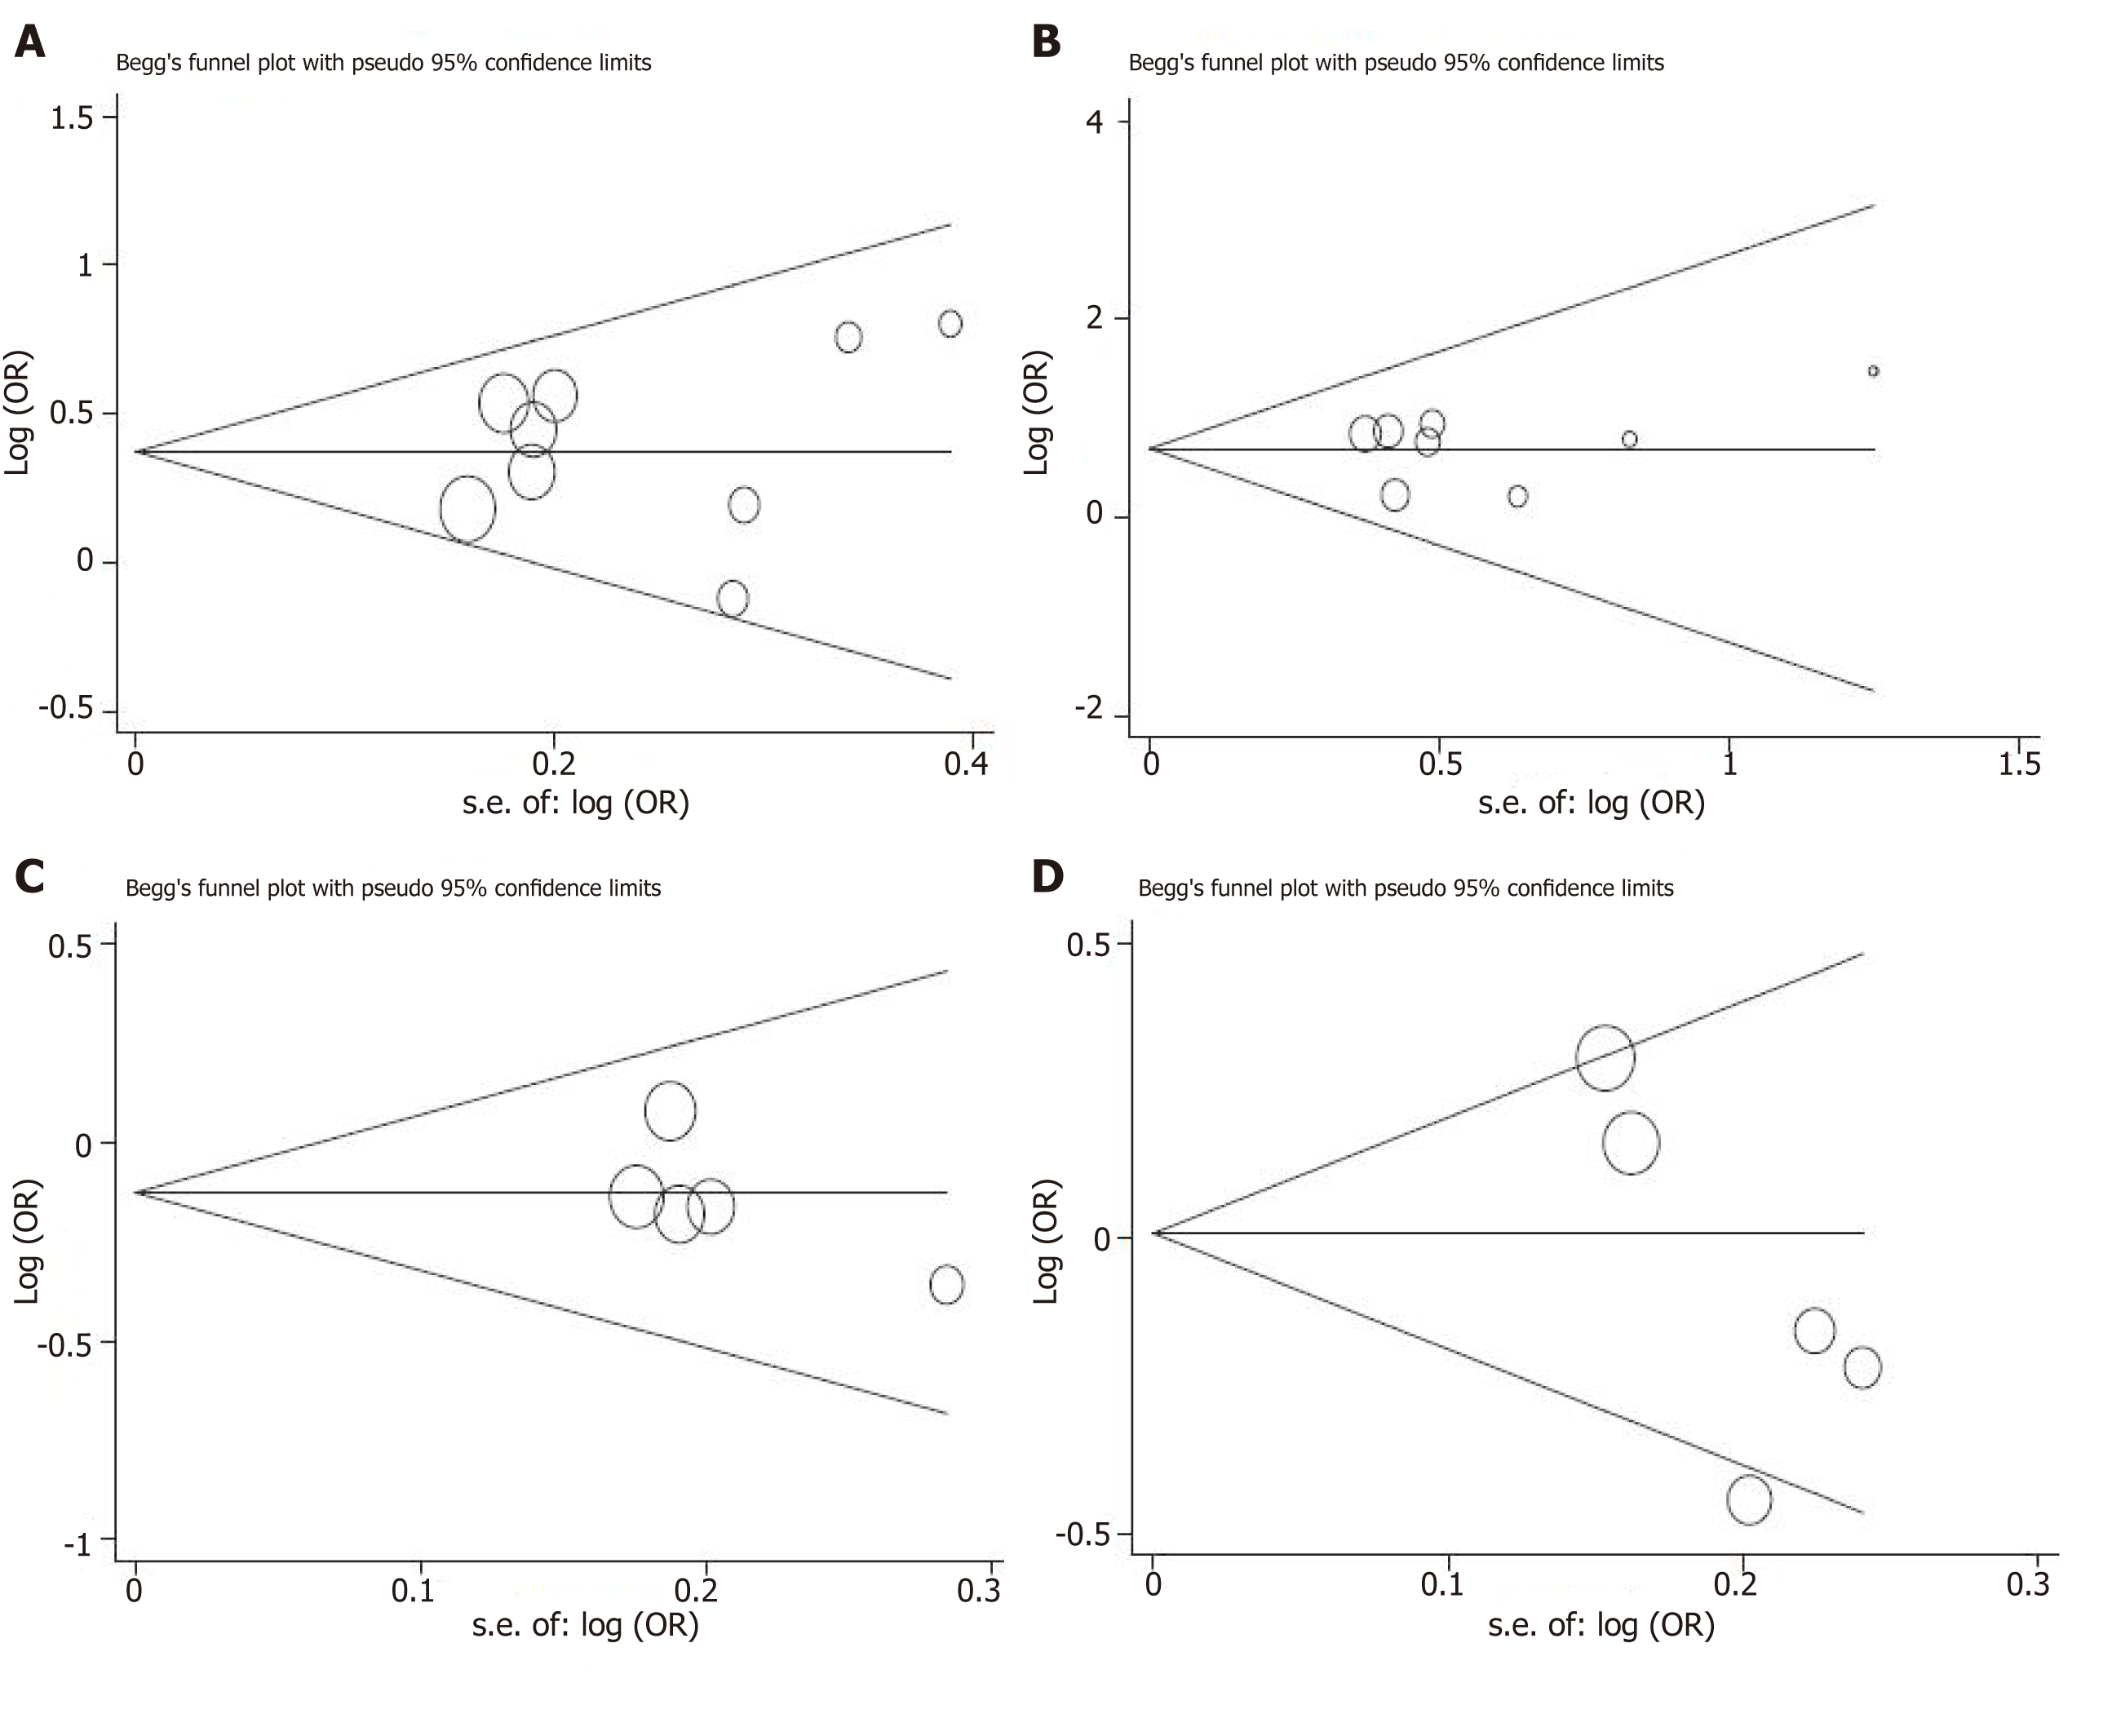
Figure 5 Begg’s funnel plots for testing publication bias.
A: +45T/G under allelic model; B: +45T/G under recessive model; C: +276G/T under allelic model; D: -11377C/G under allelic model. OR: Odds ratio.
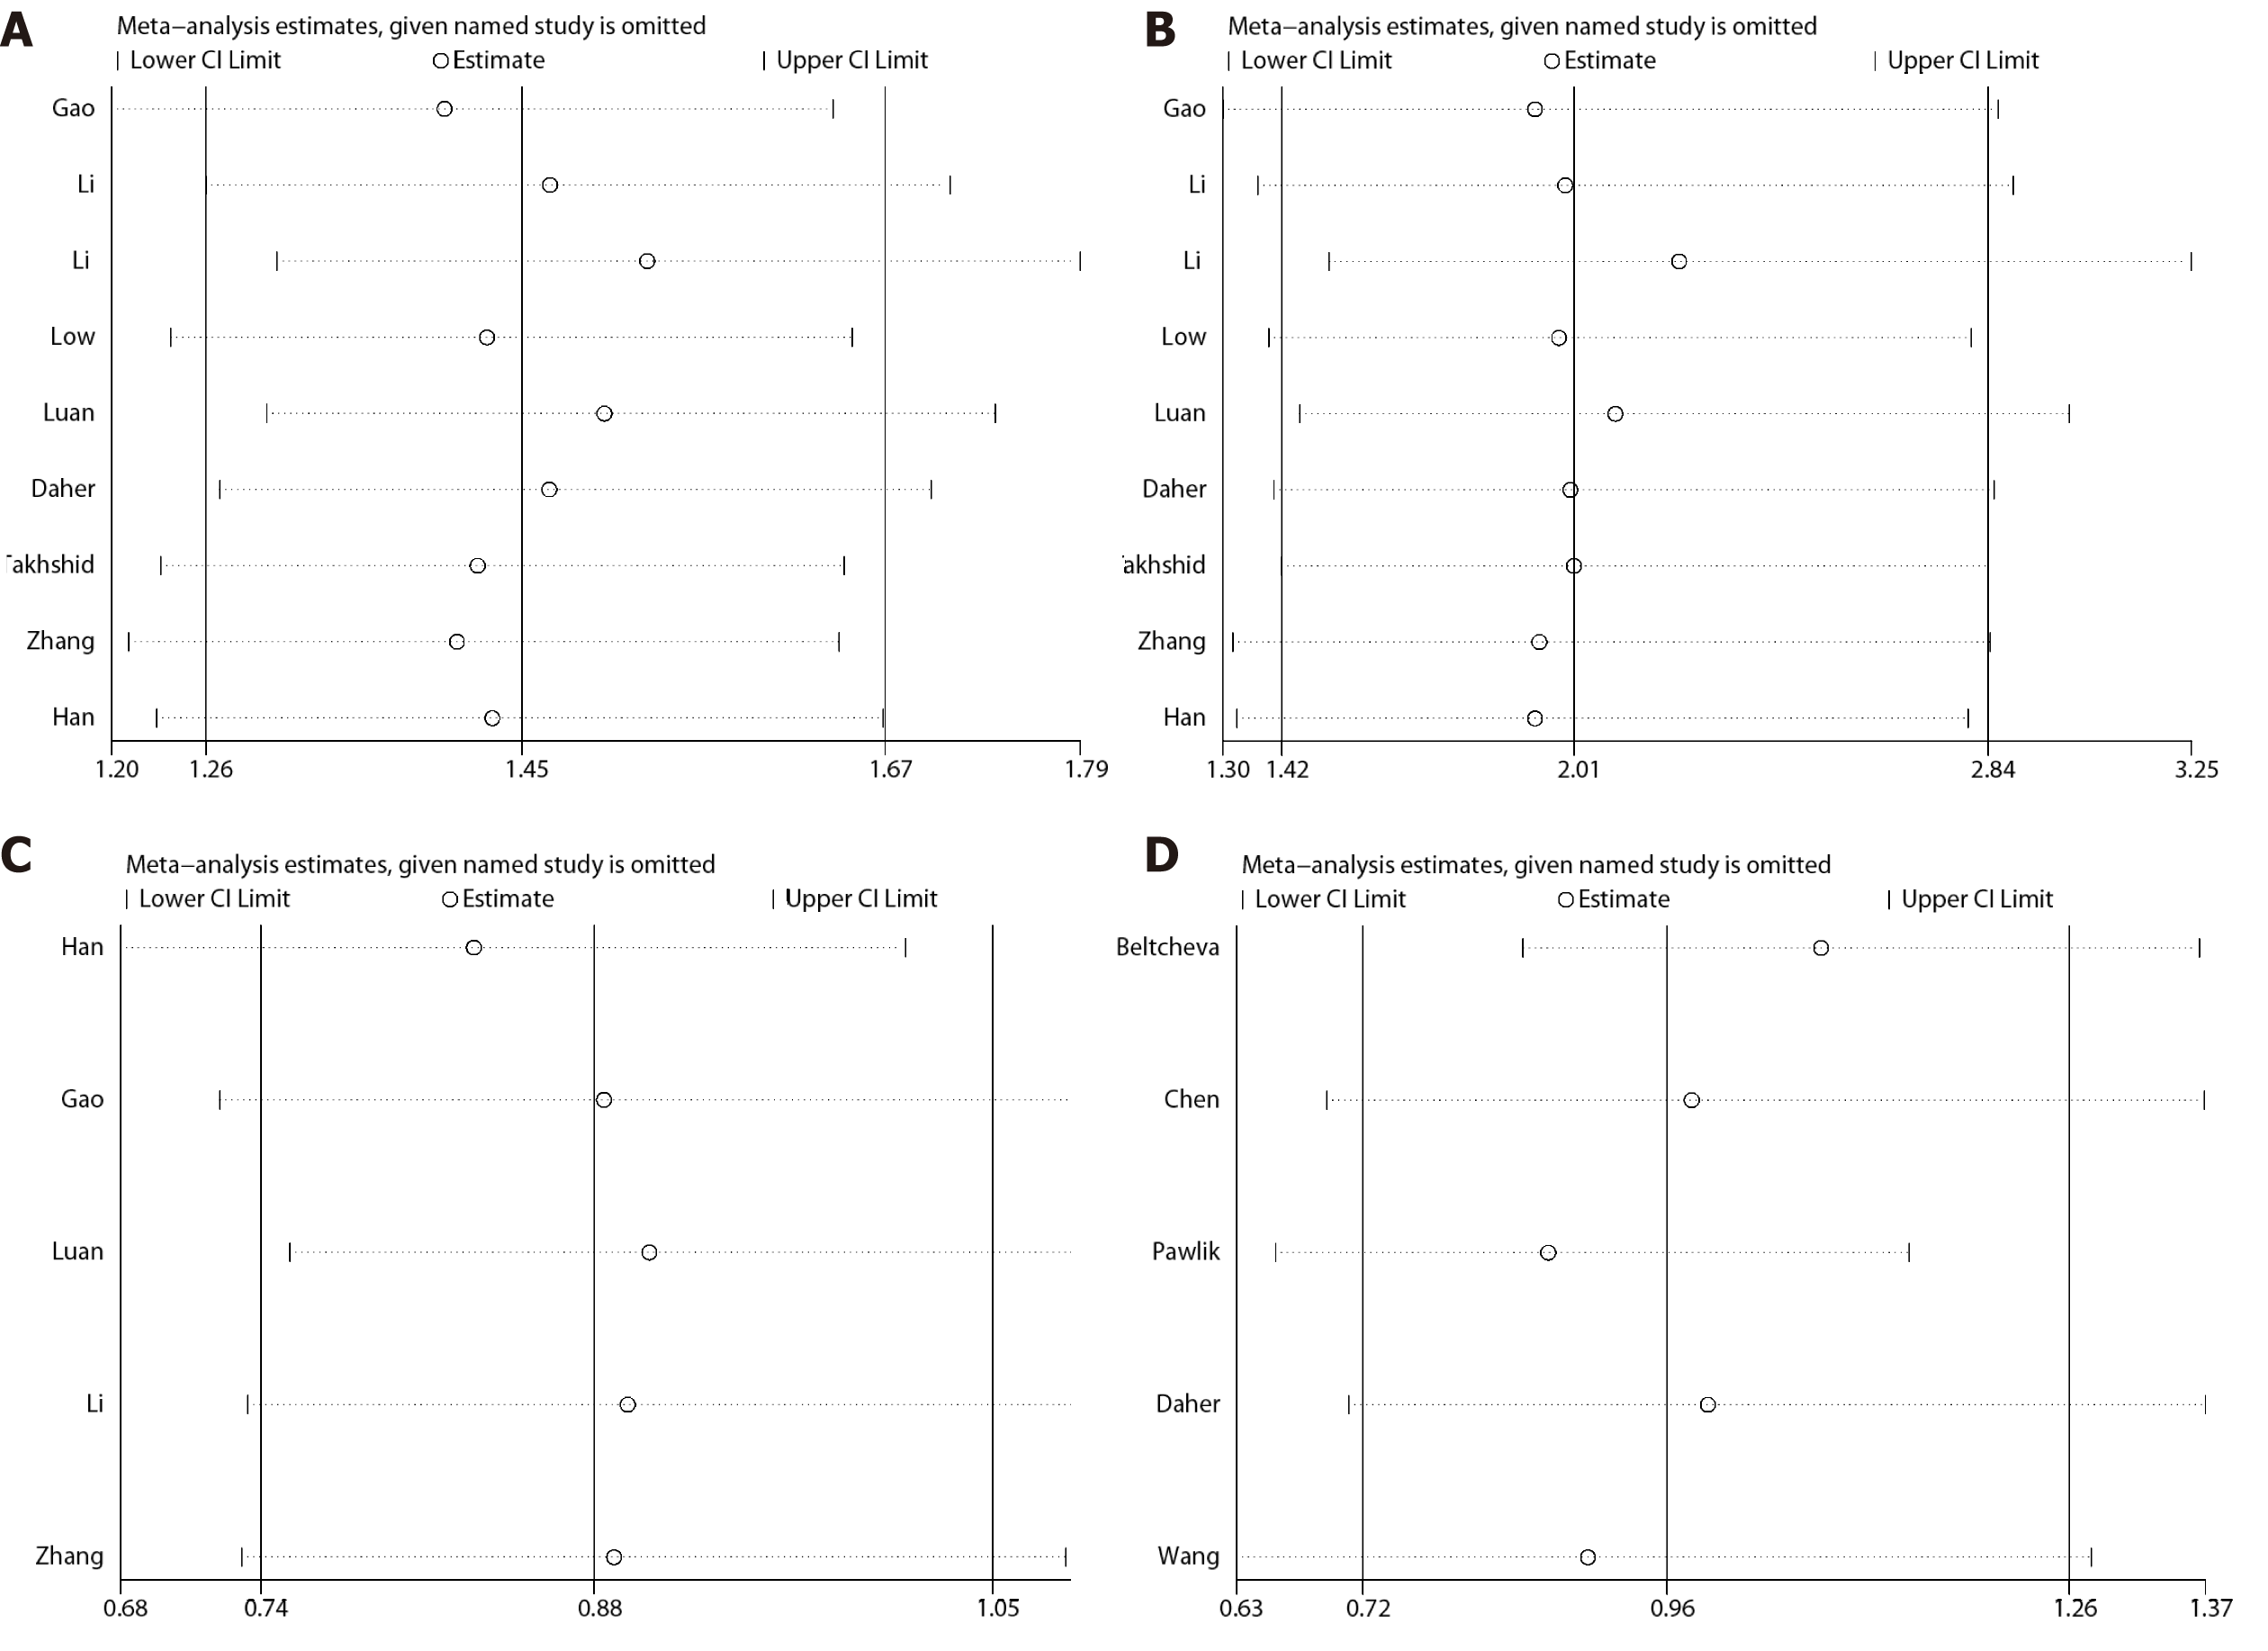
Figure 6 Sensitivity analysis between ADPIOQ polymorphisms and gestational diabetes mellitus in all studies.
A: +45T/G under allelic model; B: +45T/G under recessive model; C: +276G/T under allelic model; D: -11377C/G under allelic model. CI: Confidence interval.
- Citation: Huang LT, Wu SL, Liao X, Ma SJ, Tan HZ. Adiponectin gene polymorphisms and risk of gestational diabetes mellitus: A meta-analysis. World J Clin Cases 2019; 7(5): 572-584
- URL: https://www.wjgnet.com/2307-8960/full/v7/i5/572.htm
- DOI: https://dx.doi.org/10.12998/wjcc.v7.i5.572


