















Copyright: ©Author(s) 2026.
World J Clin Cases. Jun 6, 2026; 14(16): 119700
Published online Jun 6, 2026. doi: 10.12998/wjcc.v14.i16.119700
Published online Jun 6, 2026. doi: 10.12998/wjcc.v14.i16.119700
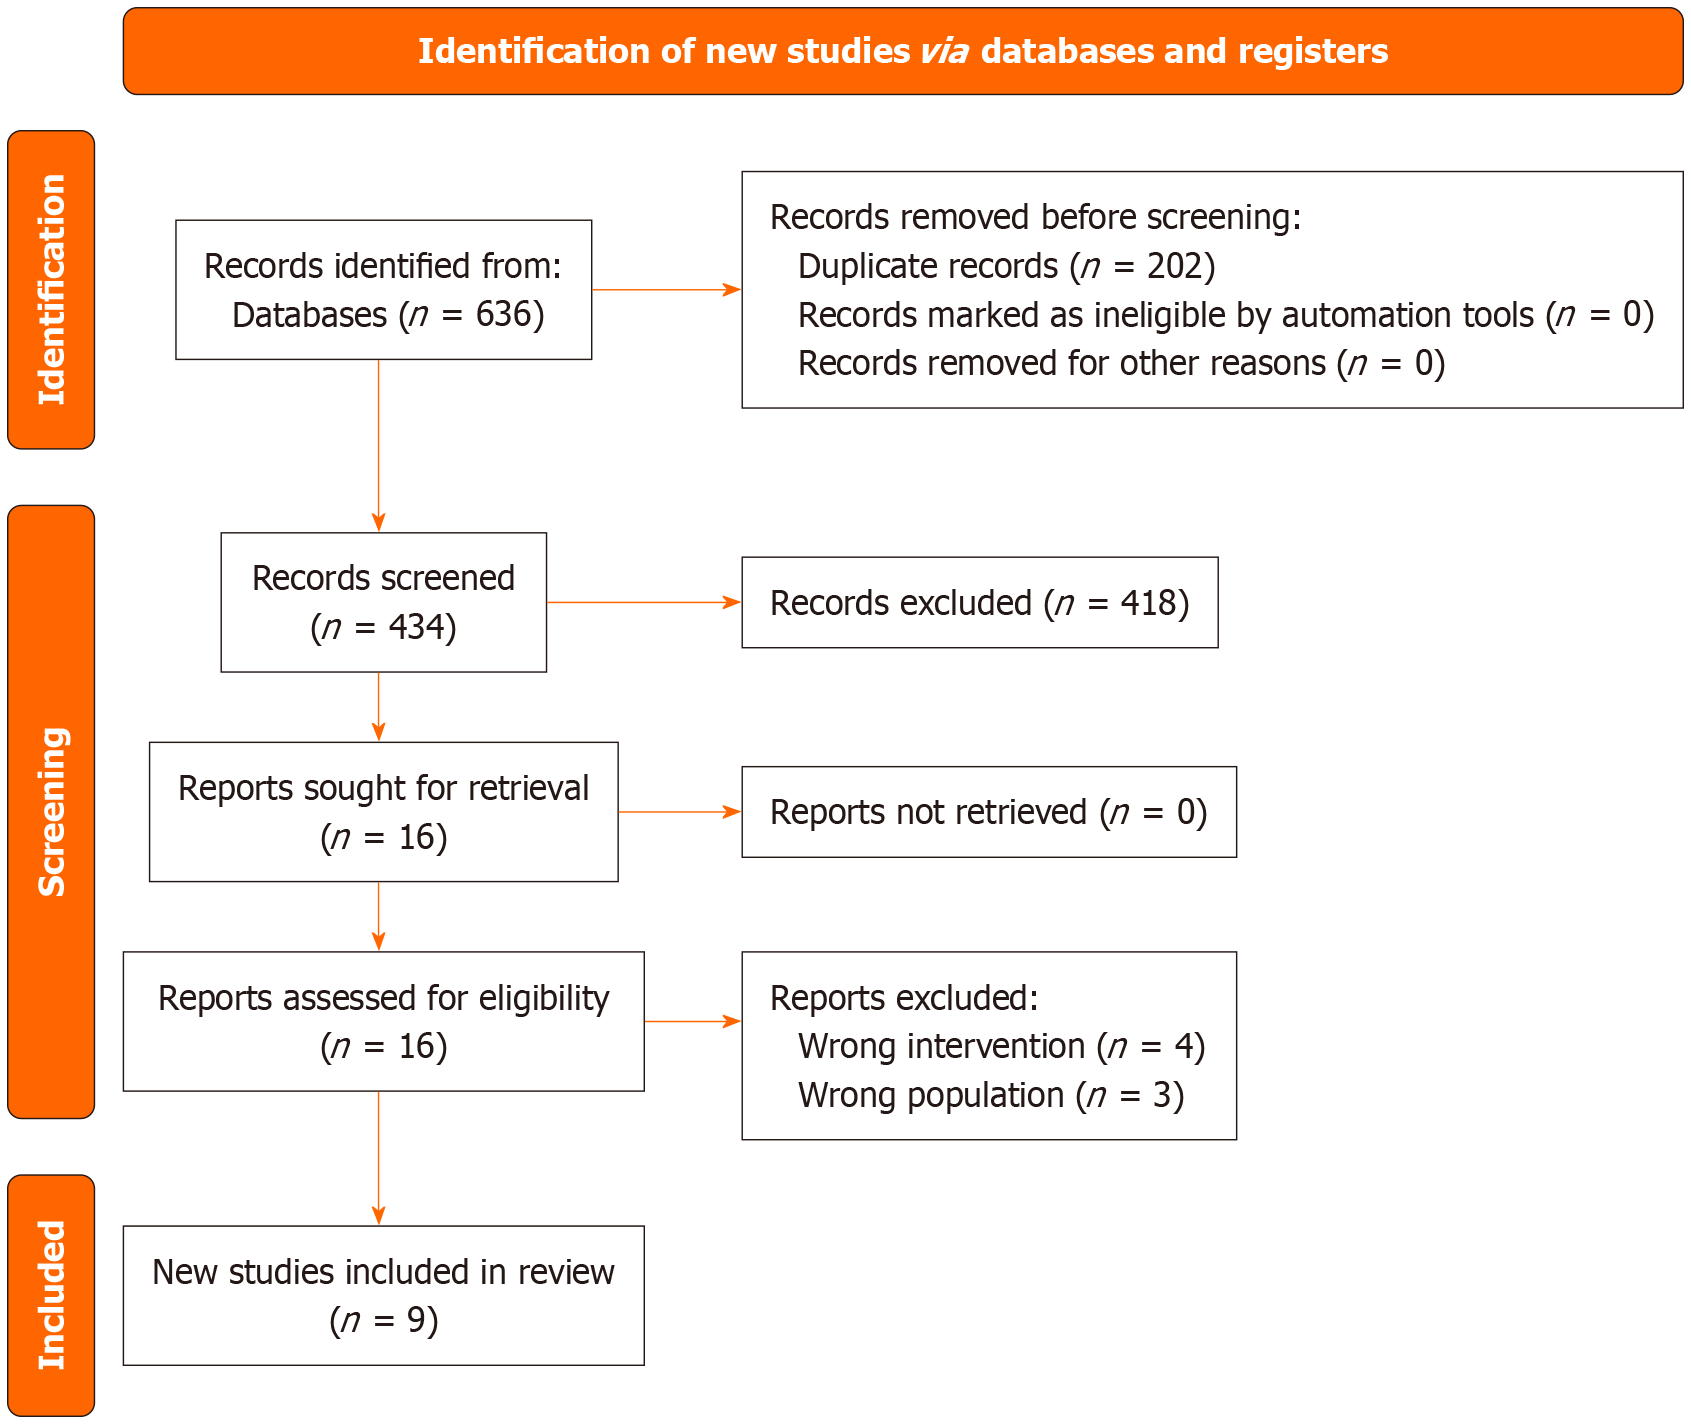
Figure 1
PRISMA flow diagram illustrating the study selection process.
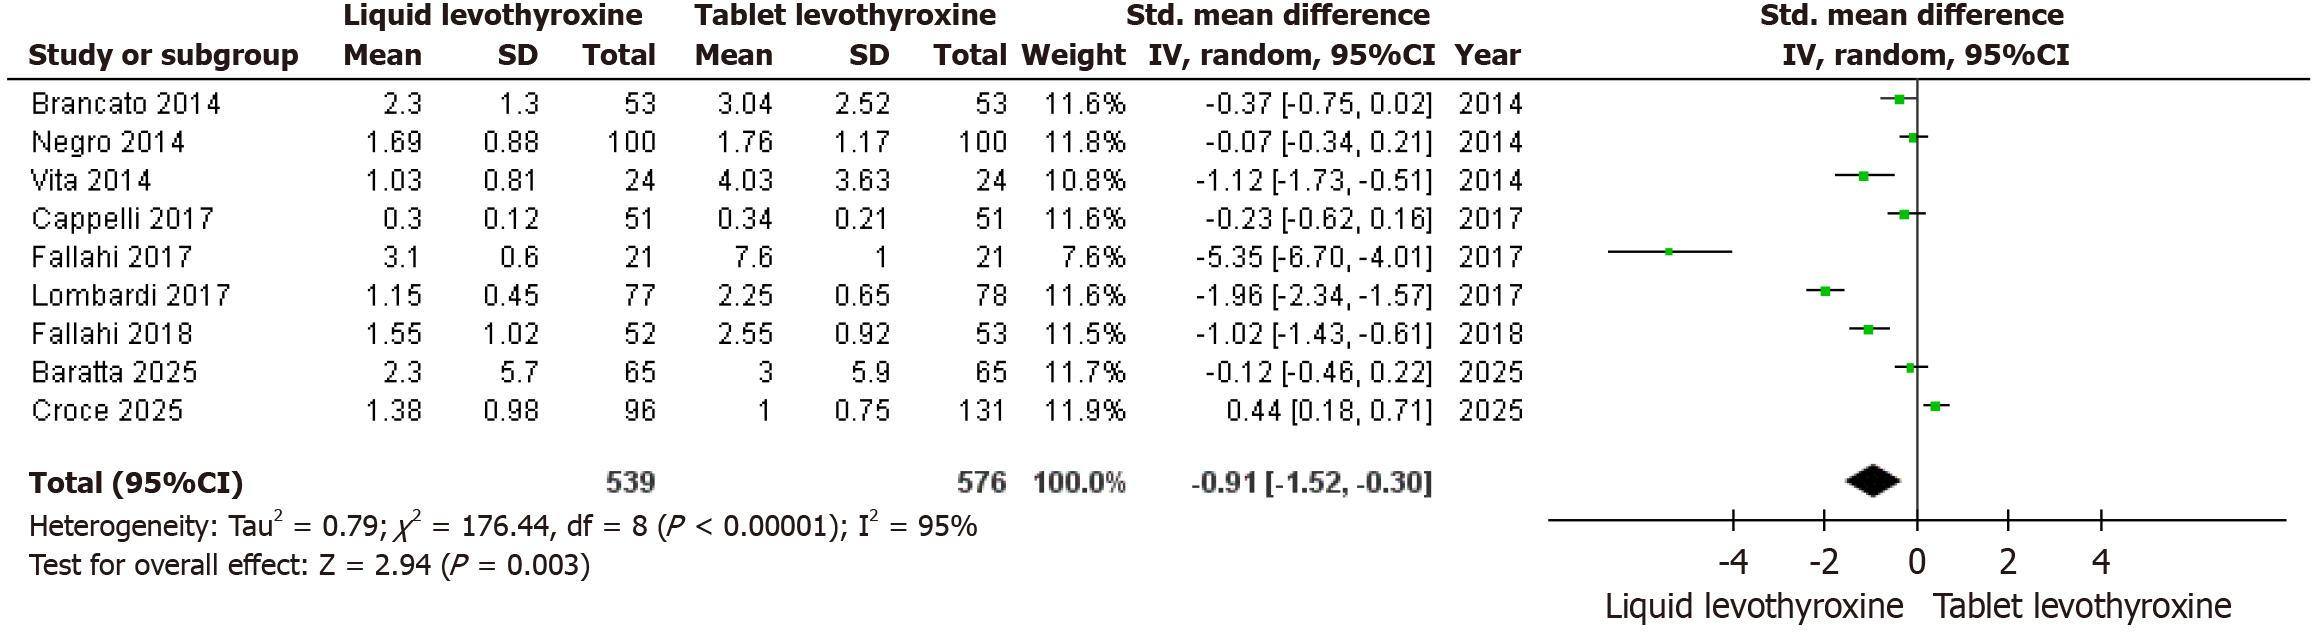
Figure 2 Forest plot comparing thyroid-stimulating hormone levels between liquid or soft-gel and tablet levothyroxine in all included studies.
CI: Confidence interval.
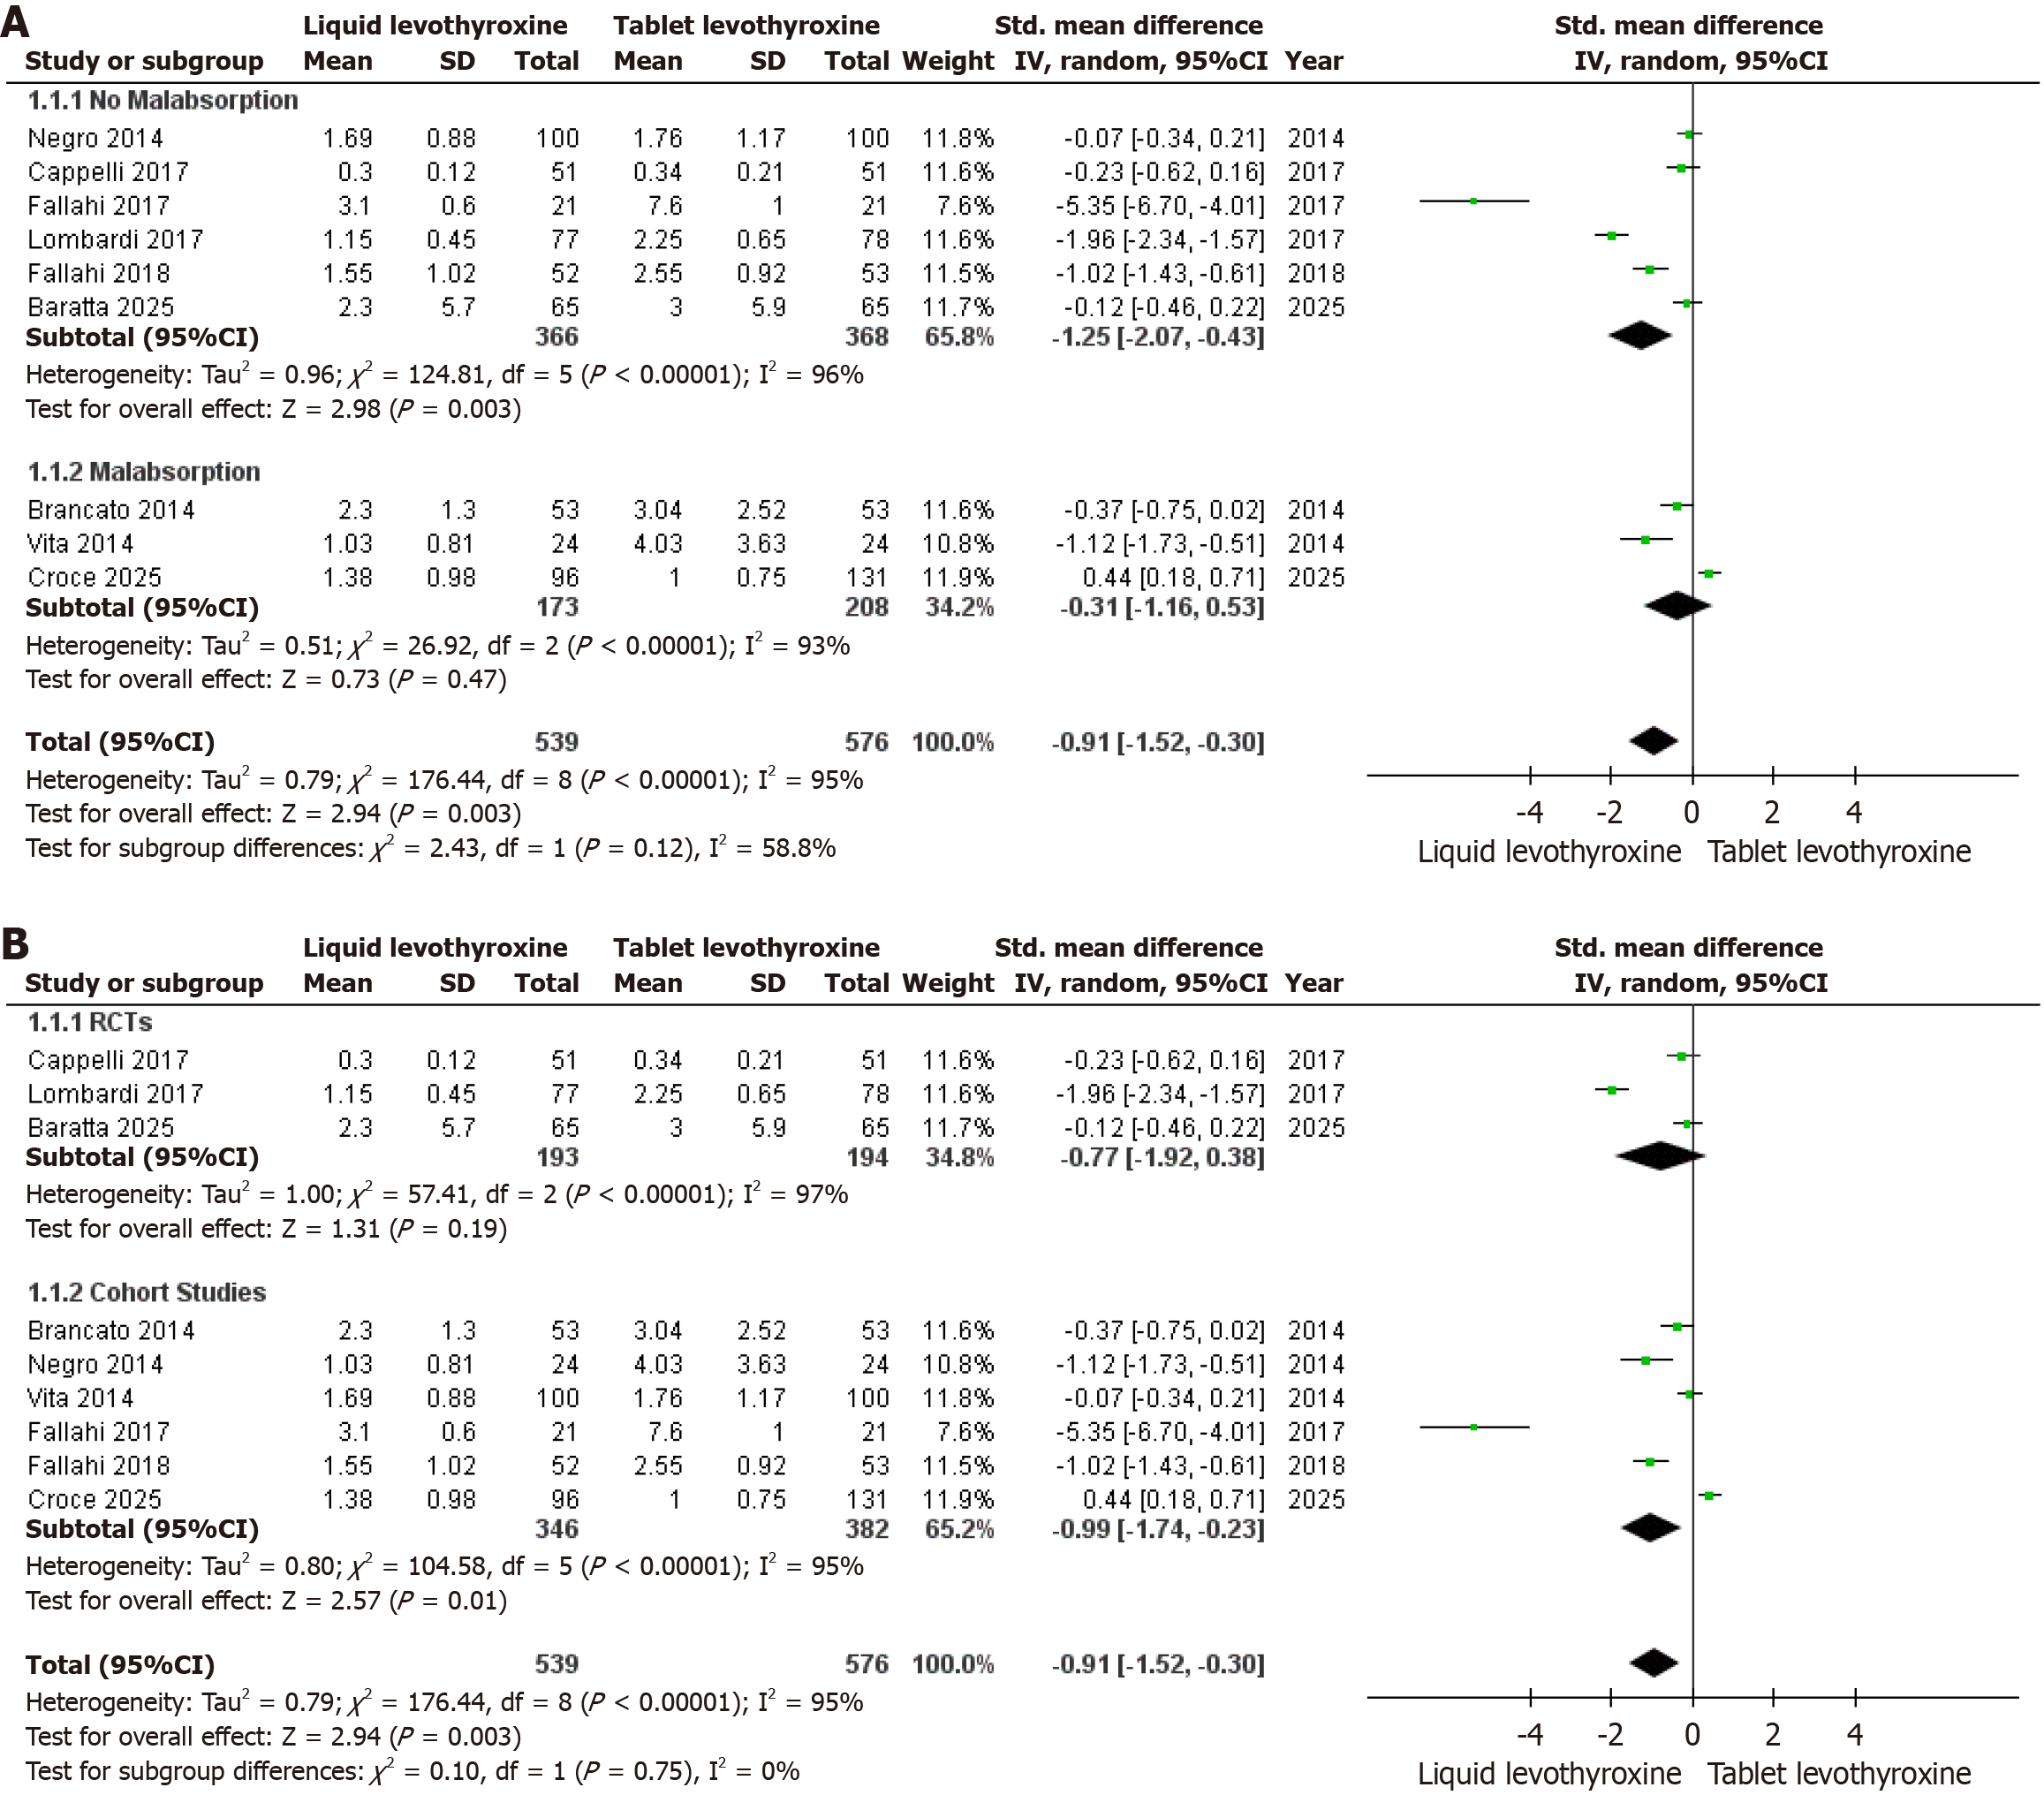
Figure 3 Subgroup analysis of thyroid-stimulating hormone levels.
A: Subgroup analysis of thyroid-stimulating hormone levels according to malabsorption status; B: Subgroup analysis of thyroid-stimulating hormone levels according to study design (randomized controlled trials vs cohort studies). CI: Confidence interval.
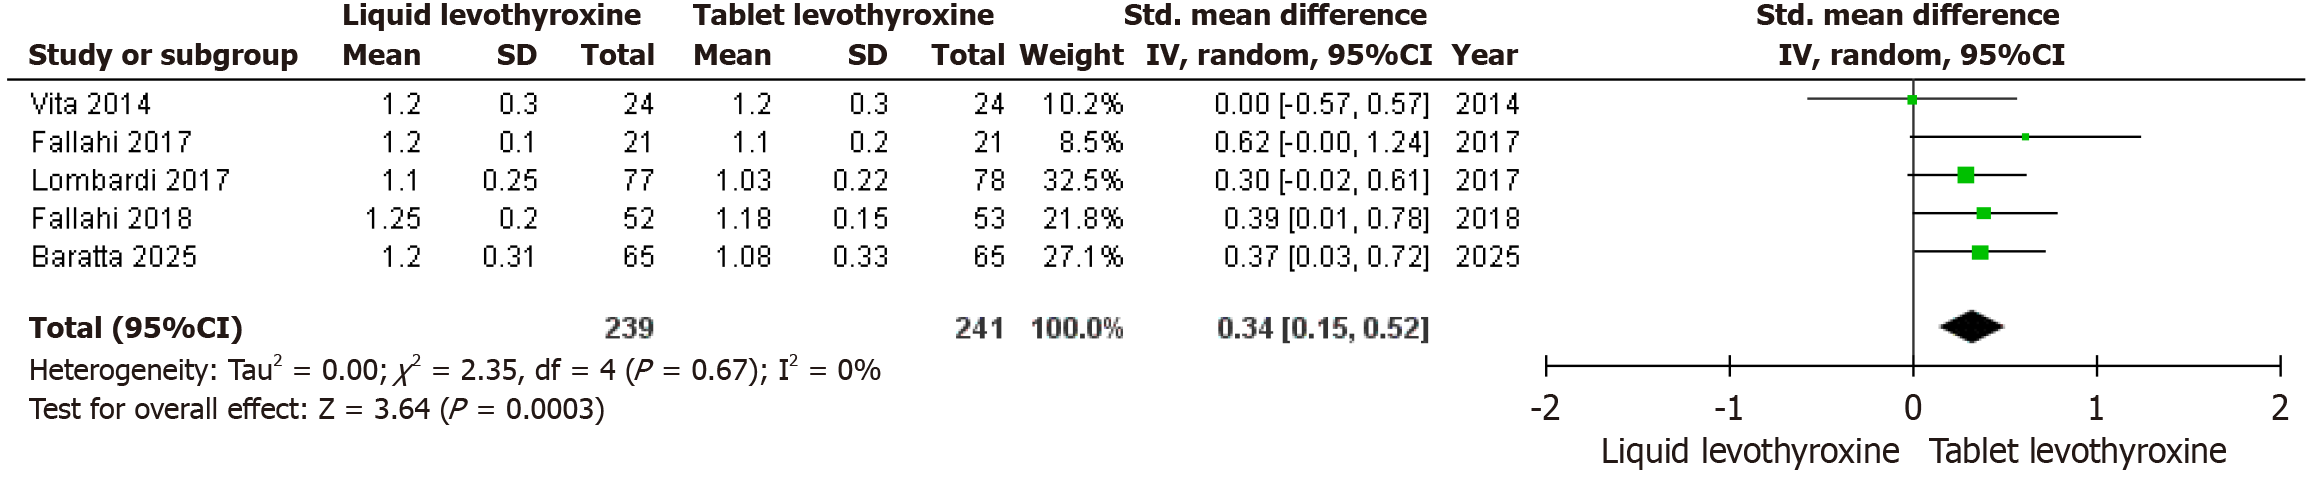
Figure 4 Forest plot comparing circulating total thyroxine levels between liquid or soft-gel and tablet levothyroxine.
CI: Confidence interval.

Figure 5 Forest plot comparing circulating triiodothyronine levels between liquid or soft-gel and tablet levothyroxine.
CI: Confidence interval.

Figure 6
Risk of bias assessment for randomized controlled trials using the Cochrane RoB 2 tool.
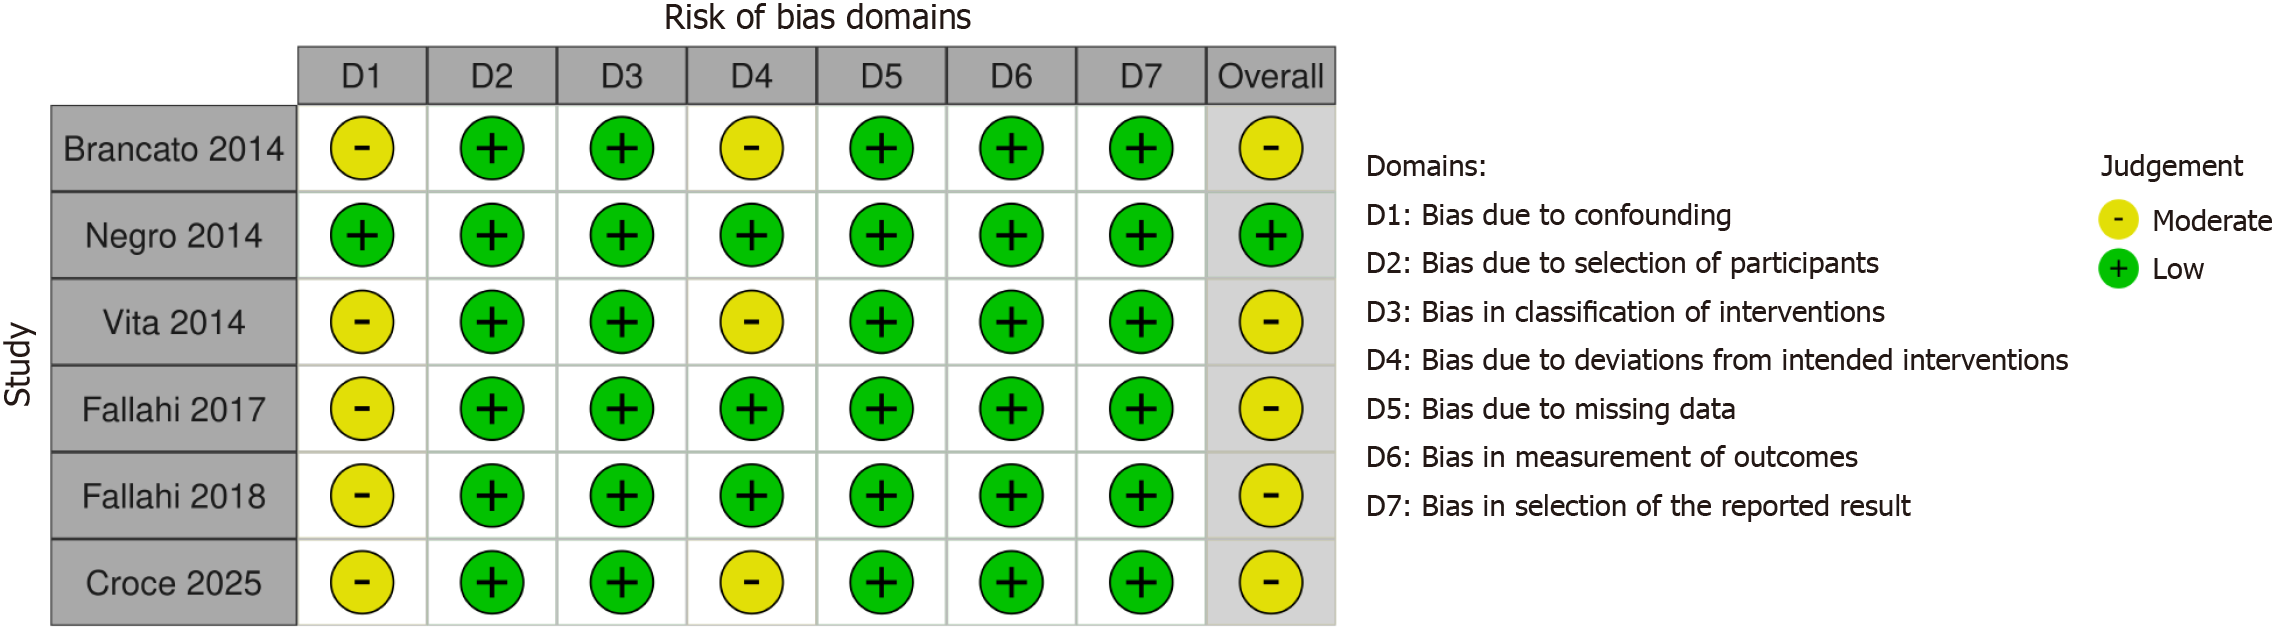
Figure 7
Risk of bias assessment for non-randomized studies using the ROBINS-I tool.
- Citation: Farhan M, Patel T, Obais MAHN, Taslimi H, Hanif M, Khalid K, Qaqour A, Waisi J, Khalid H, Abbas Husain AHA, Hammouda R, Khan SU, Patel BD, Sardarova N, Awosika A. Liquid or soft-gel levothyroxine vs tablet levothyroxine in athyreotic adults after total thyroidectomy: Systematic review and meta-analysis. World J Clin Cases 2026; 14(16): 119700
- URL: https://www.wjgnet.com/2307-8960/full/v14/i16/119700.htm
- DOI: https://dx.doi.org/10.12998/wjcc.v14.i16.119700