©The Author(s) 2025.
World J Clin Cases. Oct 6, 2025; 13(28): 109077
Published online Oct 6, 2025. doi: 10.12998/wjcc.v13.i28.109077
Published online Oct 6, 2025. doi: 10.12998/wjcc.v13.i28.109077
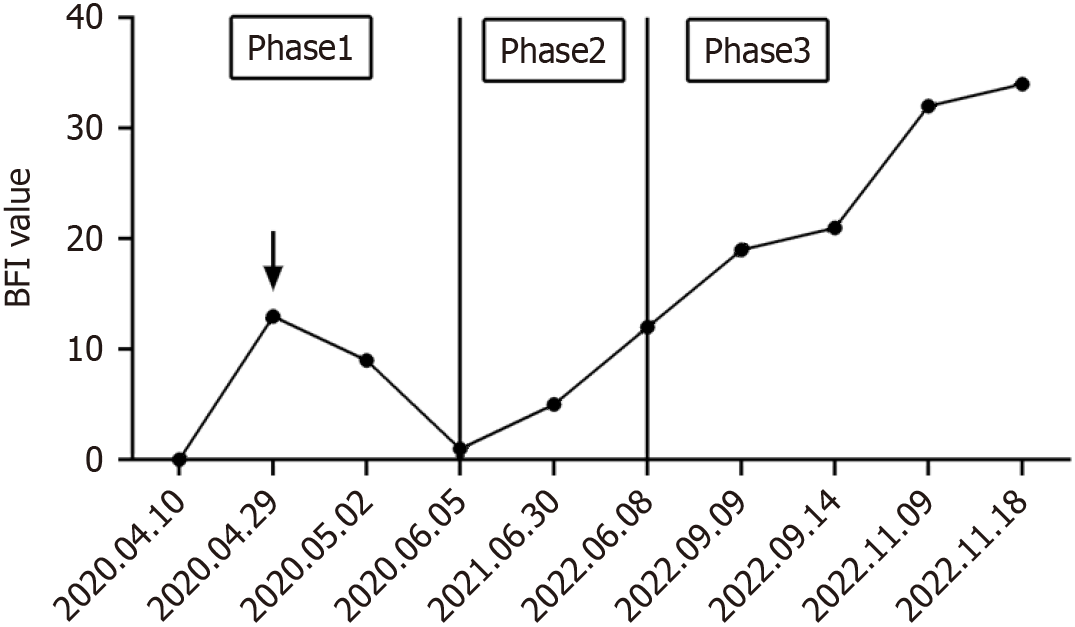
Figure 1 Changes in brief fatigue inventory values from the first admission to the last admission of the case.
The black arrows in the figure represent the surgical treatment. Phases 1, 2, and 3, delineated by the solid red line, correspond to early splenic histiocytic sarcoma (SHS), mid-SHS, and late SHS, respectively. BFI: Brief fatigue inventory.
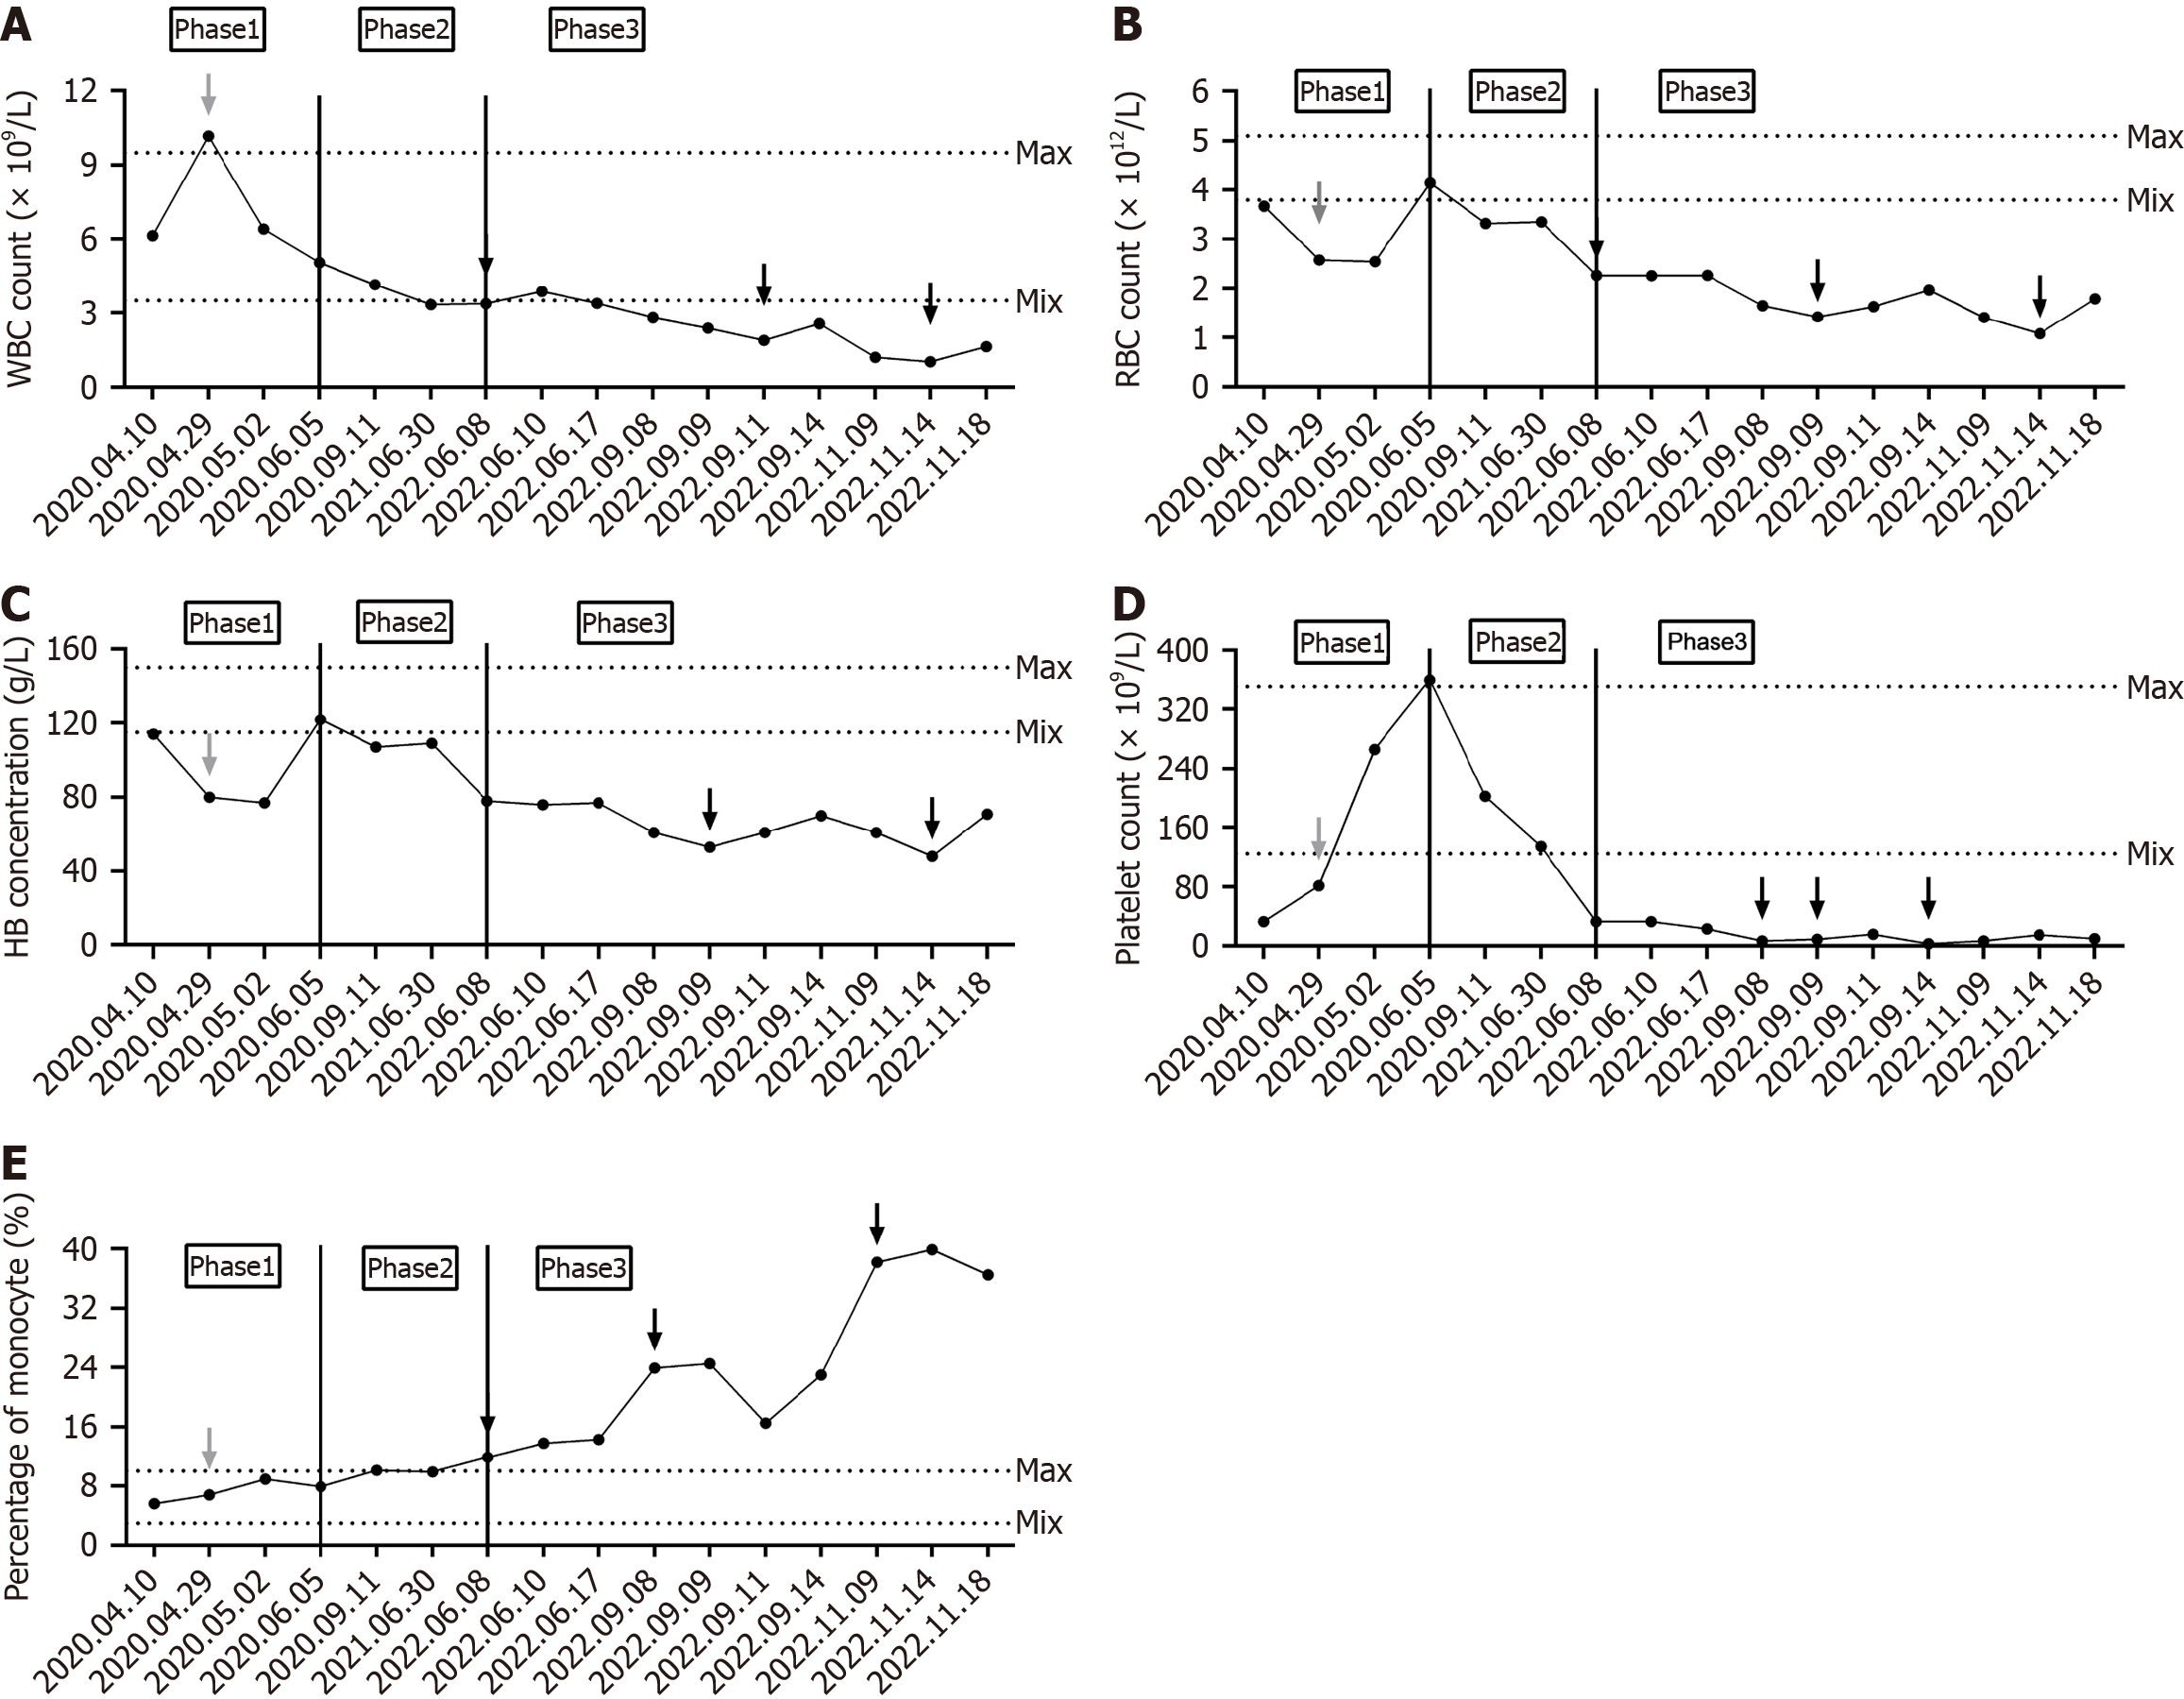
Figure 2 Changes in blood routine from the first admission to the last admission of the case.
A: White blood cell count. The black arrows in the figure denote the transfusion of frozen plasma; B: Red blood cell count. The black arrows in the figure represent the infusion of suspended red blood cells; C: Hemoglobin concentration. The black arrows in the figure represent the infusion of suspended red blood cells; D: Platelet count. The black arrows in the figure denote the transfusion of platelets and cryoprecipitation; E: Monocyte percentage. The black arrows in the figure denote the transfusion of frozen plasma. The range between dotted lines represents the normal reference range for a given indicator. The gray arrows in the figure represent surgical treatment. Phases 1, 2, and 3, delineated by the solid black line, correspond to early splenic histiocytic sarcoma (SHS), mid-SHS, and late SHS, respectively. WBC: White blood cell; RBC: Red blood cell; HB: Hemoglobin.
Figure 3 Changes in liver function from the first admission to the last admission of the case.
A: Total protein (TP), albumin, and globulin concentrations. The black arrows in the figure denote the infusion of frozen plasma and 20% human albumin. The range between the dotted lines represents the normal reference range for a given index (TP: Dot; albumin: Short line; globulin: Dot and short line alternate); B: Total bilirubin (TBIL), direct bilirubin (DBIL), and indirect bilirubin (IBIL) concentrations. The black arrow in the figure denotes hepatoprotective drug therapy. The range between the dotted lines represents the normal reference range for a given index (TBIL: Dot; IBIL: Short line; DBIL: Dot and short line alternate). The gray arrows in the figure represent surgical treatment. Phases 1, 2, and 3, delineated by the solid black line, correspond to early SHS, mid-SHS, and late SHS, respectively. TP: Total protein; TBIL: Total bilirubin; DBIL: Direct bilirubin; IBIL: Indirect bilirubin.
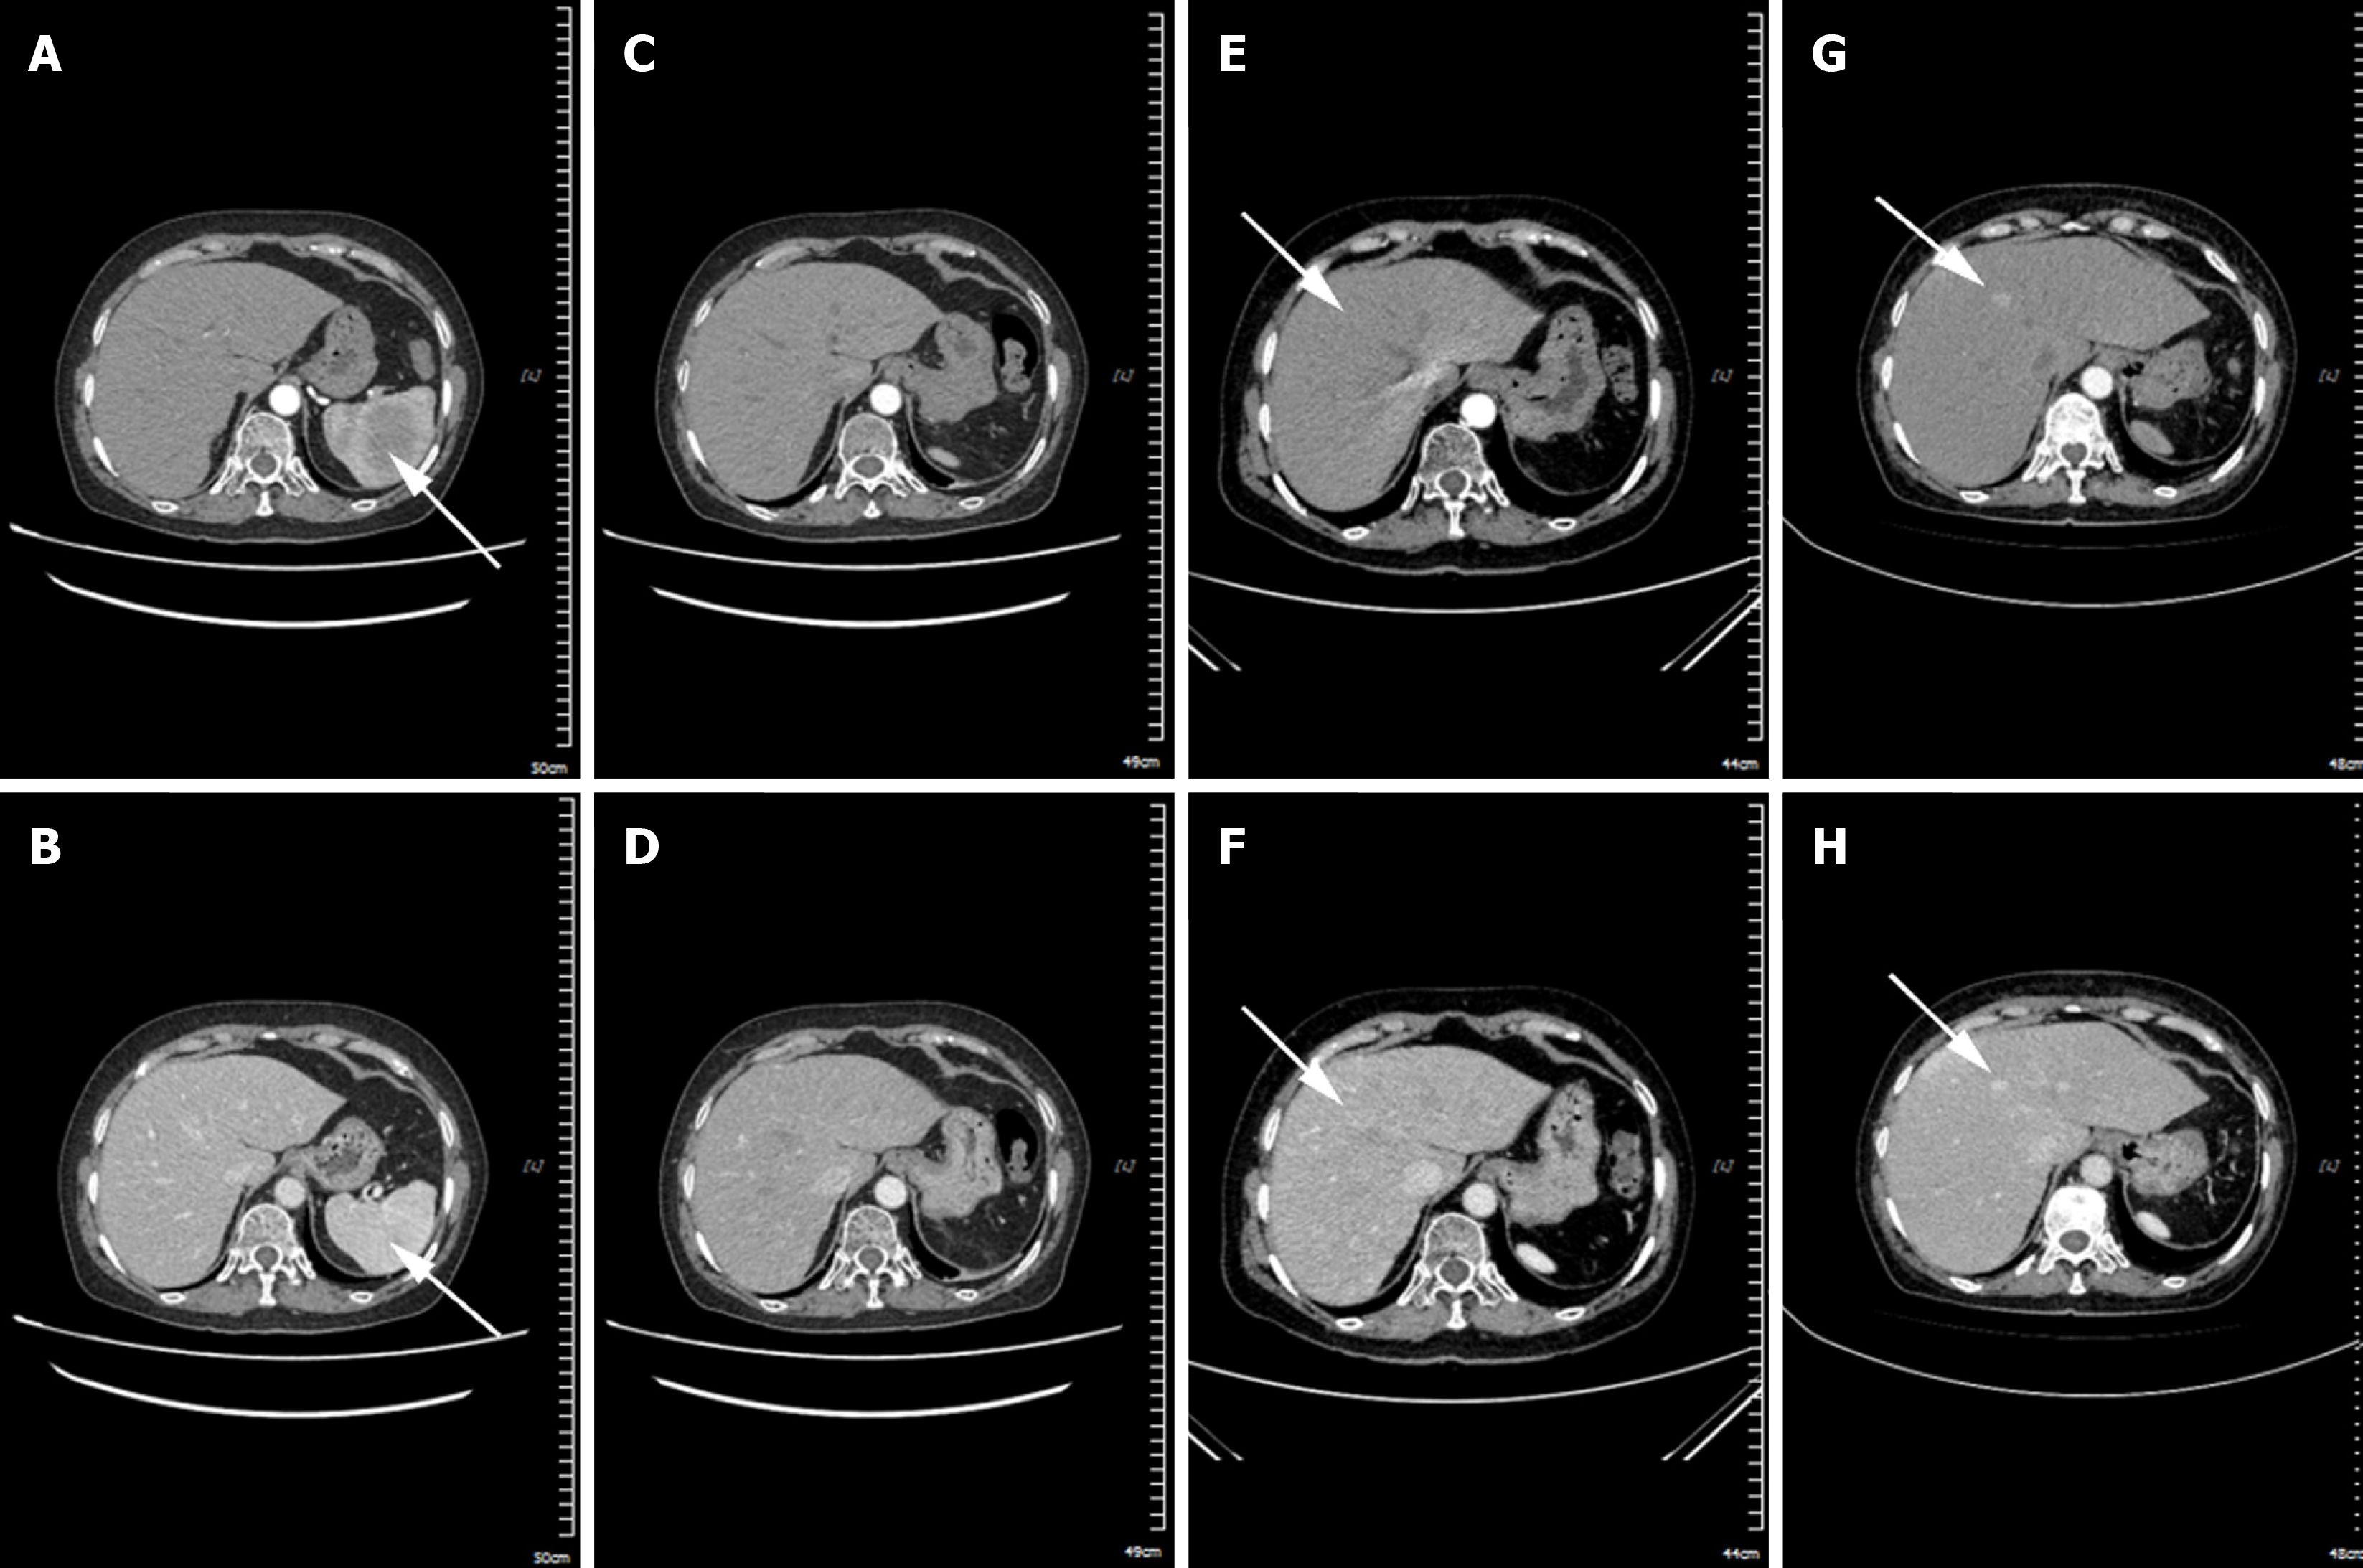
Figure 4 Abdominal computed tomography angiograph scan of the case (transverse section).
A and B: In April 2020, the splenic histiocytic sarcoma measured approximately 6.0 cm × 5.7 cm (A: Arterial phase) and (B: Venous phase), with a computed tomography value of around 48 HU, and exhibited progressive enhancement; C and D: In June 2020, following splenectomy, no spleen was visualized in the splenic area (C: Arterial phase) and (D: Venous phase), and the fat space surrounding the operative site was slightly disturbed (Phase 1); E and F: In June 2022, multiple nodular enhancement shadows were present in the liver (E: Arterial phase) and (F: Venous phase); the larger one was located in the left medial lobe of the liver, measuring approximately 2.4 cm× 2.9 (Phase 2); G and H: In September 2022, multiple nodular enhancement shadows were observed in the liver (G: Arterial phase) and (H: Venous phase). The larger one, located in the left medial lobe of the liver, had an extent of approximately 4.3 cm × 2.7 cm (Phase 3). The white arrow indicates the tumor.
- Citation: Yao MT, Wang T, Luo H, Yao MY, Chen K, Zhu YQ. Splenic histiocytic sarcoma: Disease progression from the perspective of pathophysiology. World J Clin Cases 2025; 13(28): 109077
- URL: https://www.wjgnet.com/2307-8960/full/v13/i28/109077.htm
- DOI: https://dx.doi.org/10.12998/wjcc.v13.i28.109077


