©The Author(s) 2025.
World J Clin Cases. Oct 6, 2025; 13(28): 107759
Published online Oct 6, 2025. doi: 10.12998/wjcc.v13.i28.107759
Published online Oct 6, 2025. doi: 10.12998/wjcc.v13.i28.107759
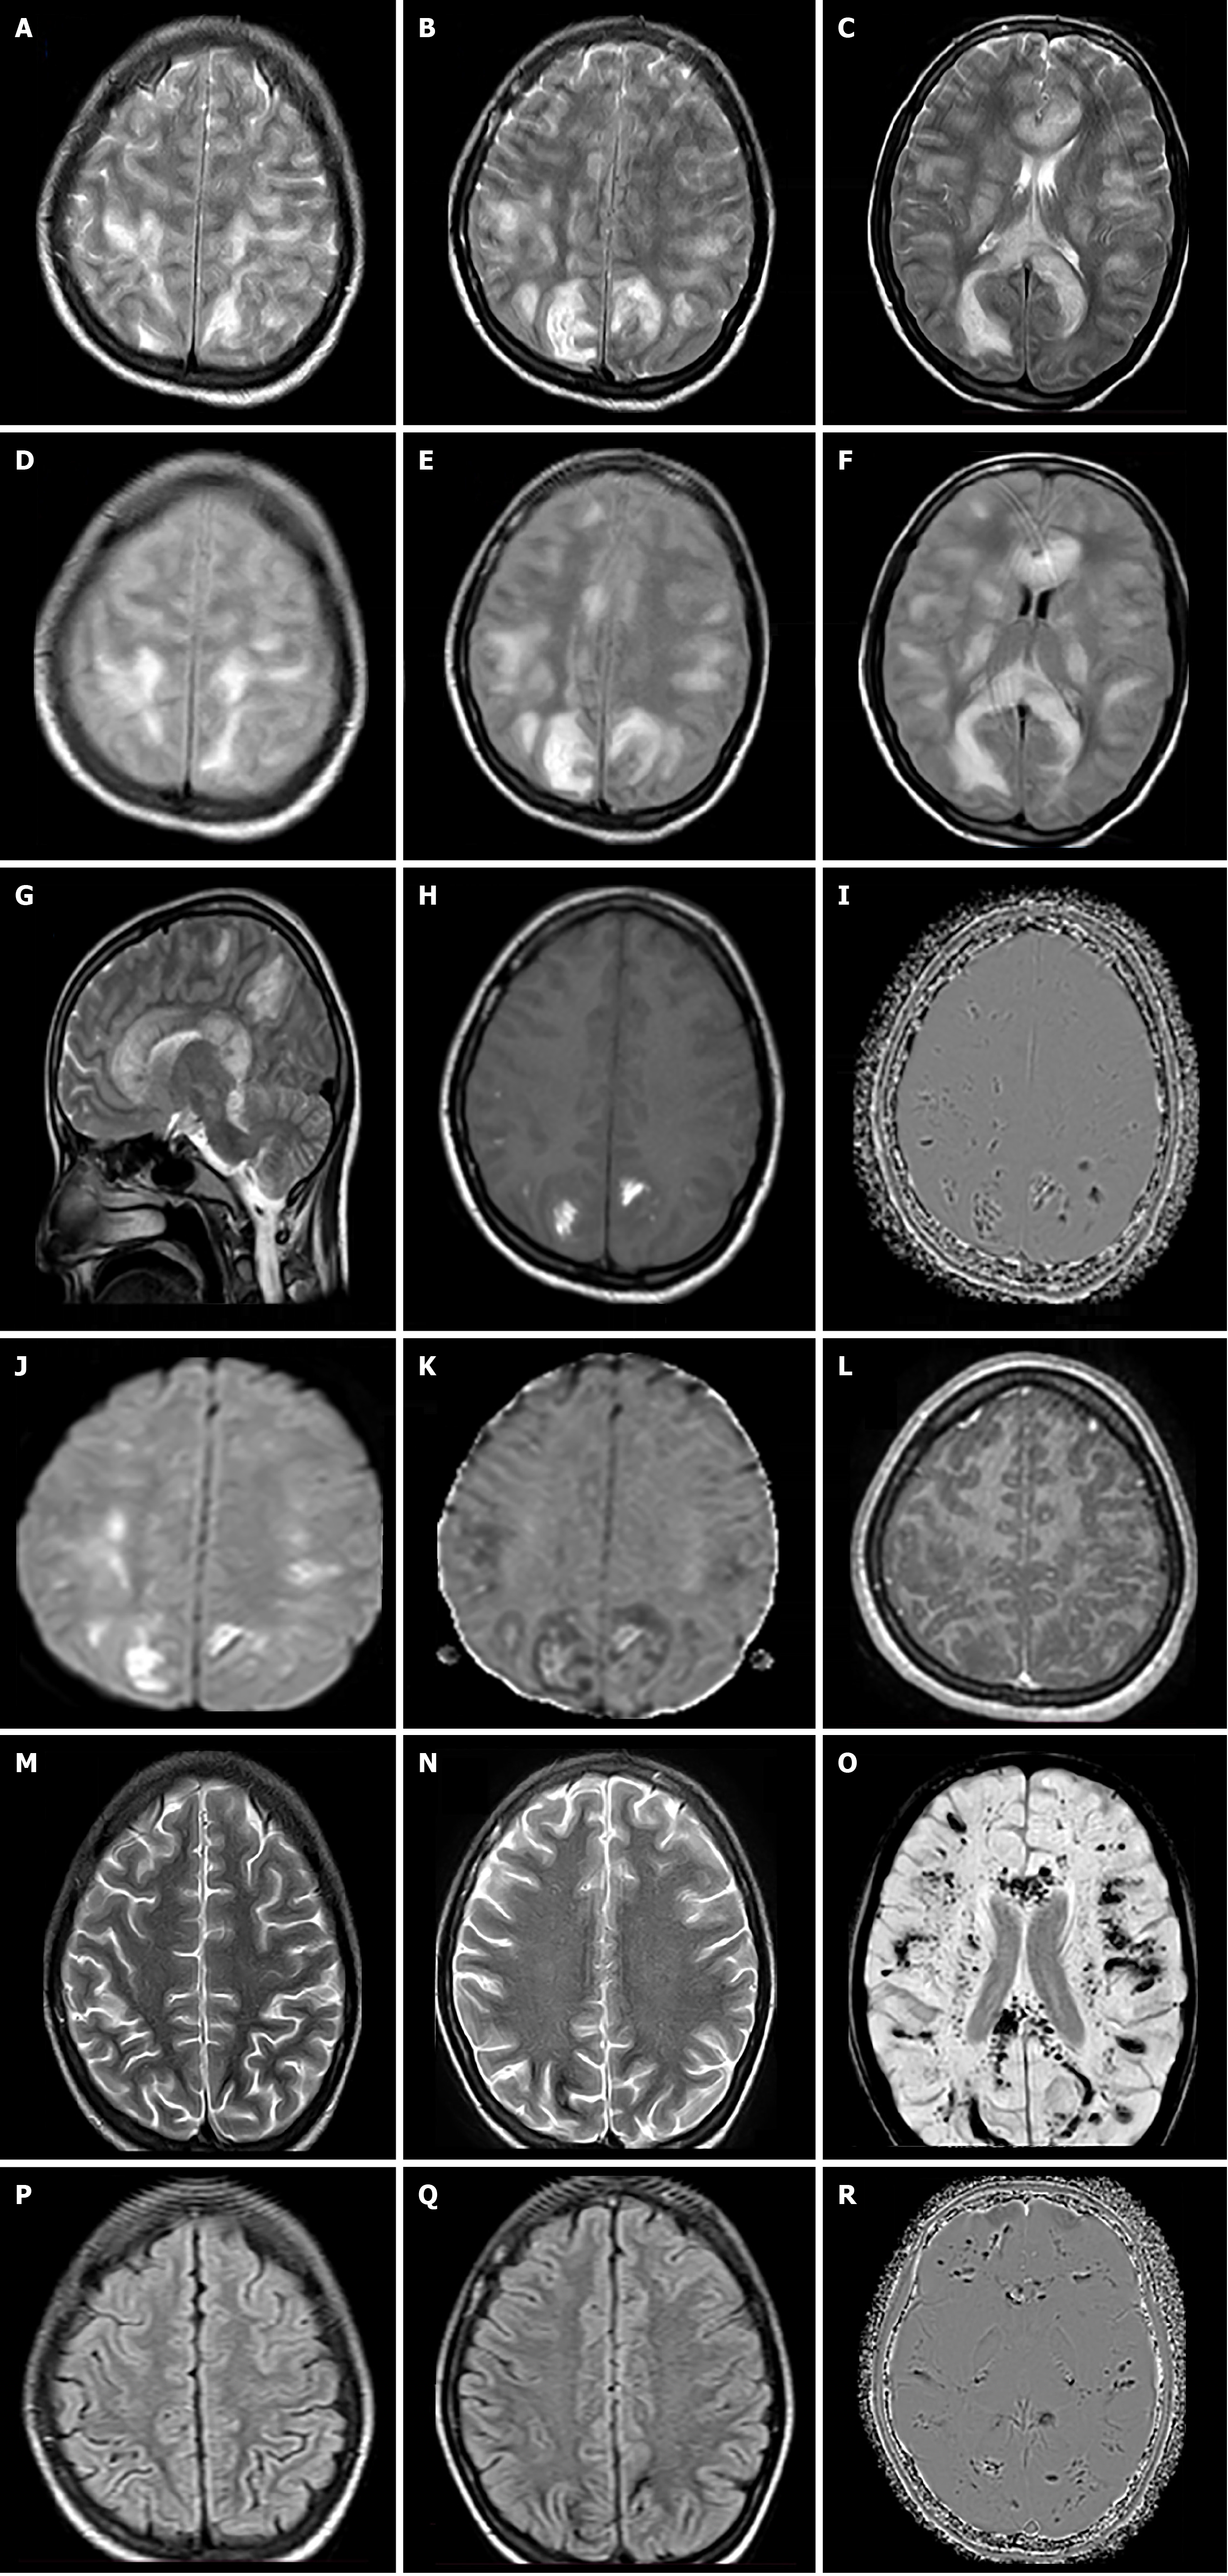
Figure 1 Magnetic resonance imaging brain findings in a 19-year-old female at initial presentation and on follow-up.
A-C: Axial T2 weighted images showing multifocal hyperintensities in subcortical and deep white matter with corpus callosum involvement; D-F: Axial Fluid attenuated inversion recovery (FLAIR) images demonstrating confluent hyperintensities in bilateral cerebral white matter and corpus callosum; G: Sagittal T2-weighted image showing fluffy white matter and callosal hyperintensities; H and I: Axial T1 weighted image (H) showing internal hyperintense areas within white matter lesions, which on Susceptibility weighted imaging (SWI) phase image (I) are showing negative phase effect suggestive of hemorrhages; J and K: DWI and apparent diffusion coefficient images showing patchy diffusion restriction; L: Post-contrast T1-weighted image showing no enhancement; M and N: Follow-up T2-weighted images showing resolution of white matter lesions; O: Follow up SWI image showing multiple hemorrhagic residues in white matter; P and Q: Follow-up FLAIR images showing resolution of white matter lesions; R: Follow-up SWI phase image showing multiple residual hemorrhagic foci.
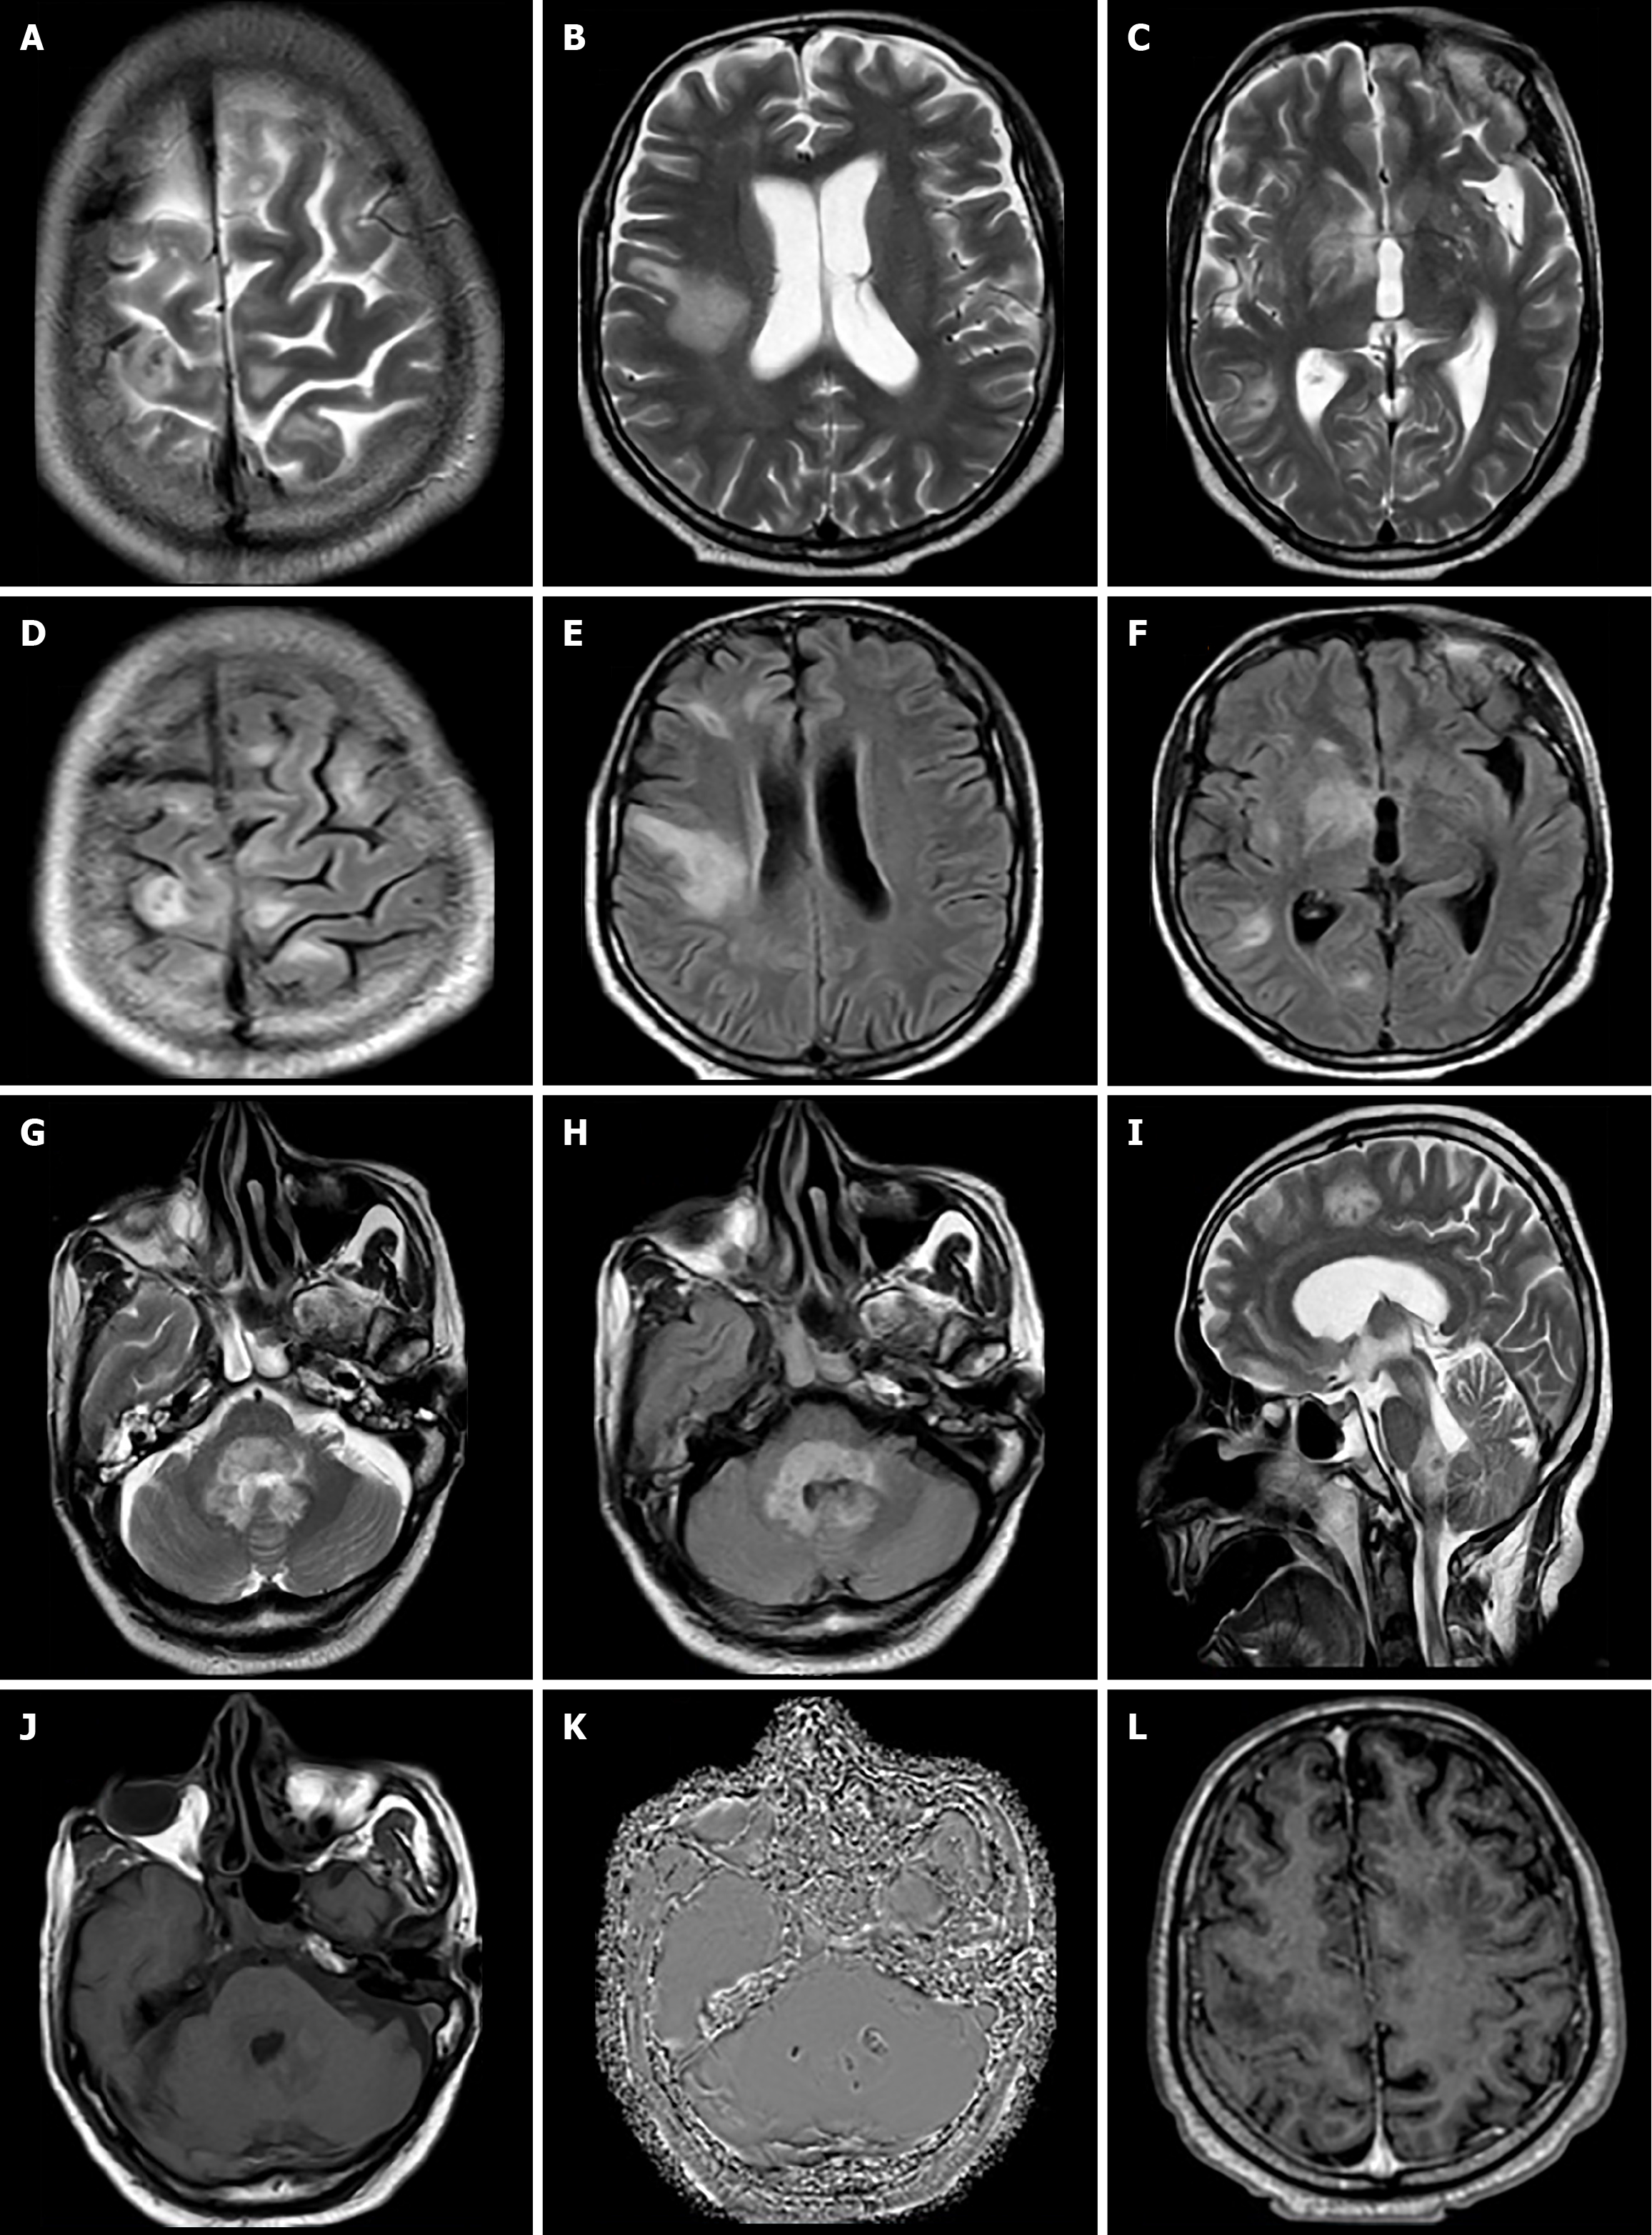
Figure 2 Magnetic resonance imaging brain findings in a 40-year-old male patient who presented with fever and altered sensorium.
A-C: T2-weighted axial images showing multifocal subcortical and deep white matter hyperintensities in bilateral cerebral hemispheres associated with involvement of right hypothalamus; D-F: Corresponding axial Fluid attenuated inversion recovery (FLAIR) images showing similar findings as seen on T2-weighted images; G and H: Axial T2-weighted and FLAIR images showing hyperintensity involving pons and bilateral middle cerebellar peduncles; I: T2 weighted sagittal image showing hyperintense lesions involving midbrain, pons, medulla and scanned part of the cervical spinal cord; J: T1-weighted axial image showing hypointensity in the involved areas with internal hyperintense areas suggestive of hemorrhages; K: Susceptibility weighted imaging (SWI) axial phase image showing a negative phase effect within white matter lesions indicative of hemorrhages; L: T1-weighted post-contrast axial image showing no enhancement in the affected regions.
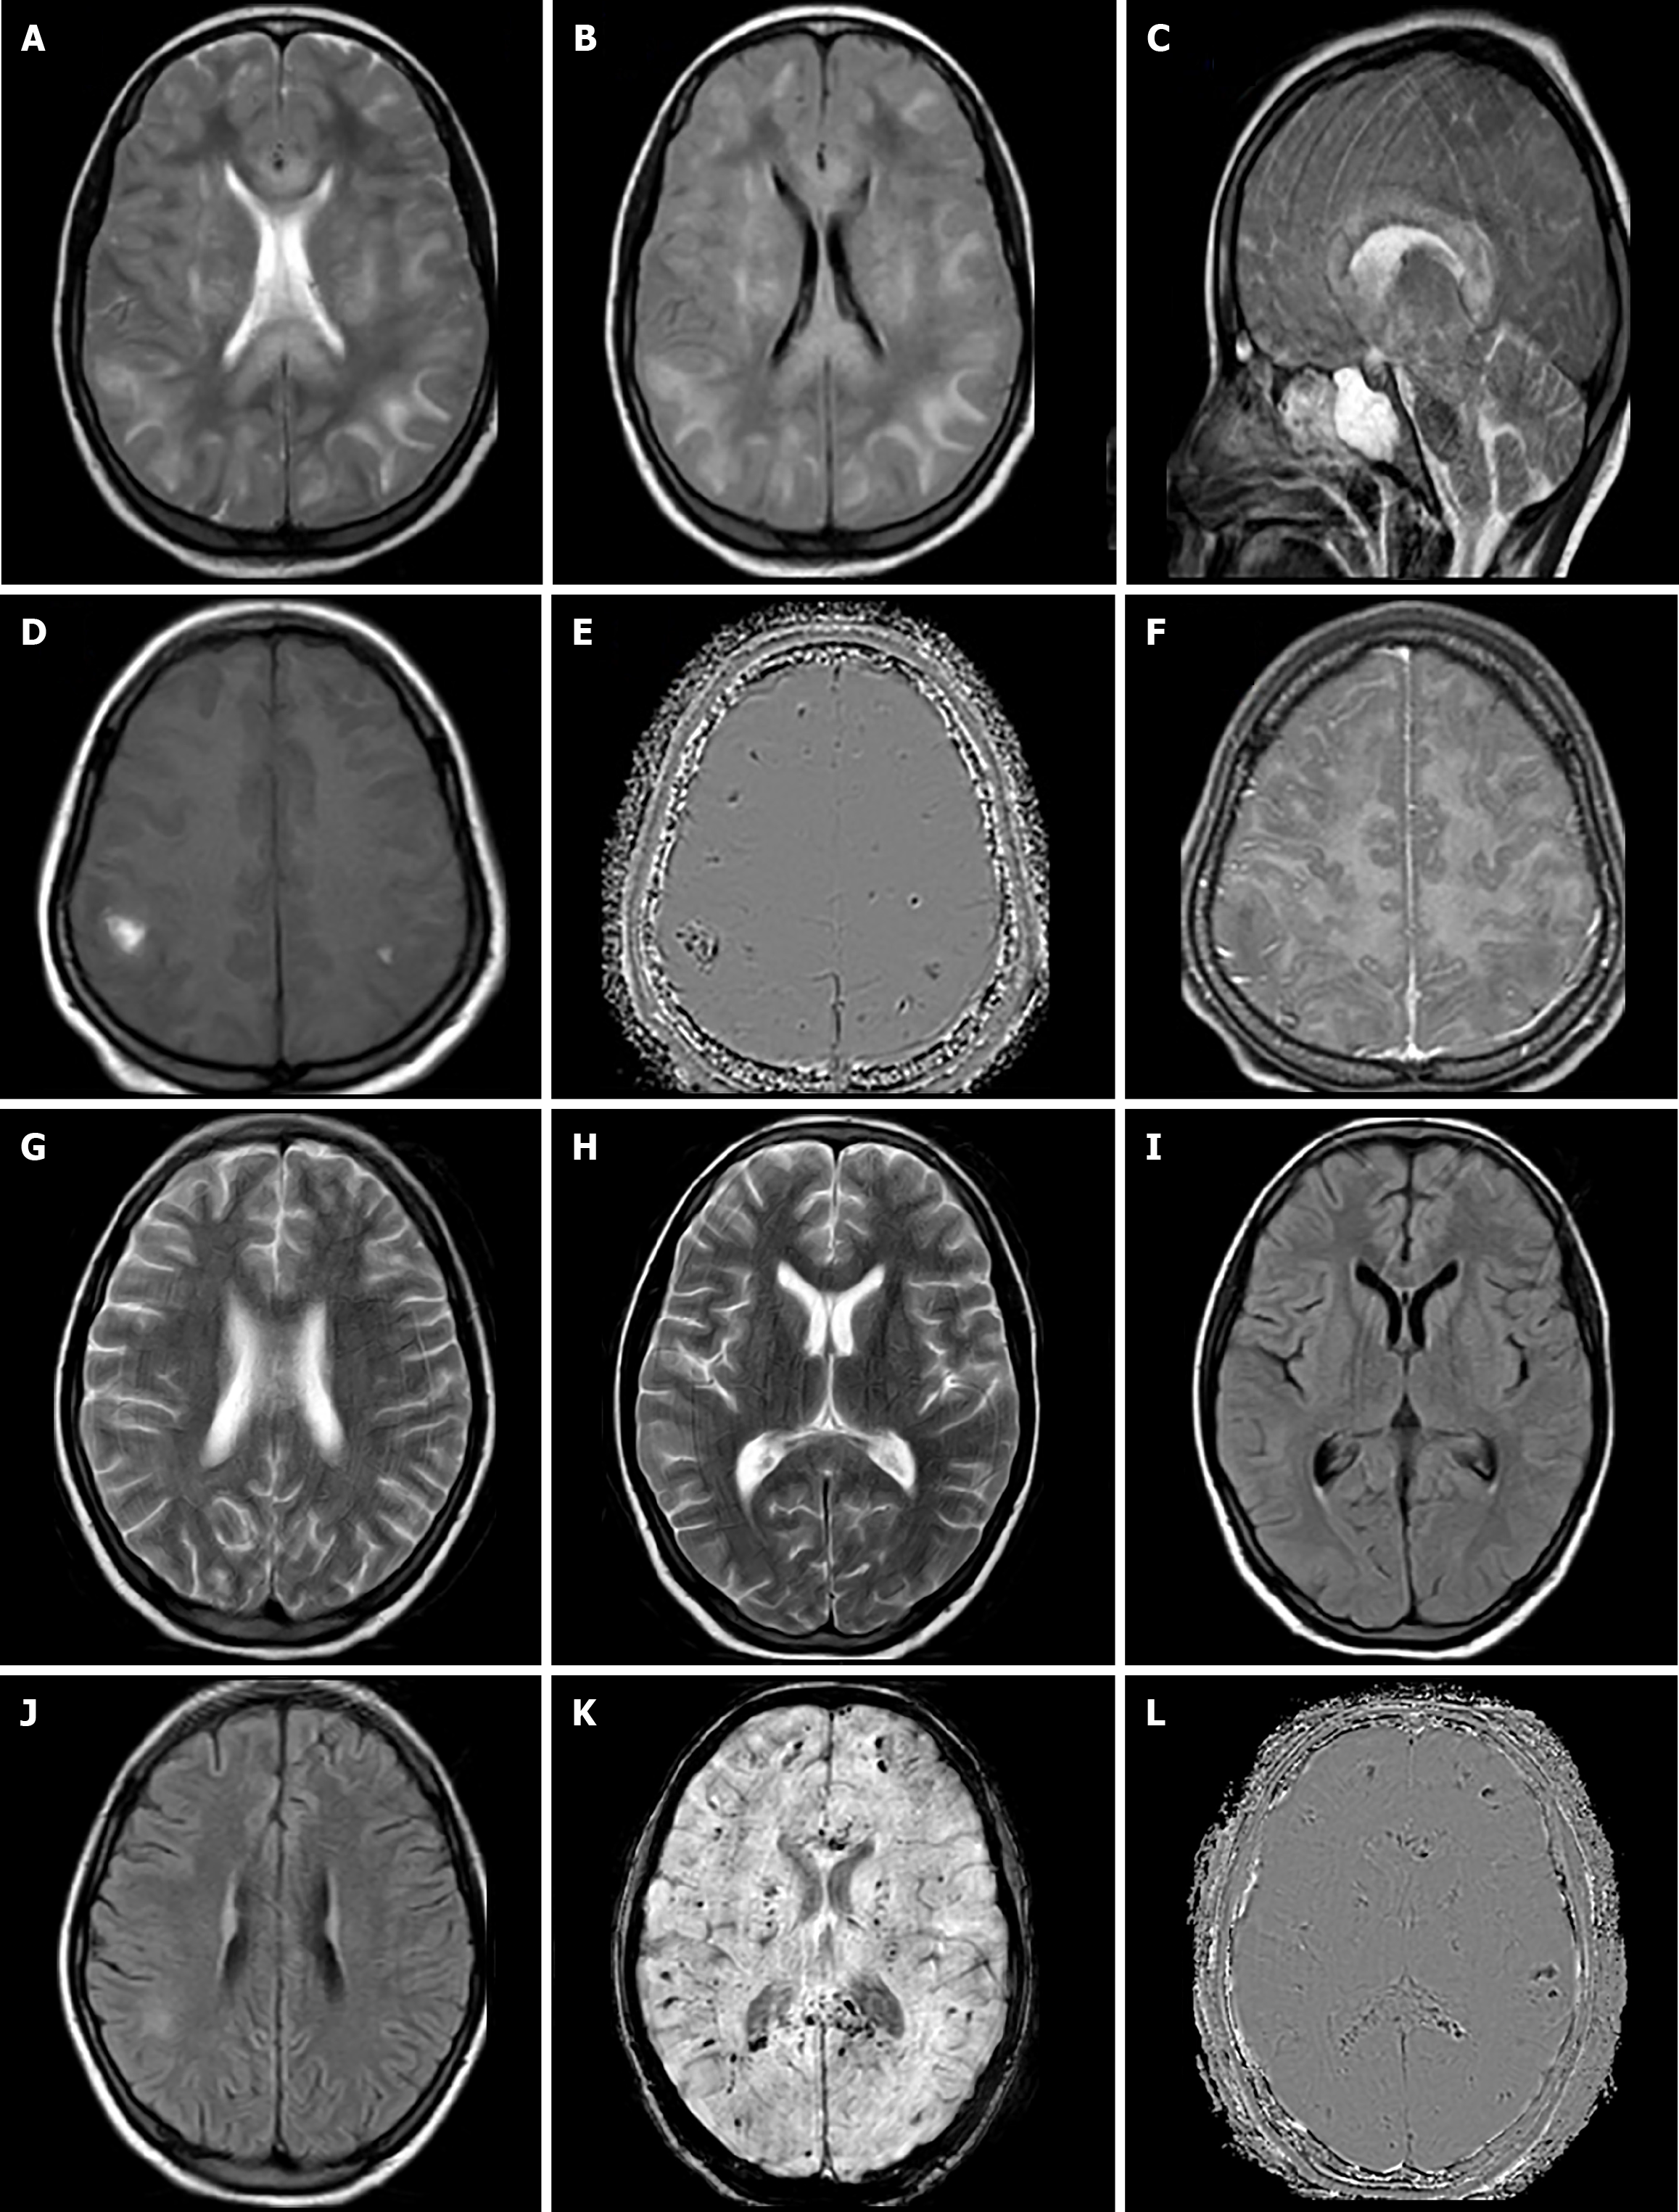
Figure 3 Magnetic resonance imaging brain findings of an 18-year-old female patient during hospitalization and on follow up.
A: Axial T2 weighted image showing multifocal subcortical and deep white matter hyperintensities in the bilateral cerebral hemispheres; B: Axial Fluid attenuated inversion recovery (FLAIR) image showing multiple white matter hyperintensities; C: Sagittal T2 weighted image revealing involvement of the corpus callosum; D: Axial T1 weighted image showing hypointense lesions with internal, hyperintense foci in the affected areas; E: Axial Susceptibility weighted imaging (SWI) phase image demonstrating a negative phase effect, suggestive of hemorrhagic components. F: Axial post contrast T1 weighted image showing no obvious enhancement; G–J: Follow-up T2-weighted (G, H) and FLAIR (I, J) images showing resolution of previously noted white matter hyperintensities; K and L: Follow up SWI images revealing an increased number of hemorrhagic residues compared to initial imaging.
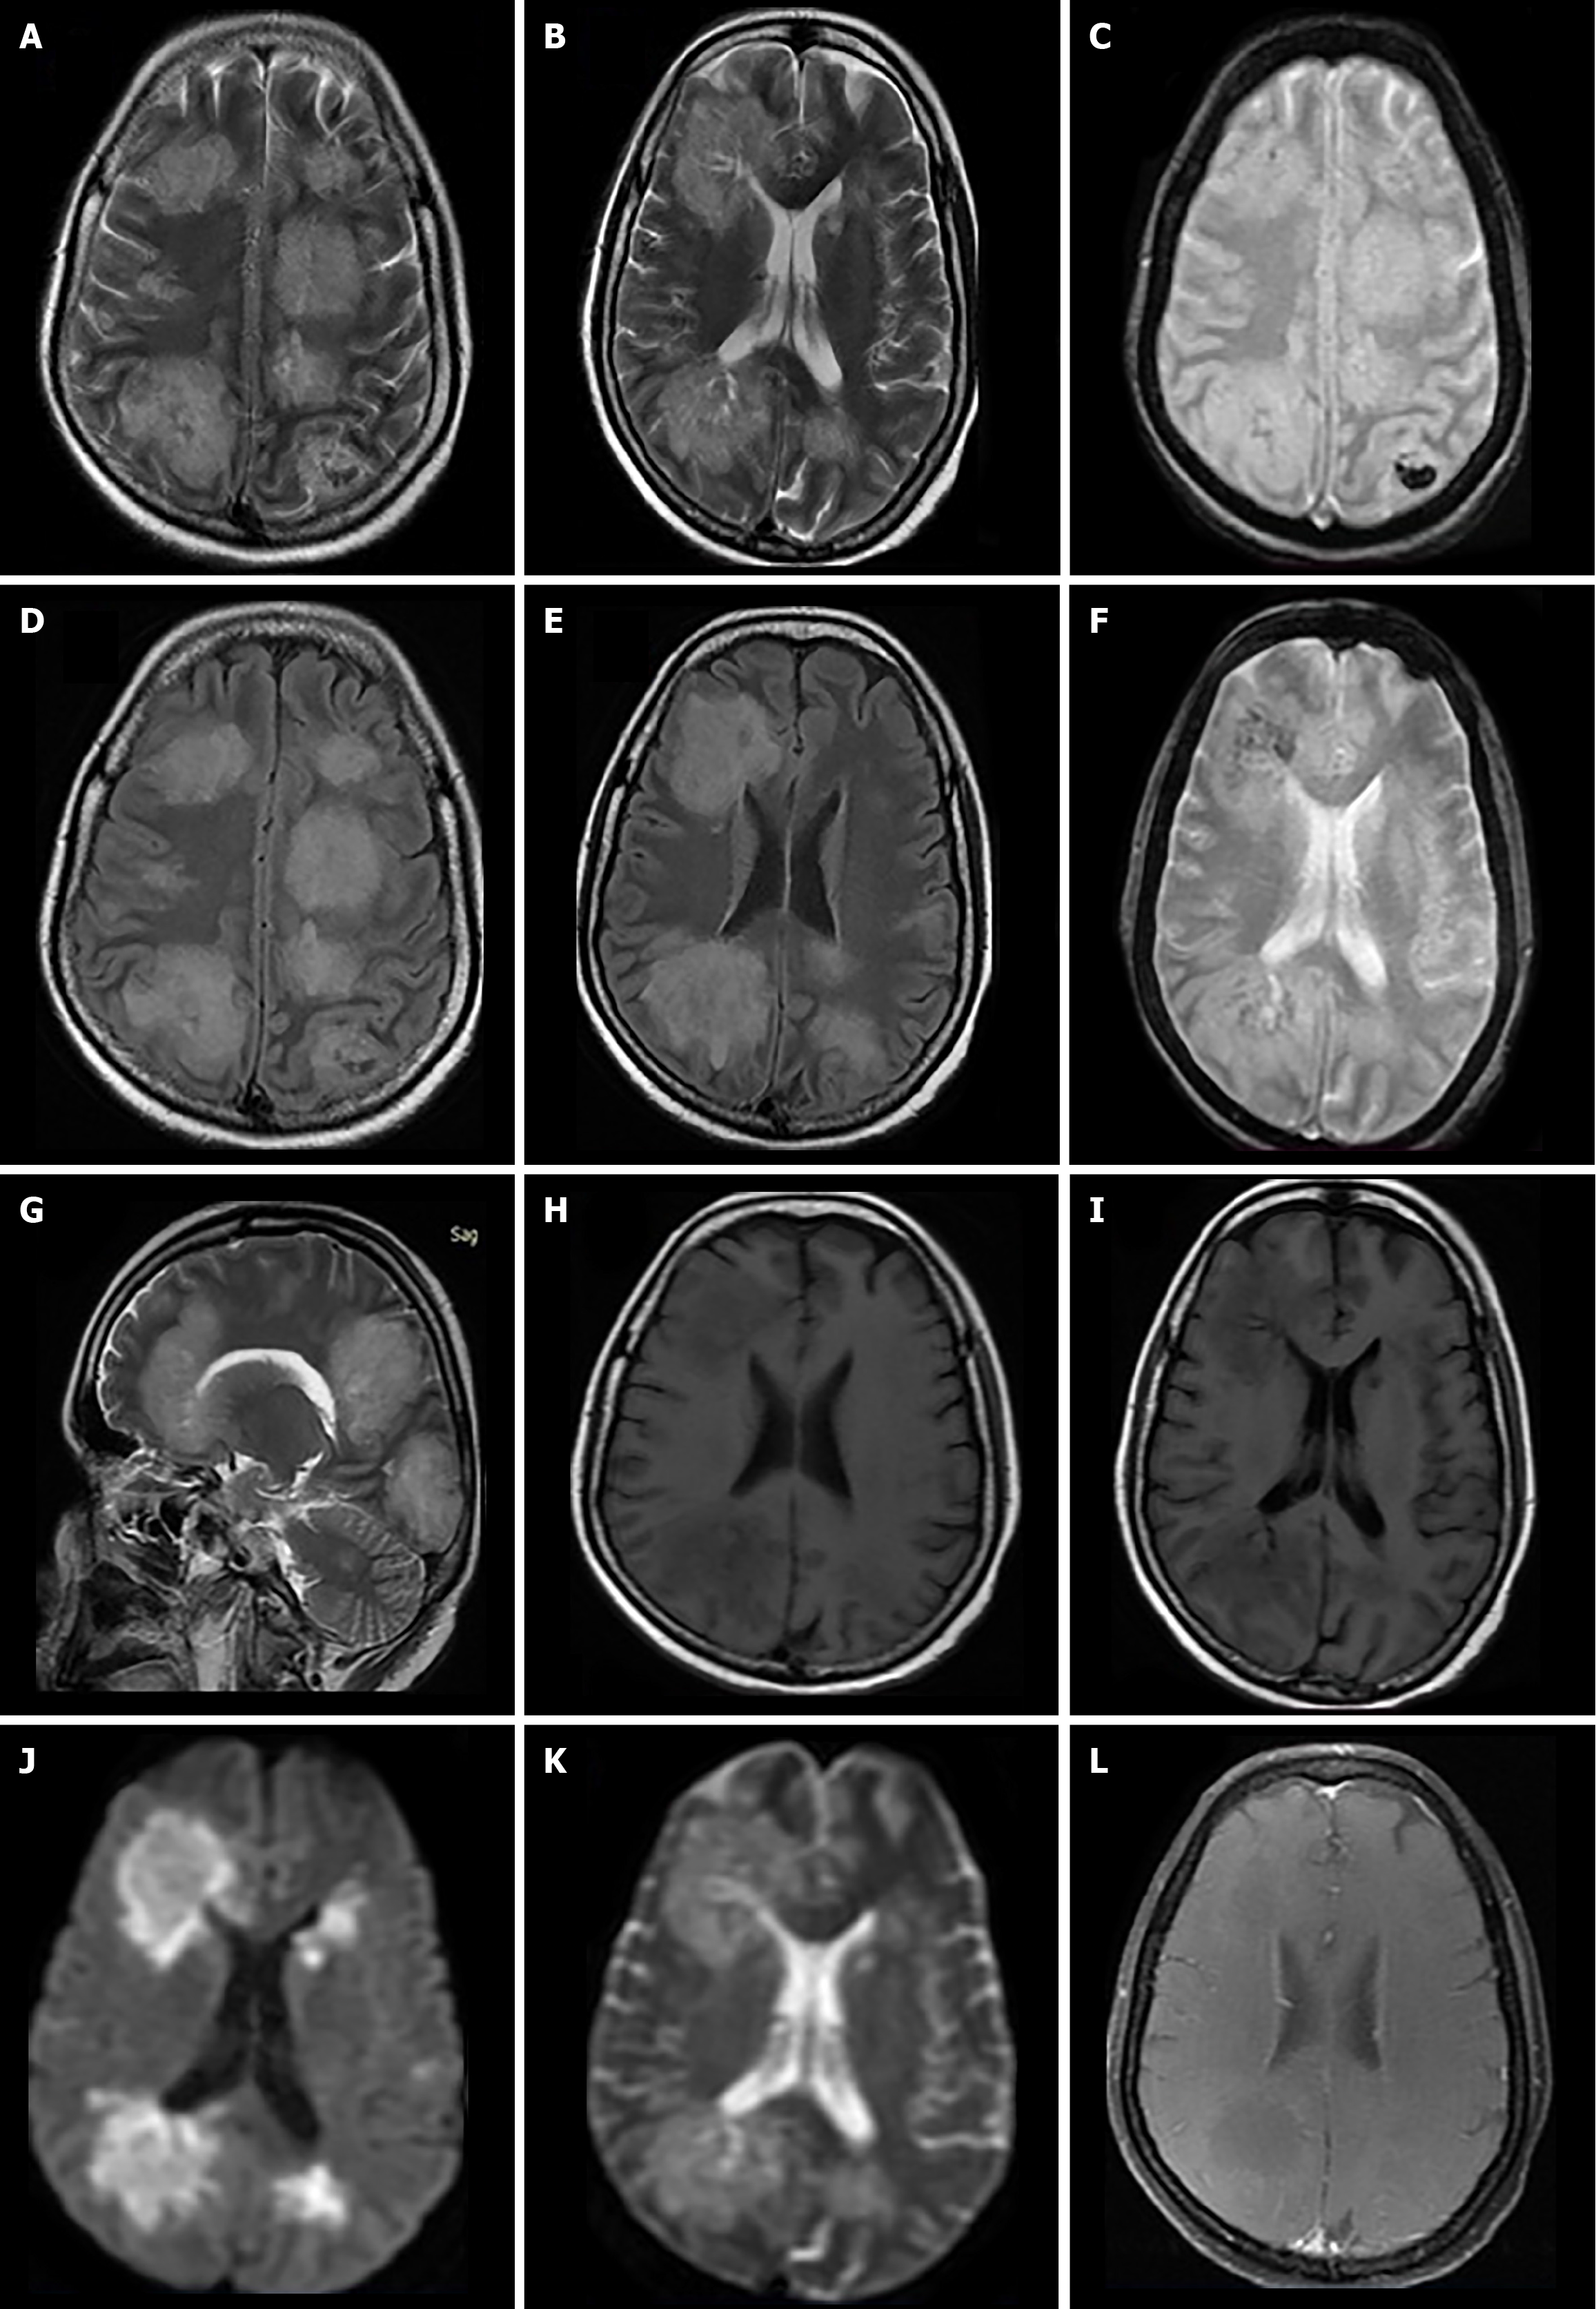
Figure 4 Magnetic resonance imaging brain findings in a 45-year old female patient.
A and B: Axial T2-weighted images showing fluffy hyperintense lesions in subcortical and deep white matter; C: Axial Gradient echo sequence (GRE) image revealing blooming areas within white matter lesions, suggestive of hemorrhages; D and E: Axial fluid attenuated inversion recovery images showing multifocal hyperintense white matter lesions; F: Axial GRE image demonstrating hemorrhagic foci within the lesions; G: Sagittal T2-weighted image illustrating white matter hyperintensities; H and I: Axial T1-weighted image showing multifocal hypointense lesions; J and K: Axial diffusion-weighted imaging and corresponding apparent diffusion coefficient map image showing areas of restricted diffusion within the lesions; L: Axial post-contrast T1-weighted image depicting subtle peripheral enhancement of the lesions.
- Citation: Shukla A, Nayyar N, Kumari P, Kumar A, Takkar P. Magnetic resonance imaging spectrum of acute hemorrhagic leukoencephalitis: Four case reports. World J Clin Cases 2025; 13(28): 107759
- URL: https://www.wjgnet.com/2307-8960/full/v13/i28/107759.htm
- DOI: https://dx.doi.org/10.12998/wjcc.v13.i28.107759


