©The Author(s) 2025.
World J Clin Cases. Sep 26, 2025; 13(27): 108923
Published online Sep 26, 2025. doi: 10.12998/wjcc.v13.i27.108923
Published online Sep 26, 2025. doi: 10.12998/wjcc.v13.i27.108923
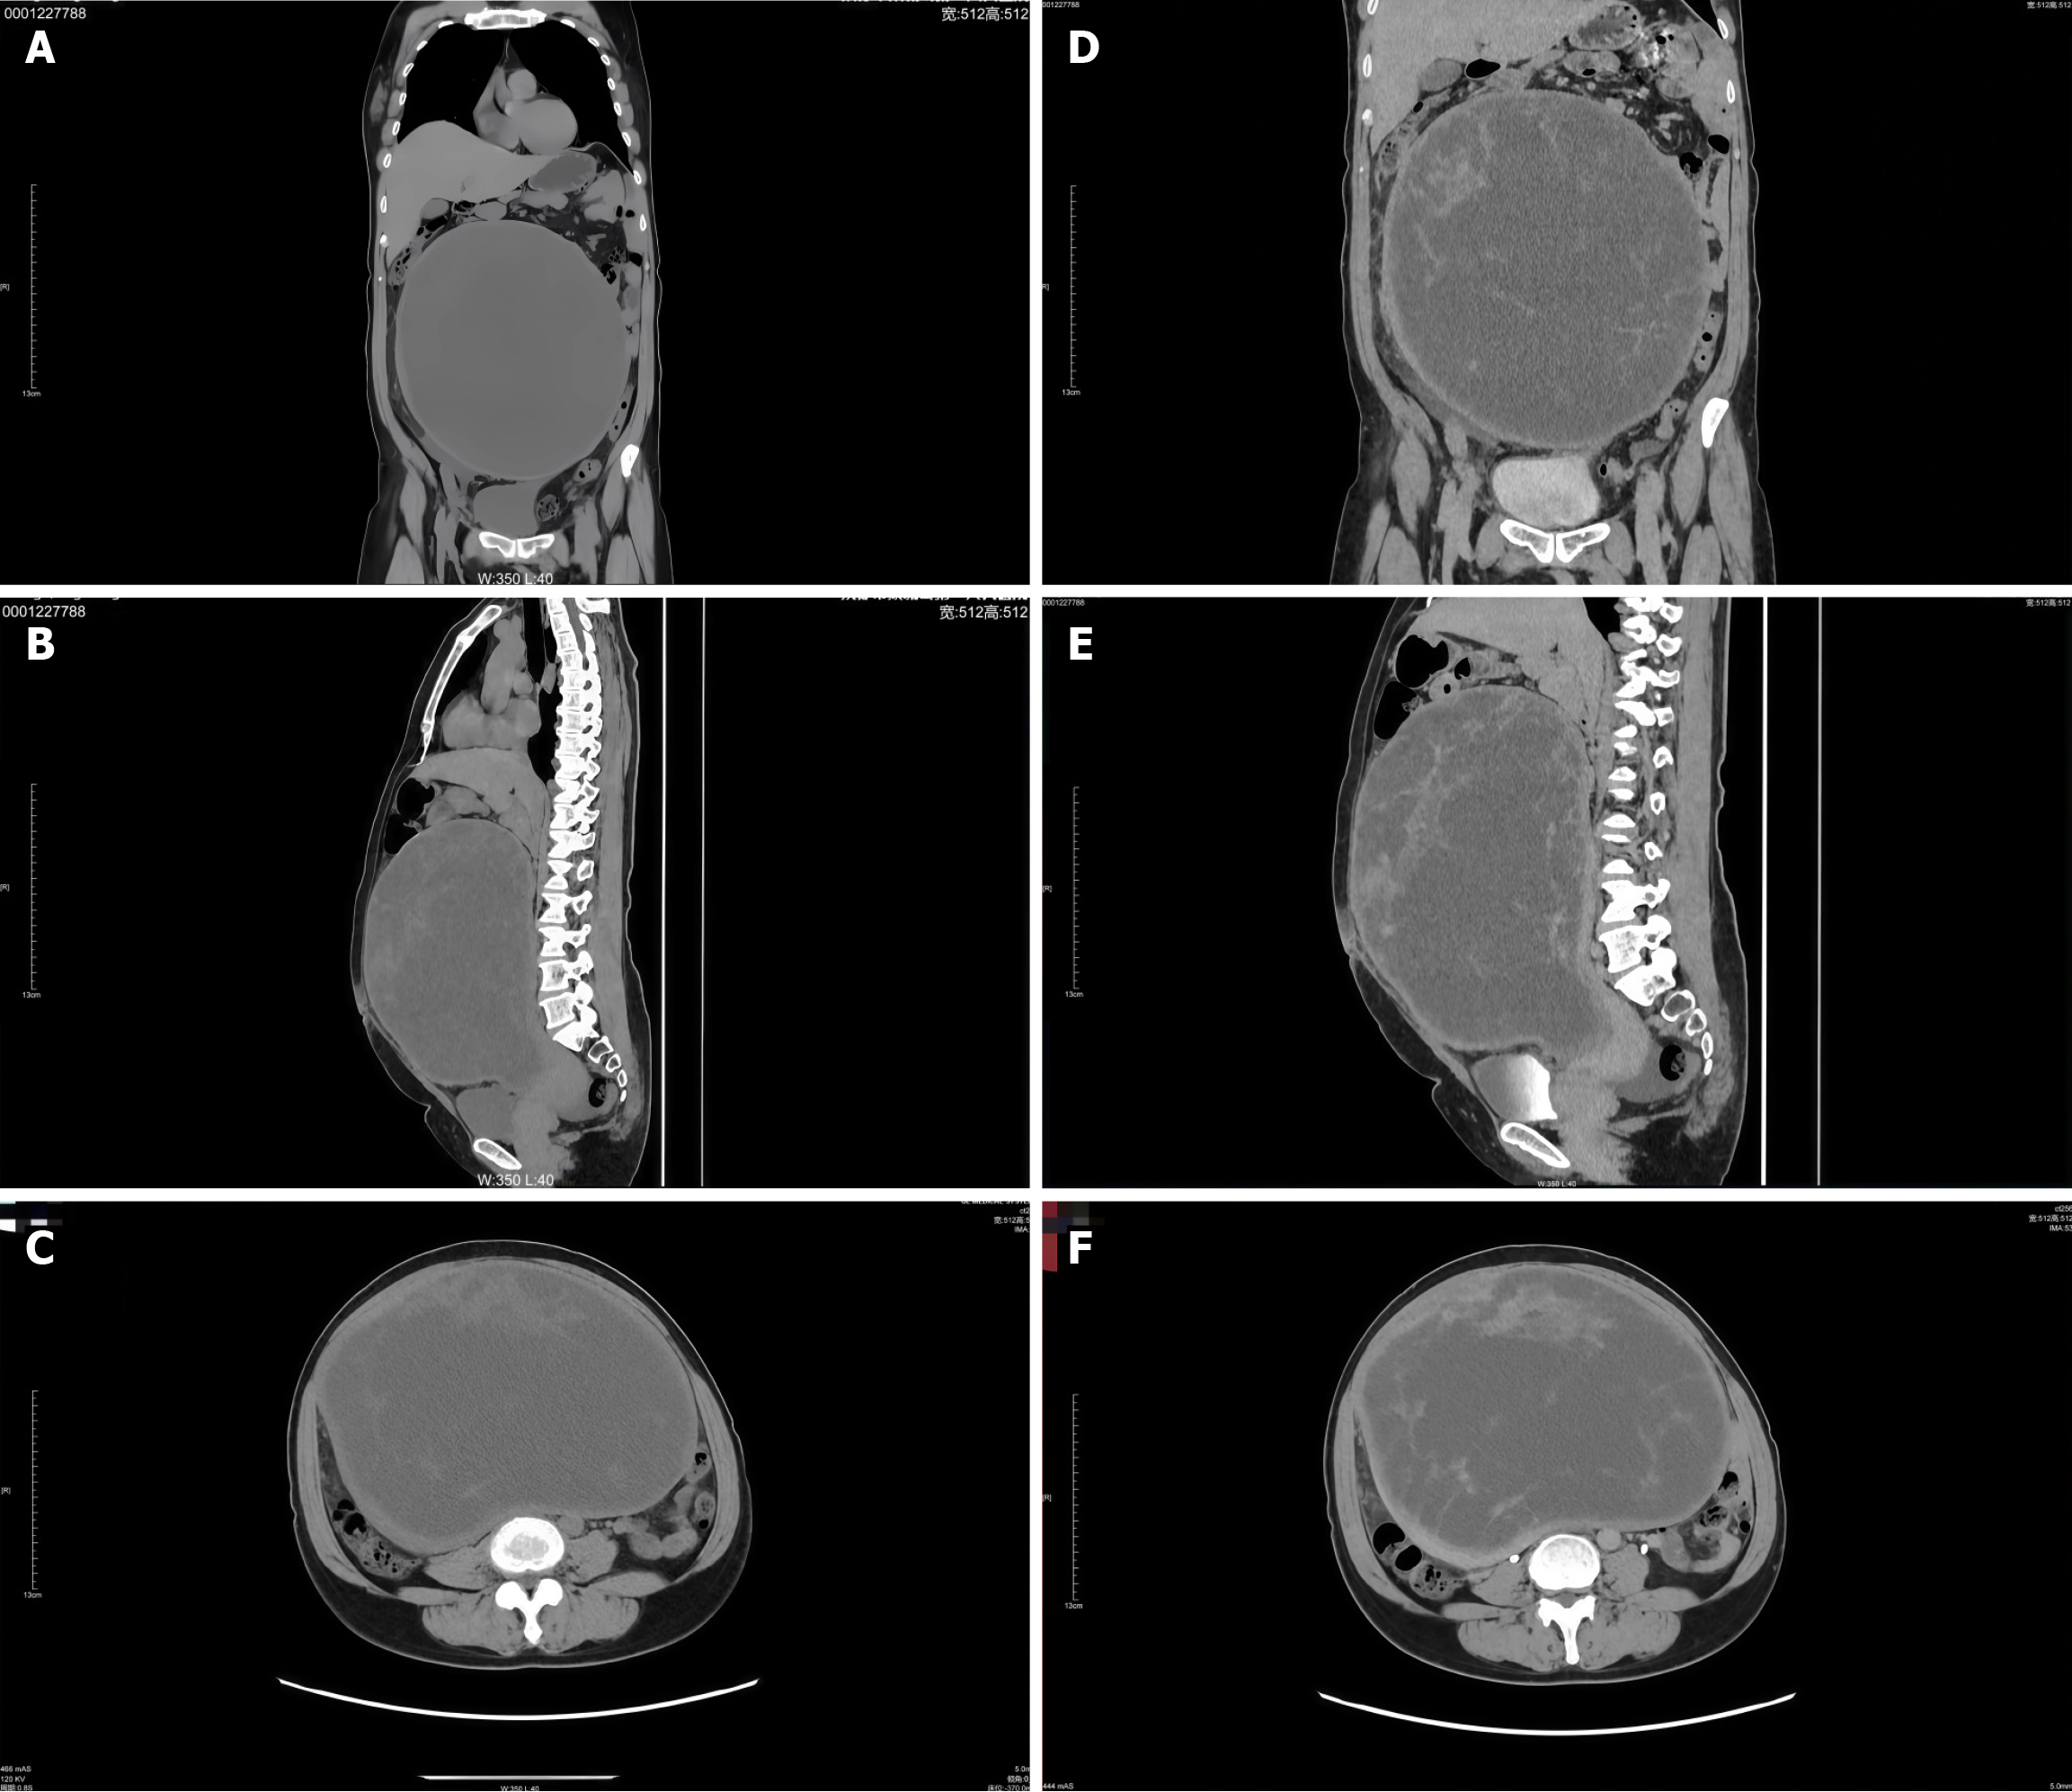
Figure 1 Computed tomography images of the pelvic cavity mass.
A: Coronal section without contrast; B: Sagittal section without contrast; C: Axial section without contrast; D: Coronal section with contrast enhancement; E: Sagittal section with contrast enhancement; F: Axial section with contrast enhancement.
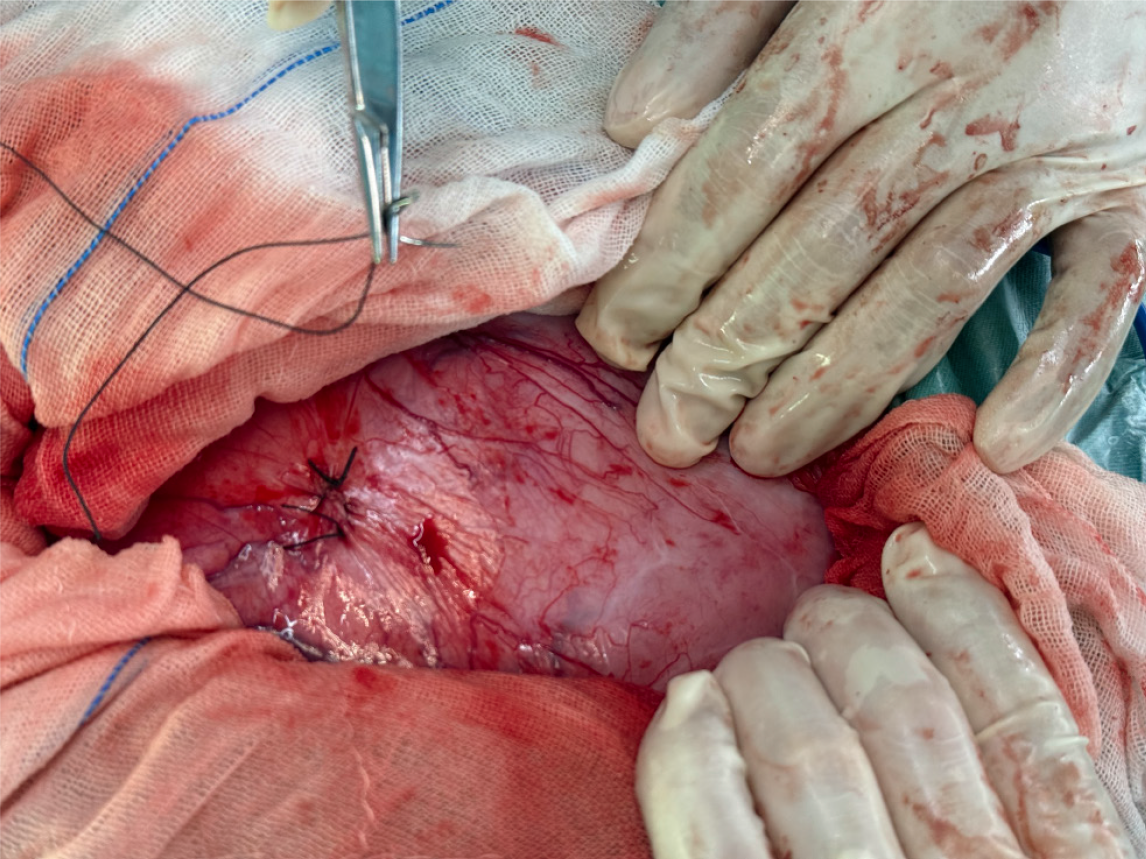
Figure 2
Imaging of the mass after decompression treatment, showing reduced size and structural changes.
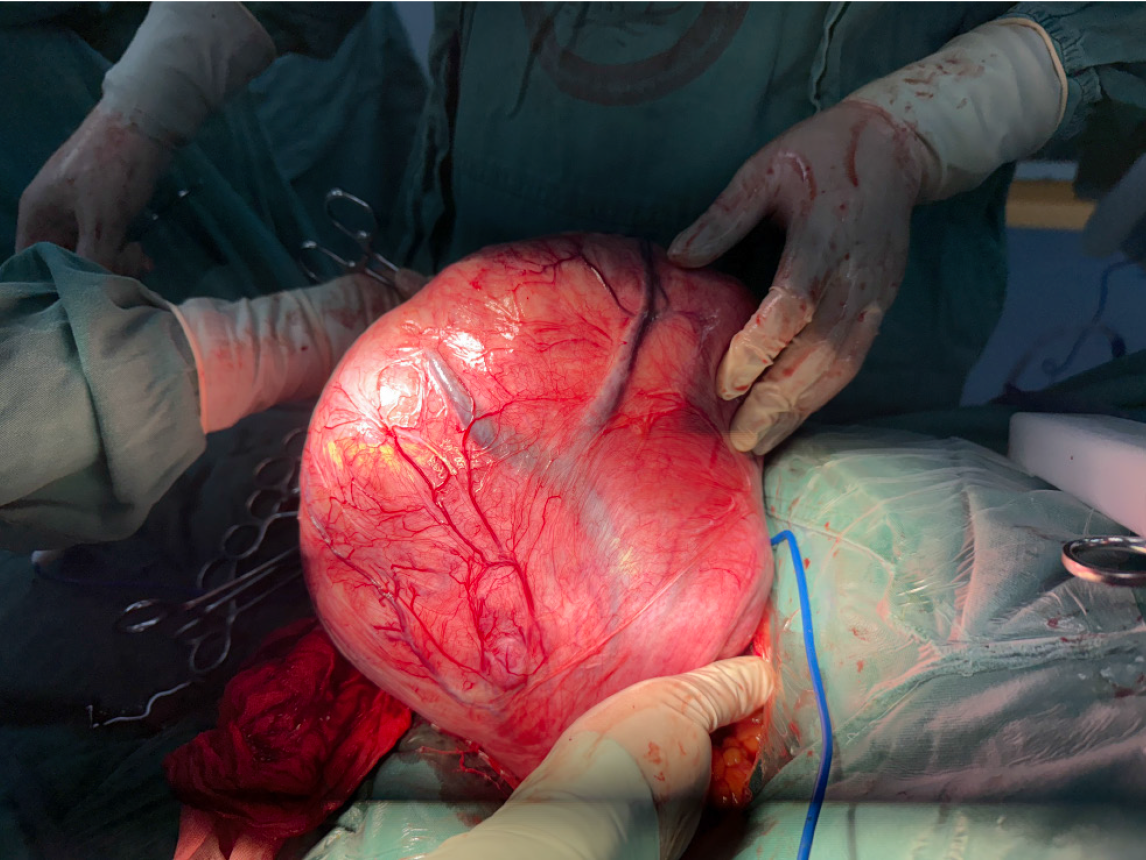
Figure 3
The mass, removed from the abdominal cavity and positioned externally, exhibits prominent surface vascular engorgement.
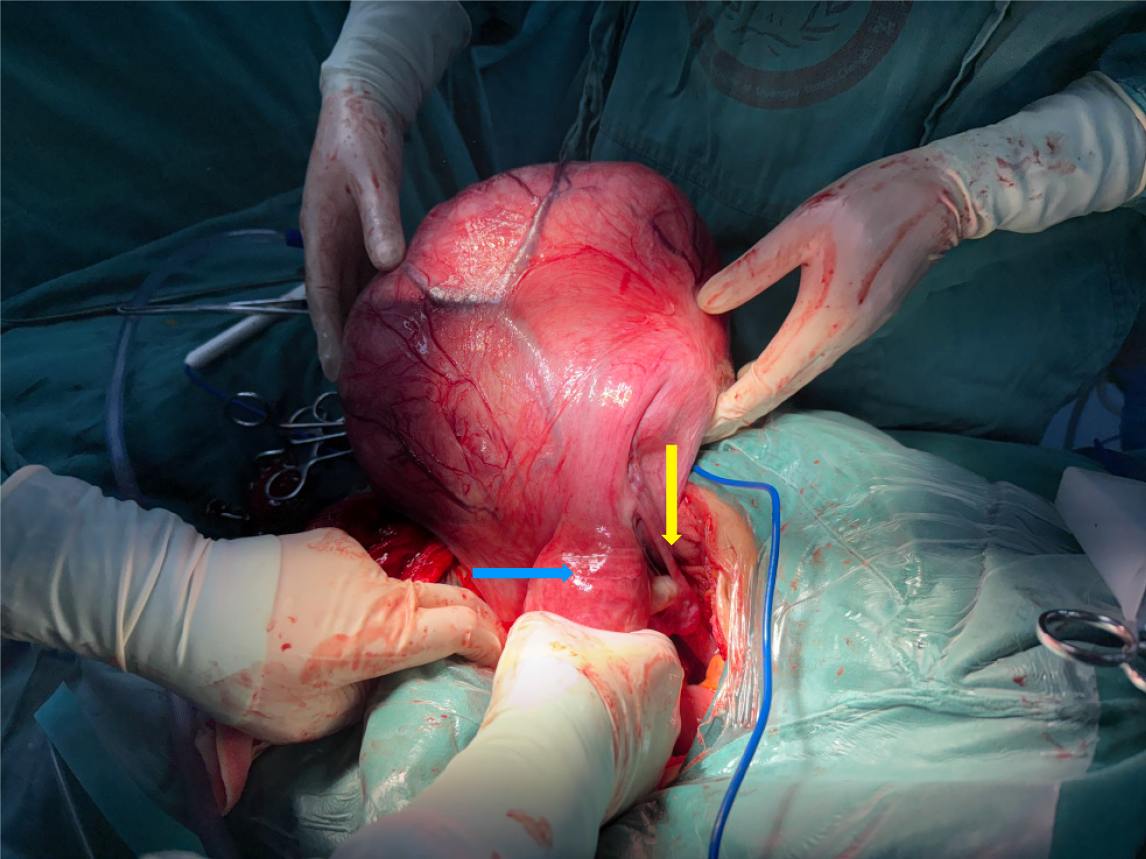
Figure 4
The blue arrow denotes the normal-sized uterus, and the yellow arrow identifies the normal ovarian tissue.
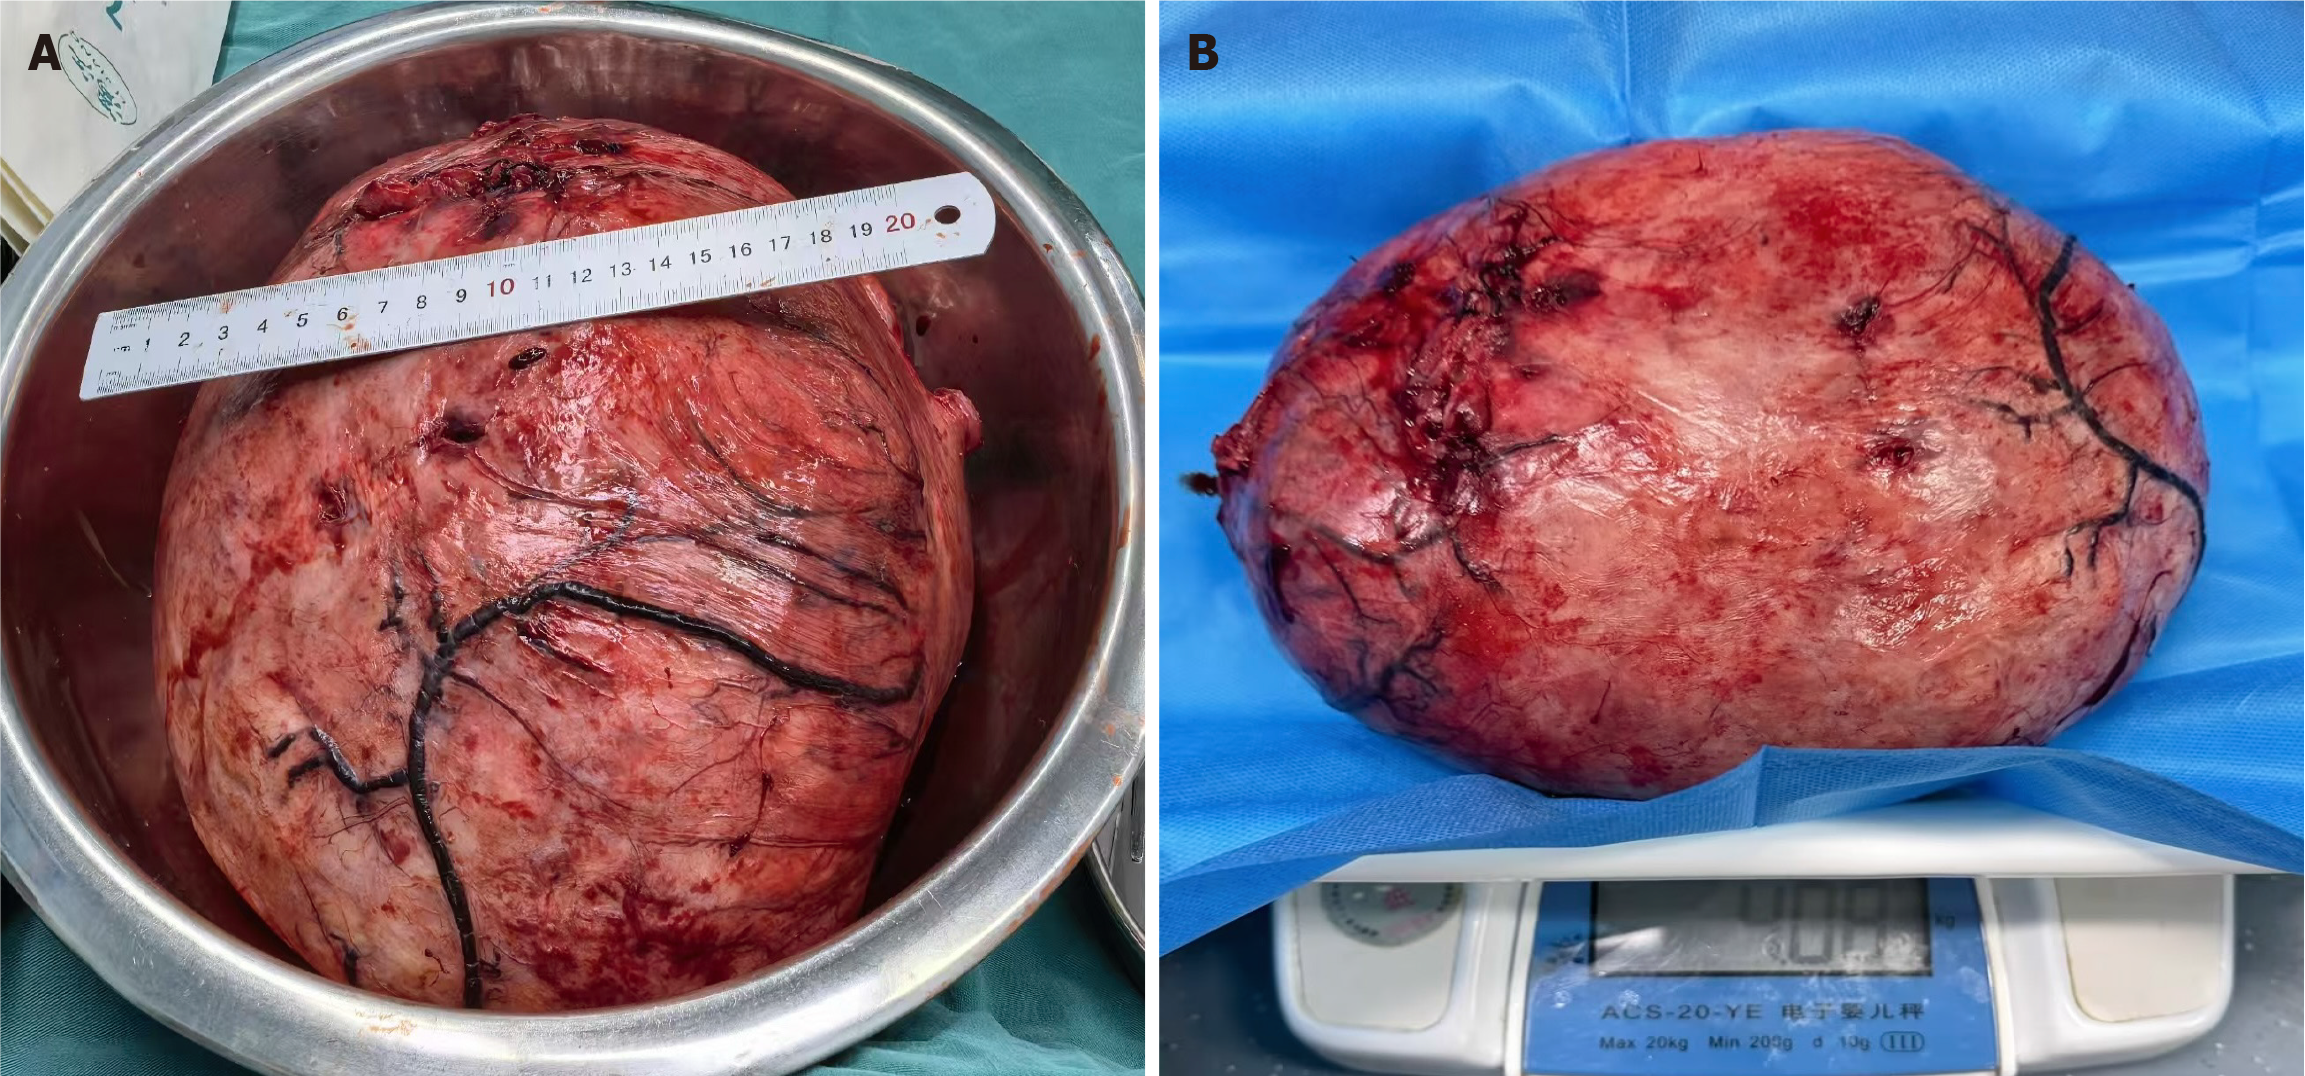
Figure 5 The tumor size and weight were further confirmed using a ruler and a weighing scale after resection.
A: Tumor size; B: Tumor weight.
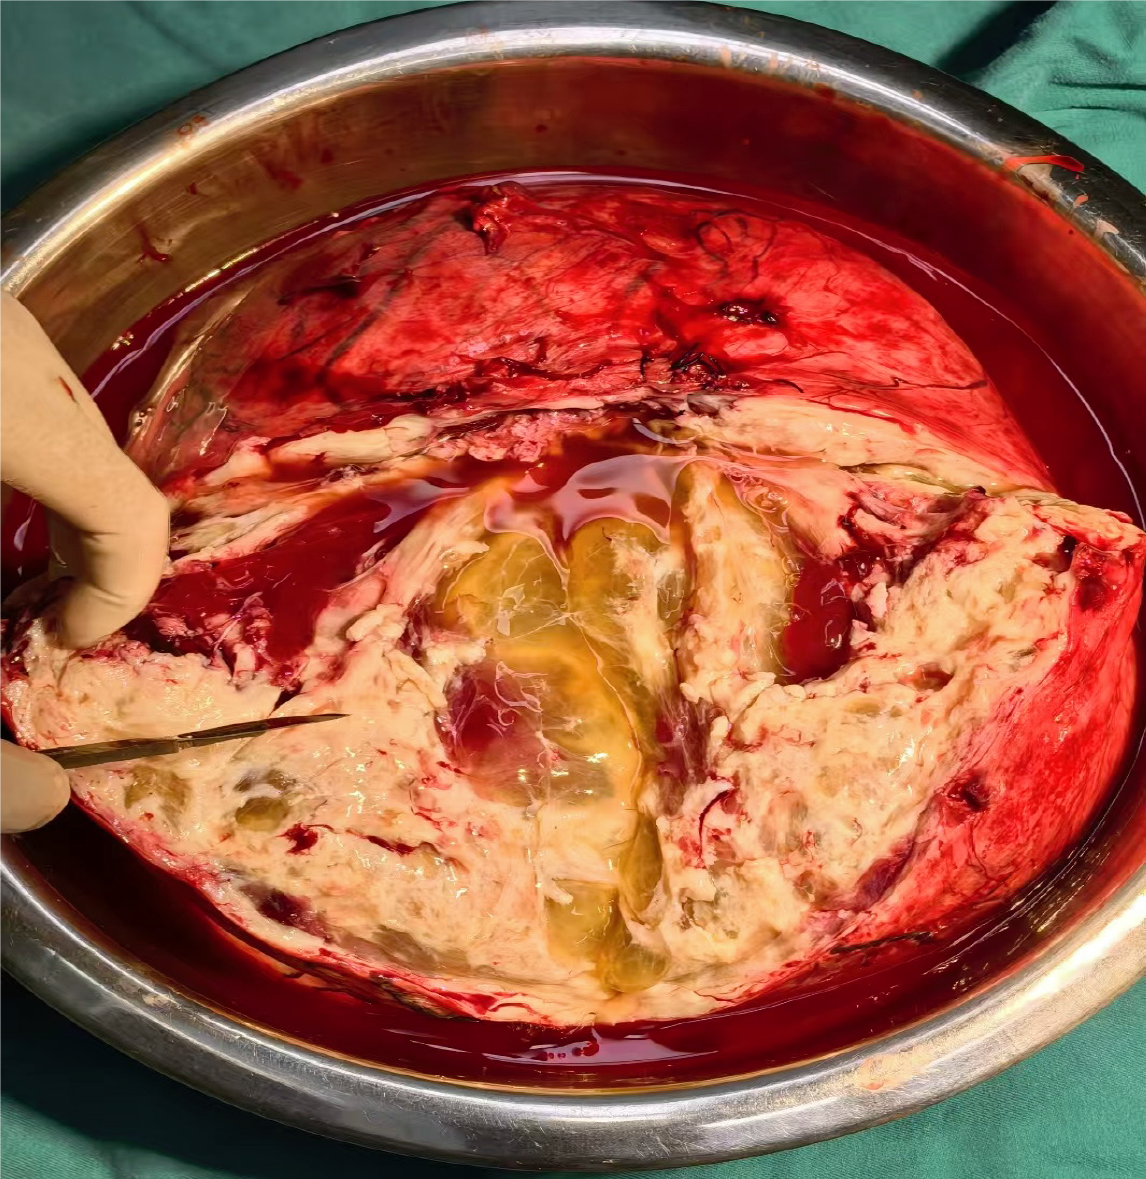
Figure 6
The incised tumor revealed features suggestive of cystic degeneration.
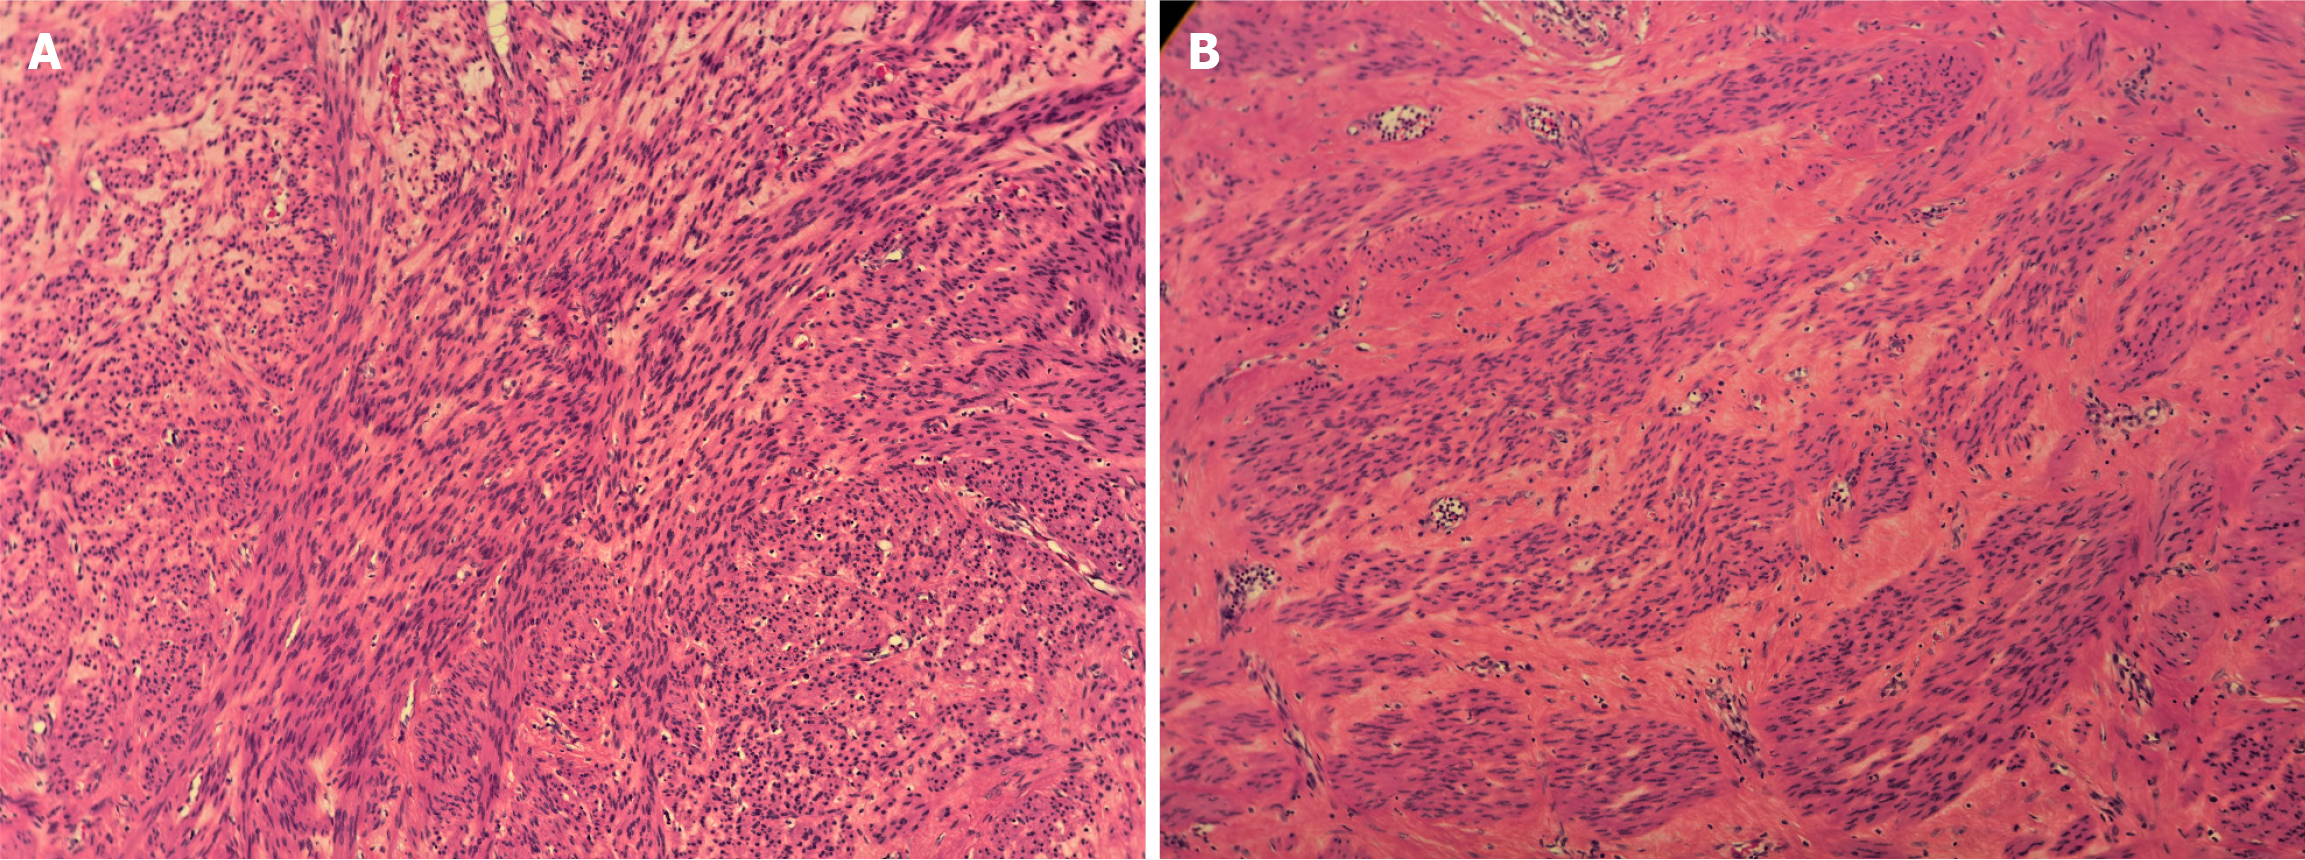
Figure 7 Postoperative histopathological examination of leiomyoma with hematoxylin–eosin staining at 200 × magnification.
A: Disorganized bundles of smooth muscle fibers showing a chaotic arrangement; B: Smooth muscle bundles with interstitial hemorrhage, demonstrated by red blood cells present between muscle fibers.
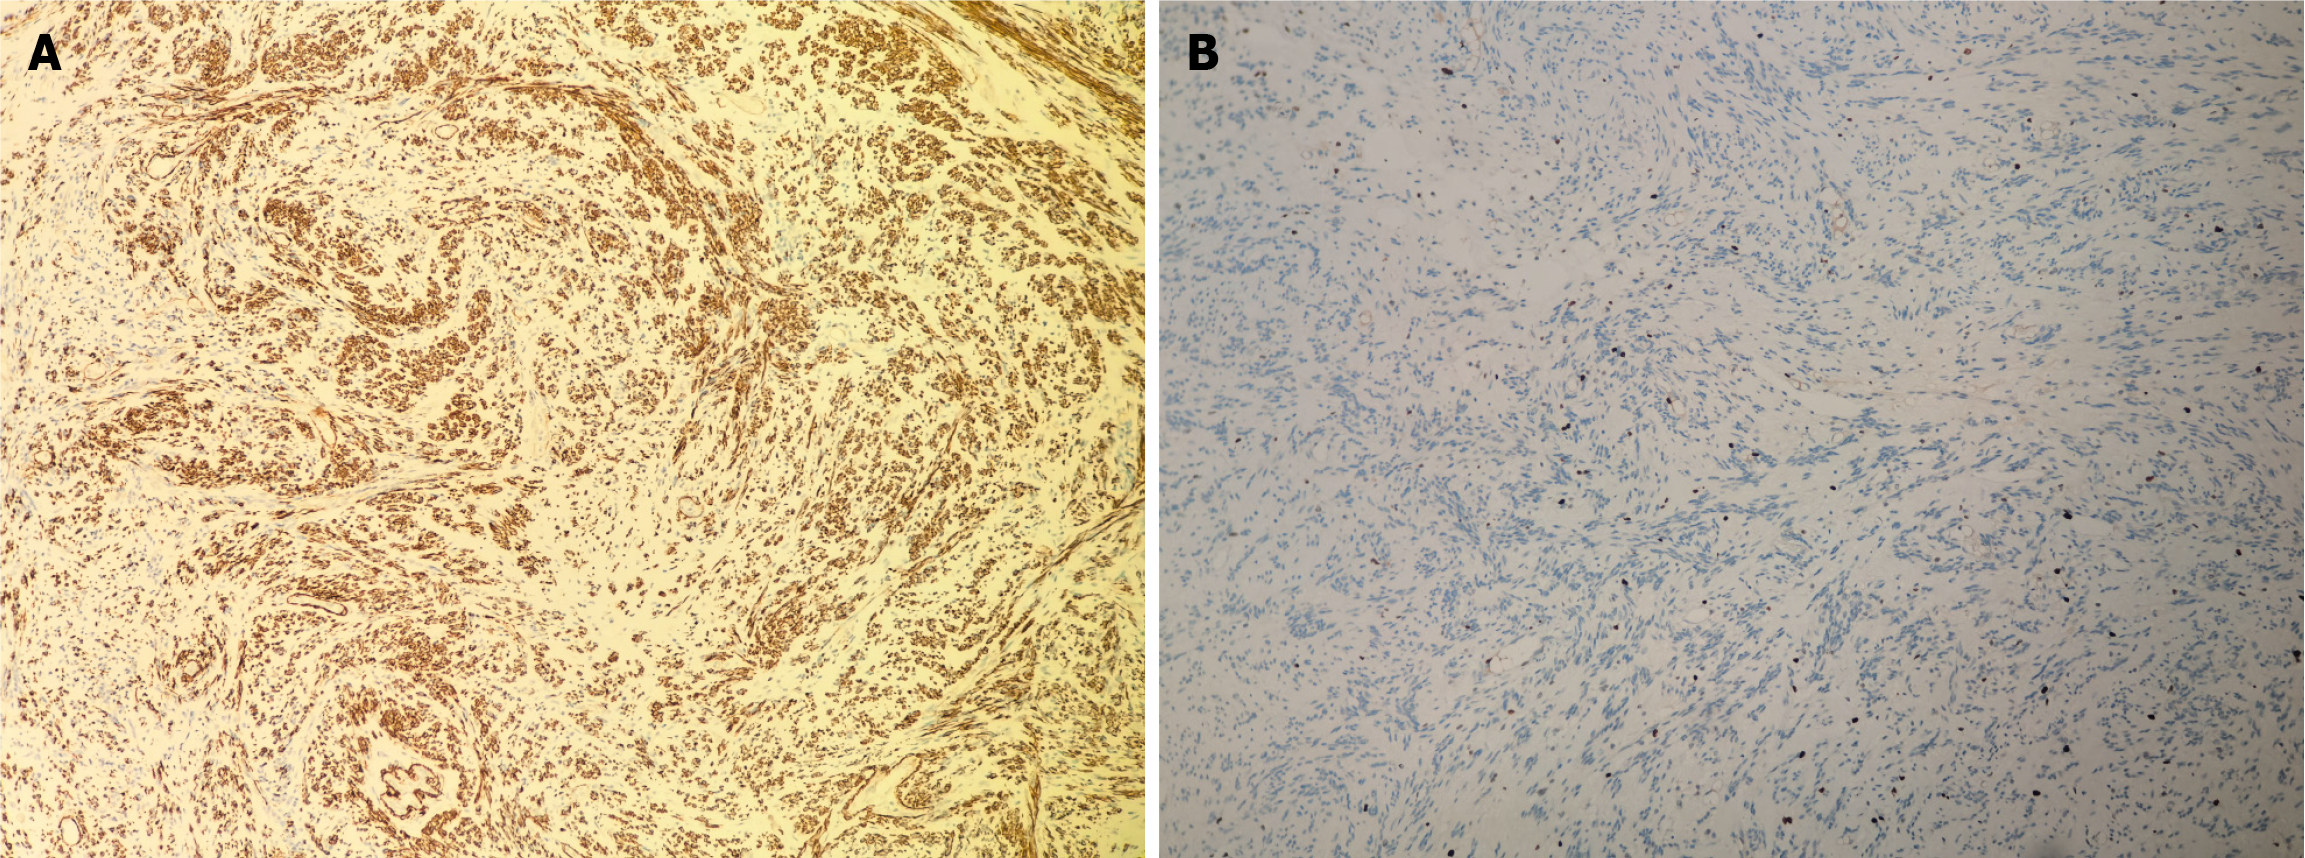
Figure 8 Postoperative immunohistochemical examination showing typical caldesmon expression and Ki-67 proliferation index.
A: Typical positive staining for caldesmon; B: Ki-67 immunostaining showing approximately 1% positivity.
- Citation: Huang X, Yao Q, Wu YC, Liu SC. Diagnostic and surgical management of giant broad ligament myoma with cystic degeneration: A case report. World J Clin Cases 2025; 13(27): 108923
- URL: https://www.wjgnet.com/2307-8960/full/v13/i27/108923.htm
- DOI: https://dx.doi.org/10.12998/wjcc.v13.i27.108923


