©The Author(s) 2025.
World J Clin Cases. Sep 26, 2025; 13(27): 108868
Published online Sep 26, 2025. doi: 10.12998/wjcc.v13.i27.108868
Published online Sep 26, 2025. doi: 10.12998/wjcc.v13.i27.108868
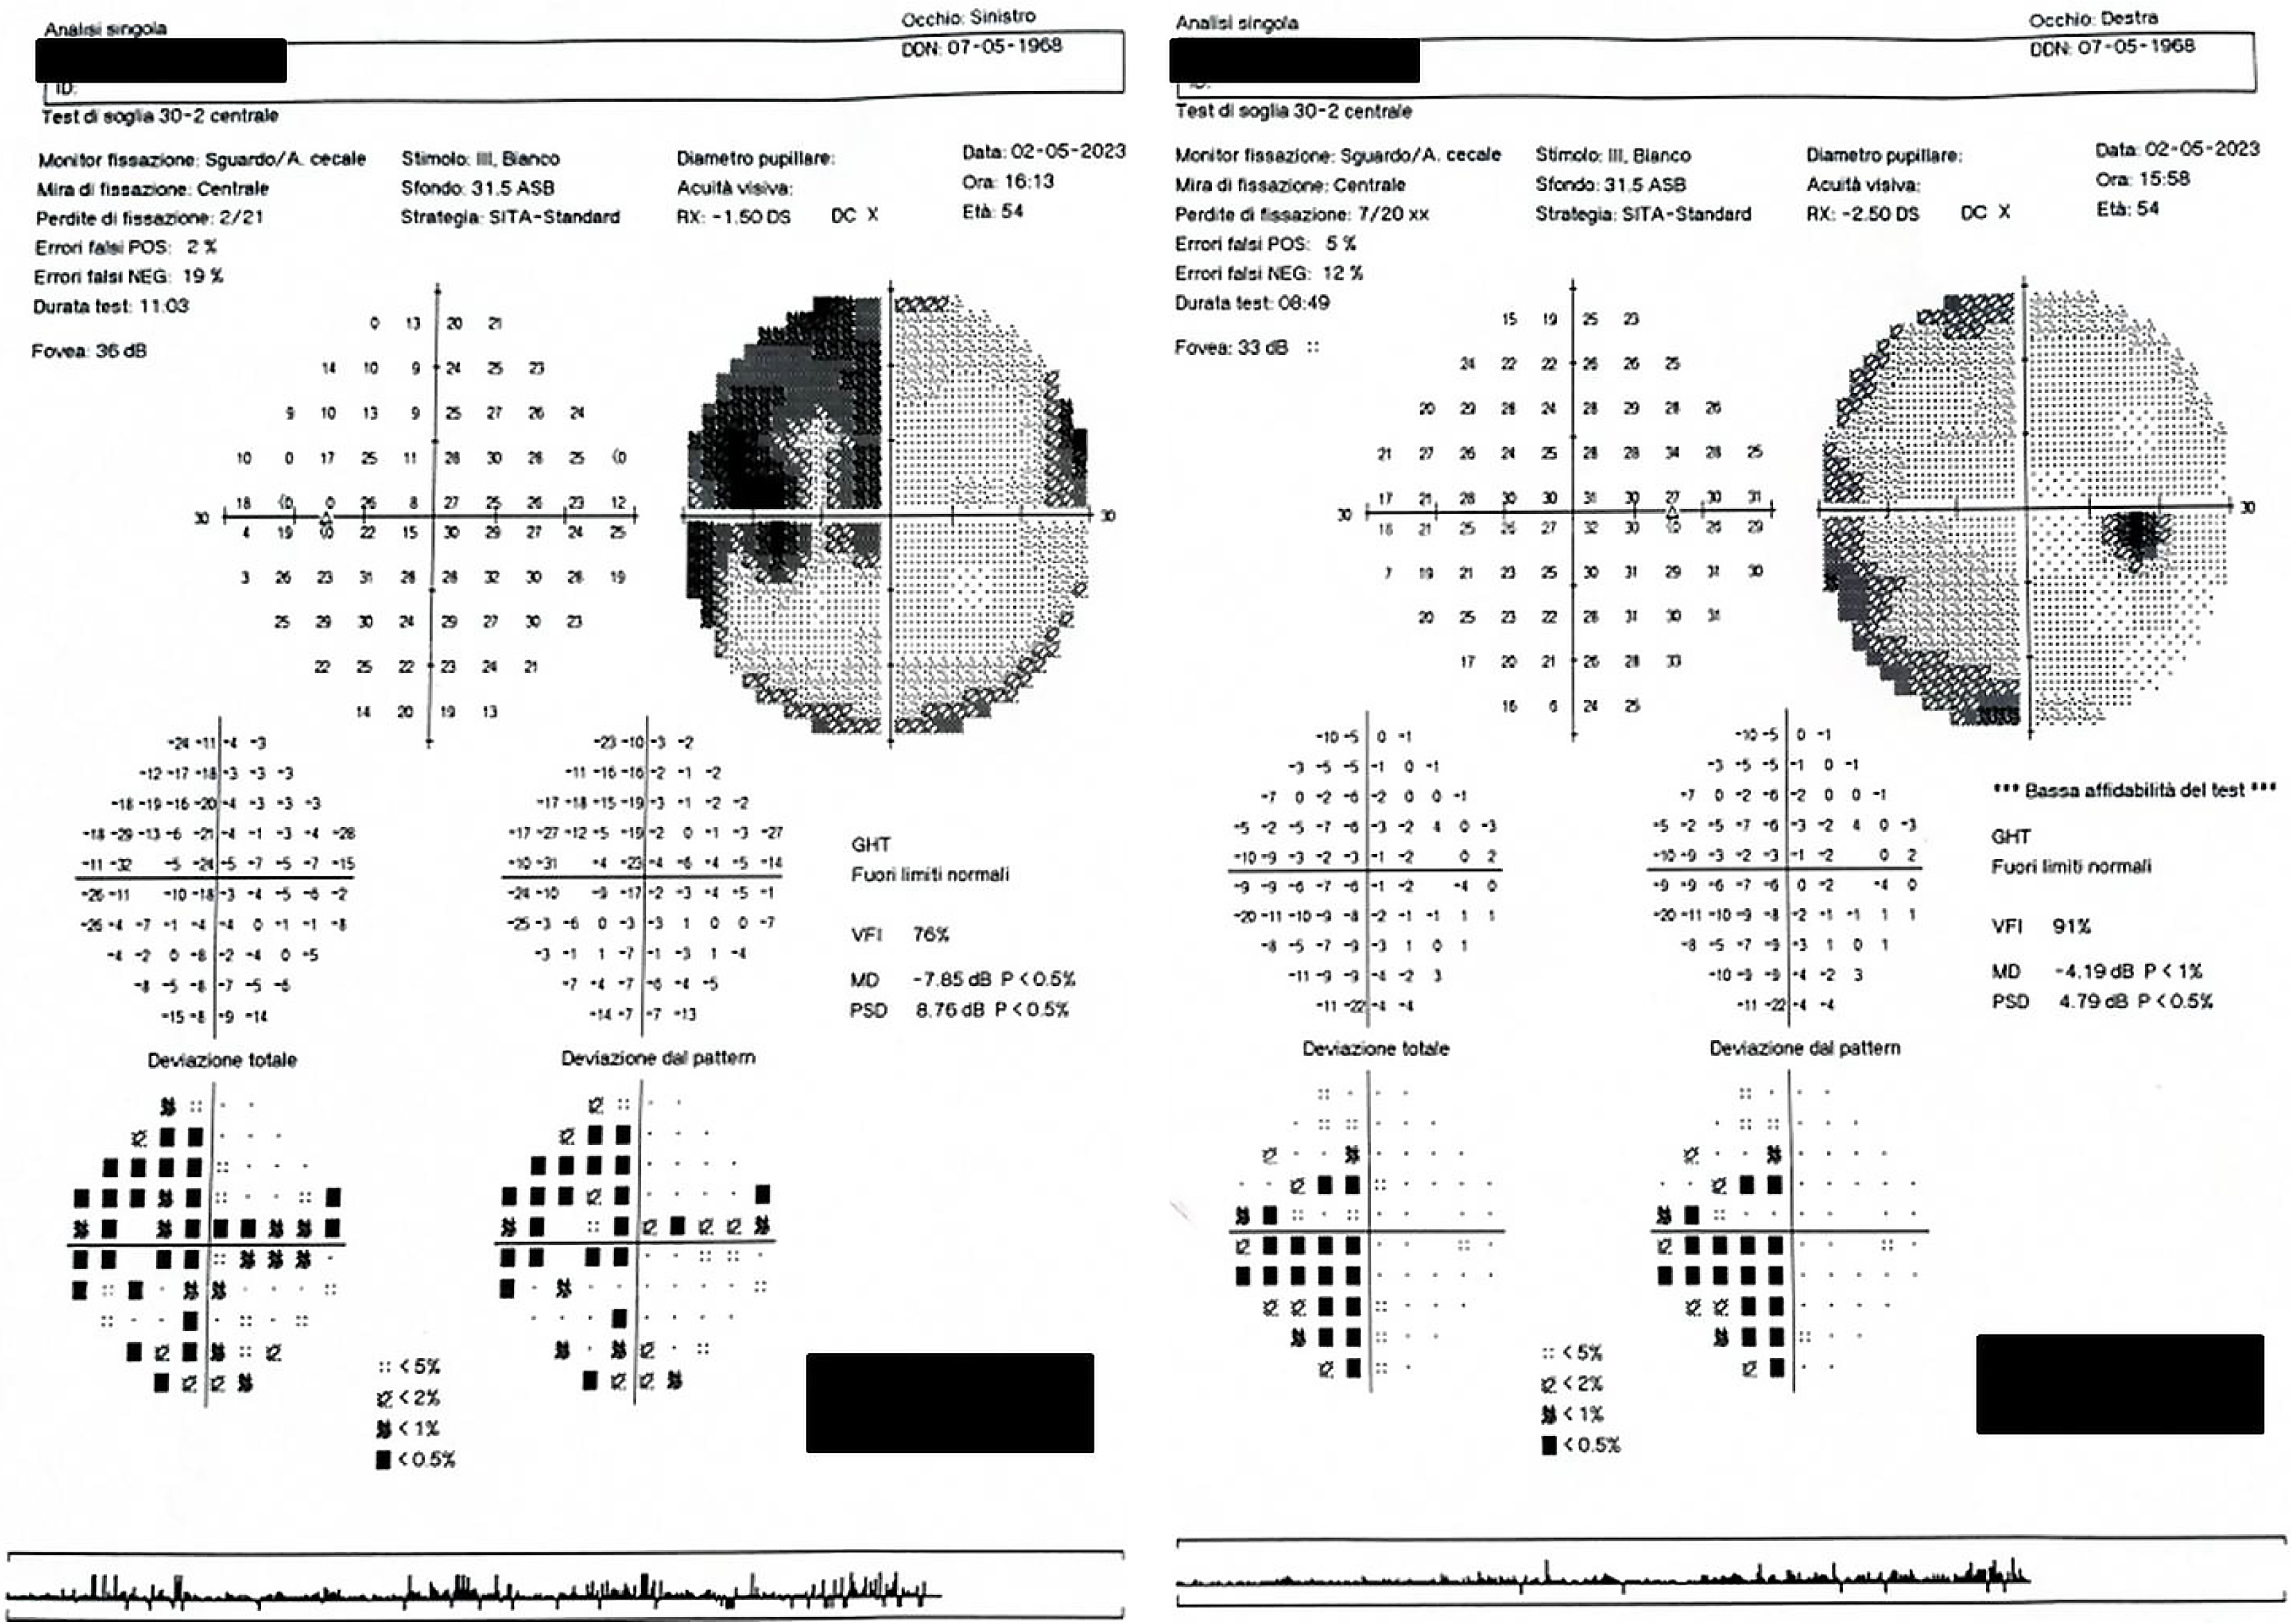
Figure 1
Standard automated 30-2 perimetry shows left homonymous hemianopia.
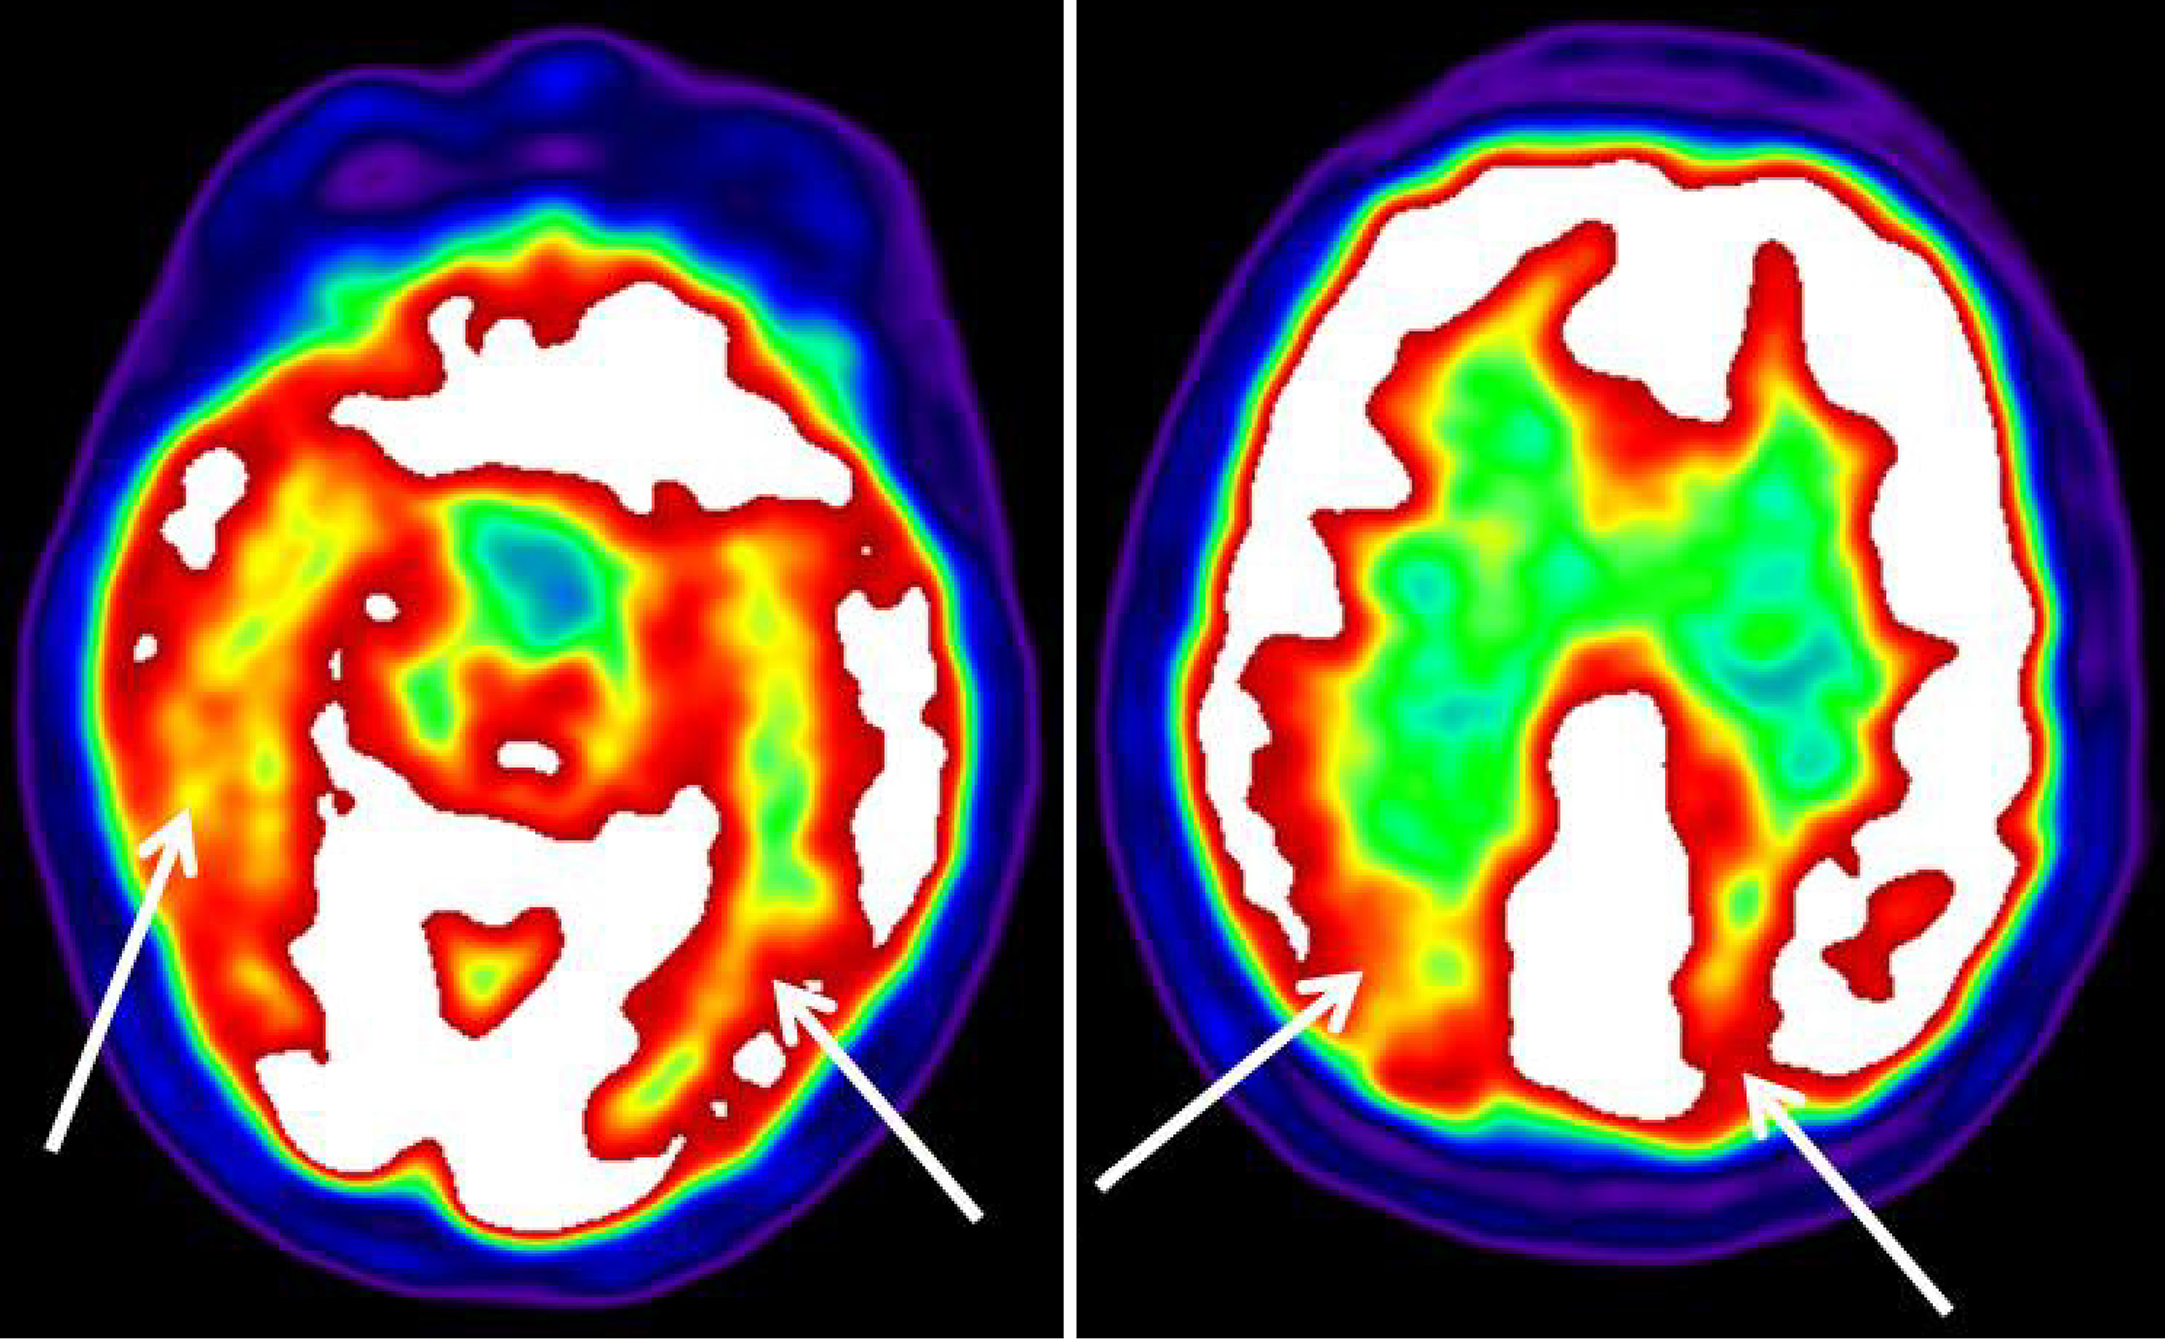
Figure 2 18F-fluorodeoxyglucose positron emission tomography shows hypometabolism bilaterally (arrows), denser on the right.
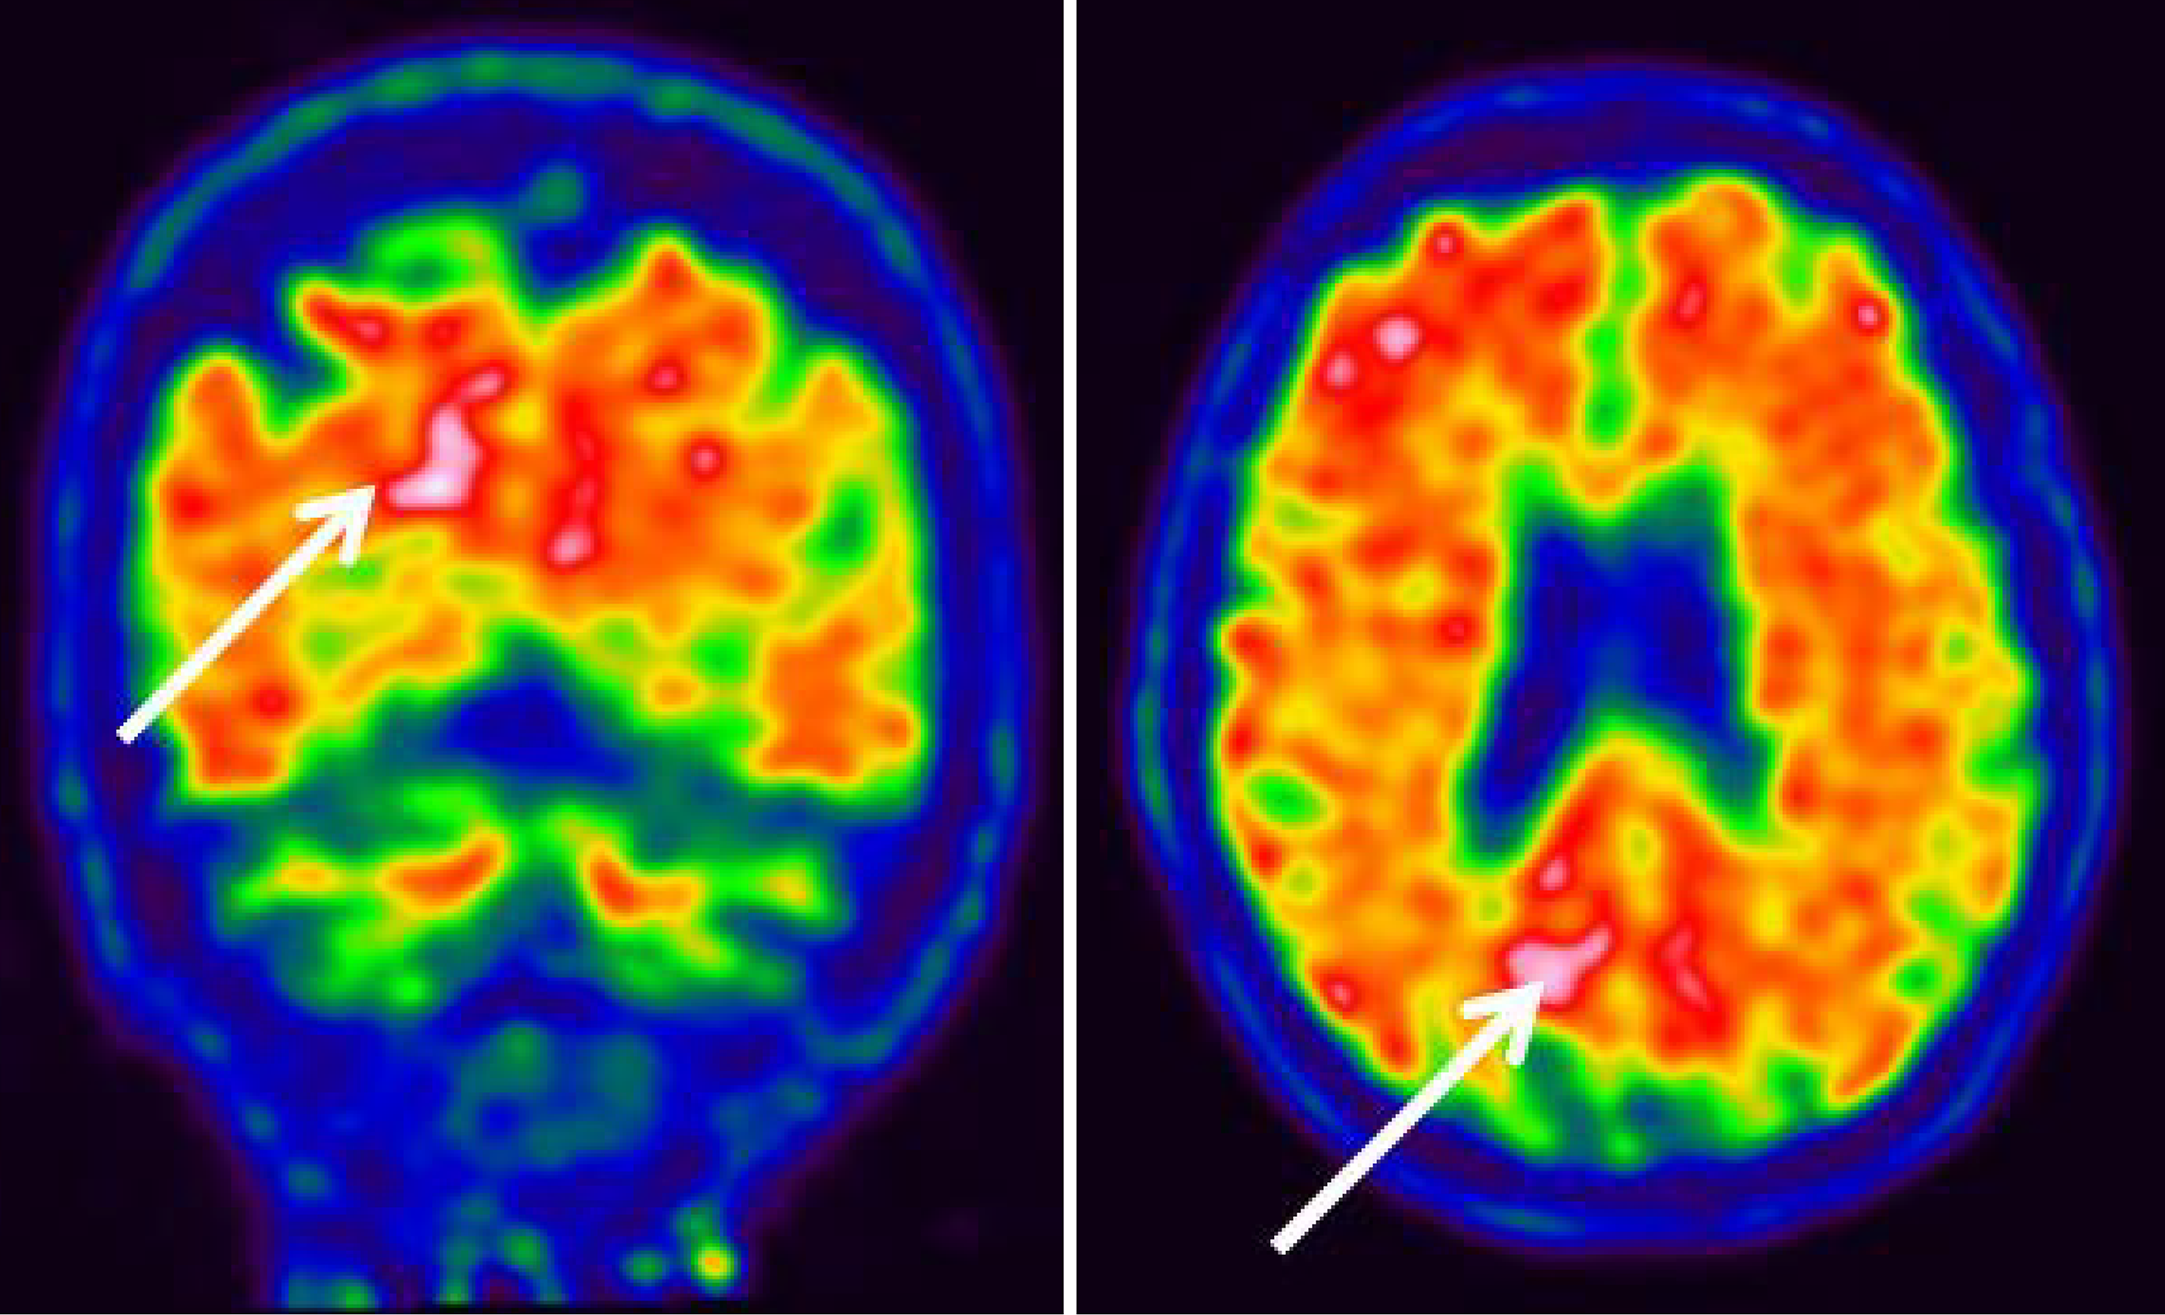
Analysis of amyloid positron emission tomography using 18F-flutemetamol showed abnormal uptake also in the posterior (occipital) cortex, with stronger signal on the right (Figure 3).
Figure 3
Amyloid 18F-flutemetamol positron emission tomography shows abnormal uptake in the occipital right cortex (arrows).
- Citation: Pellegrini F, Cuna A, Musa M, D’Esposito F, Giglio R, Tognetto D, Gagliano C, Zeppieri M. Ishihara color plates utilized as an assessment for simultanagnosia in posterior cortical atrophy: A case report. World J Clin Cases 2025; 13(27): 108868
- URL: https://www.wjgnet.com/2307-8960/full/v13/i27/108868.htm
- DOI: https://dx.doi.org/10.12998/wjcc.v13.i27.108868


