©The Author(s) 2025.
World J Clin Cases. Sep 26, 2025; 13(27): 107805
Published online Sep 26, 2025. doi: 10.12998/wjcc.v13.i27.107805
Published online Sep 26, 2025. doi: 10.12998/wjcc.v13.i27.107805
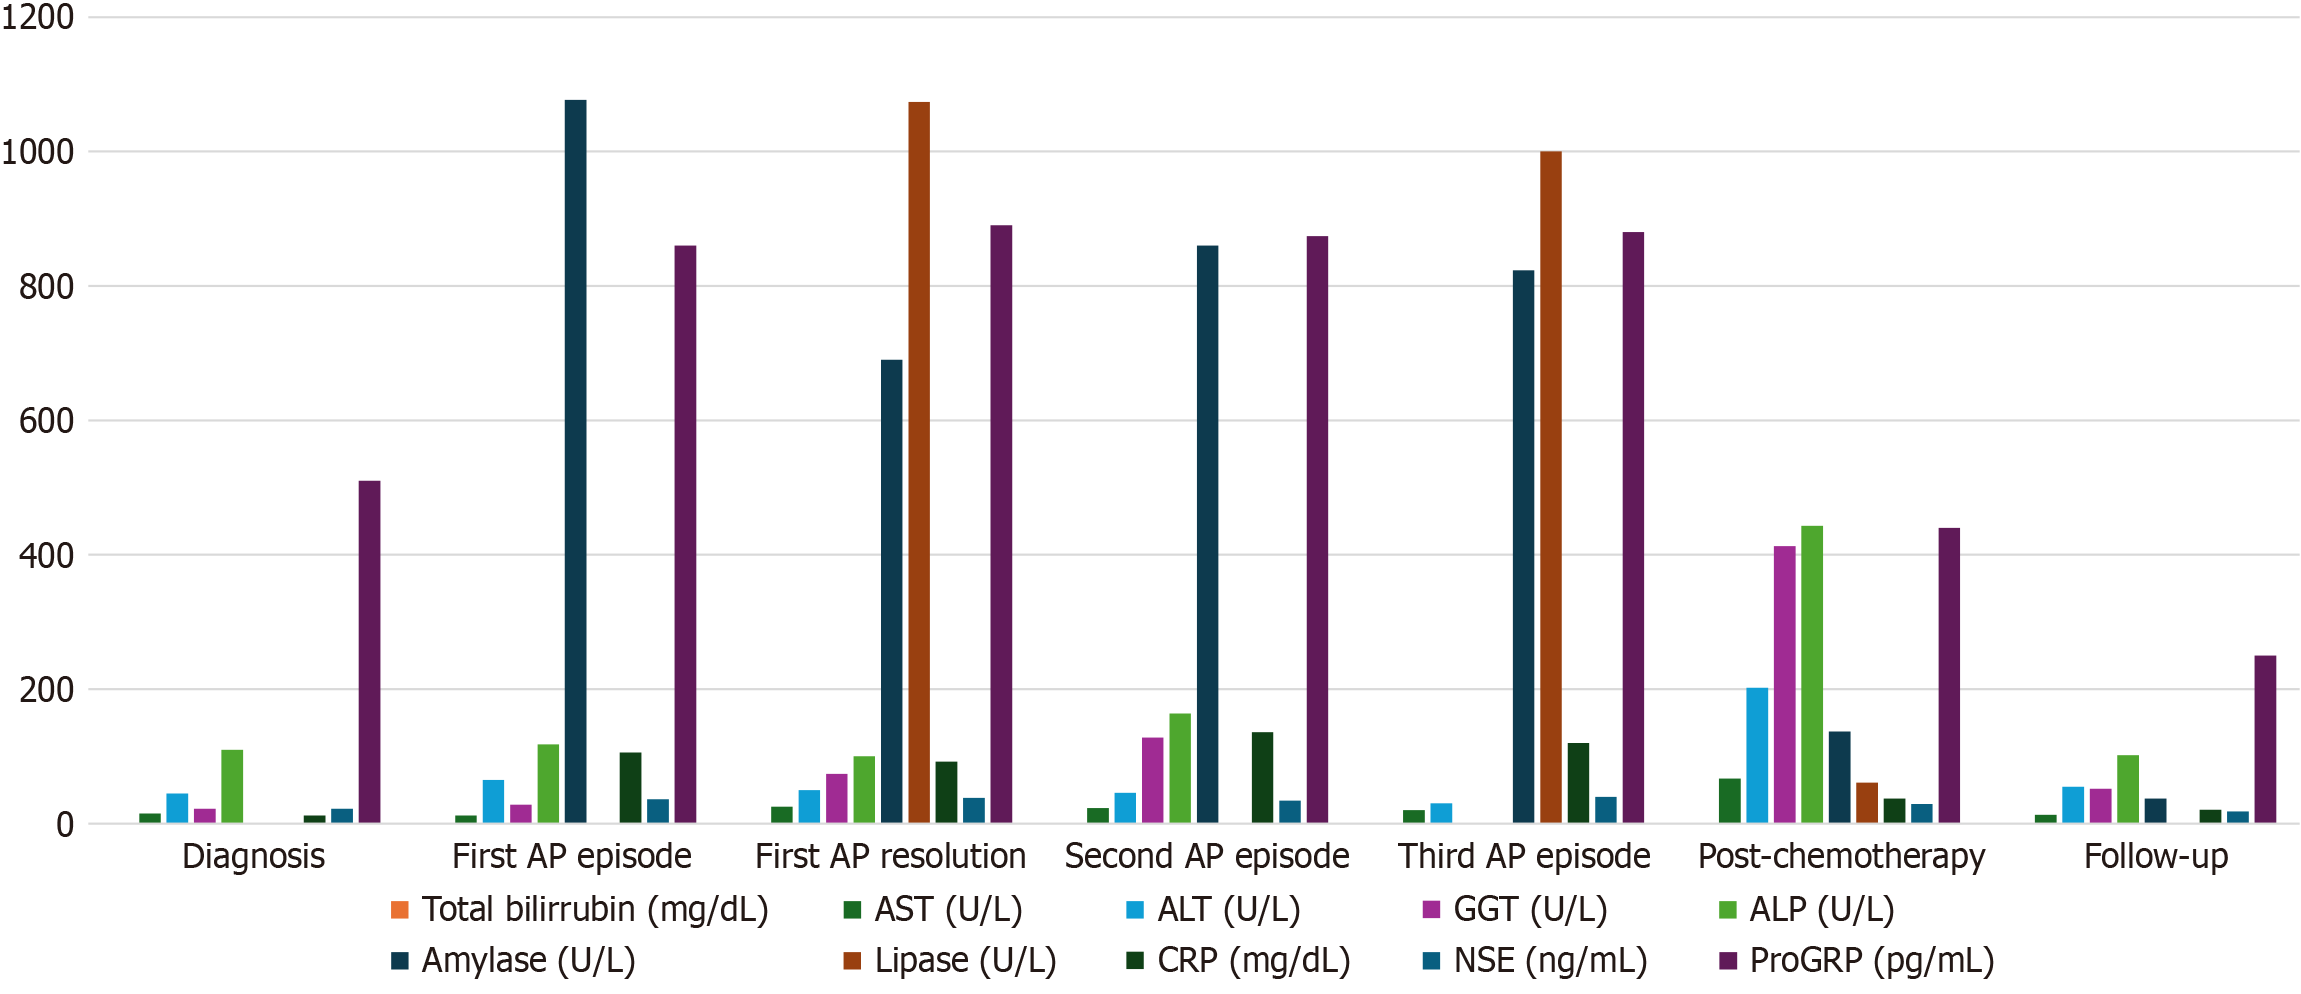
Figure 1 Summary of the analytical evolution during hospitalization for acute pancreatitis and follow-up after four cycles of chemothe
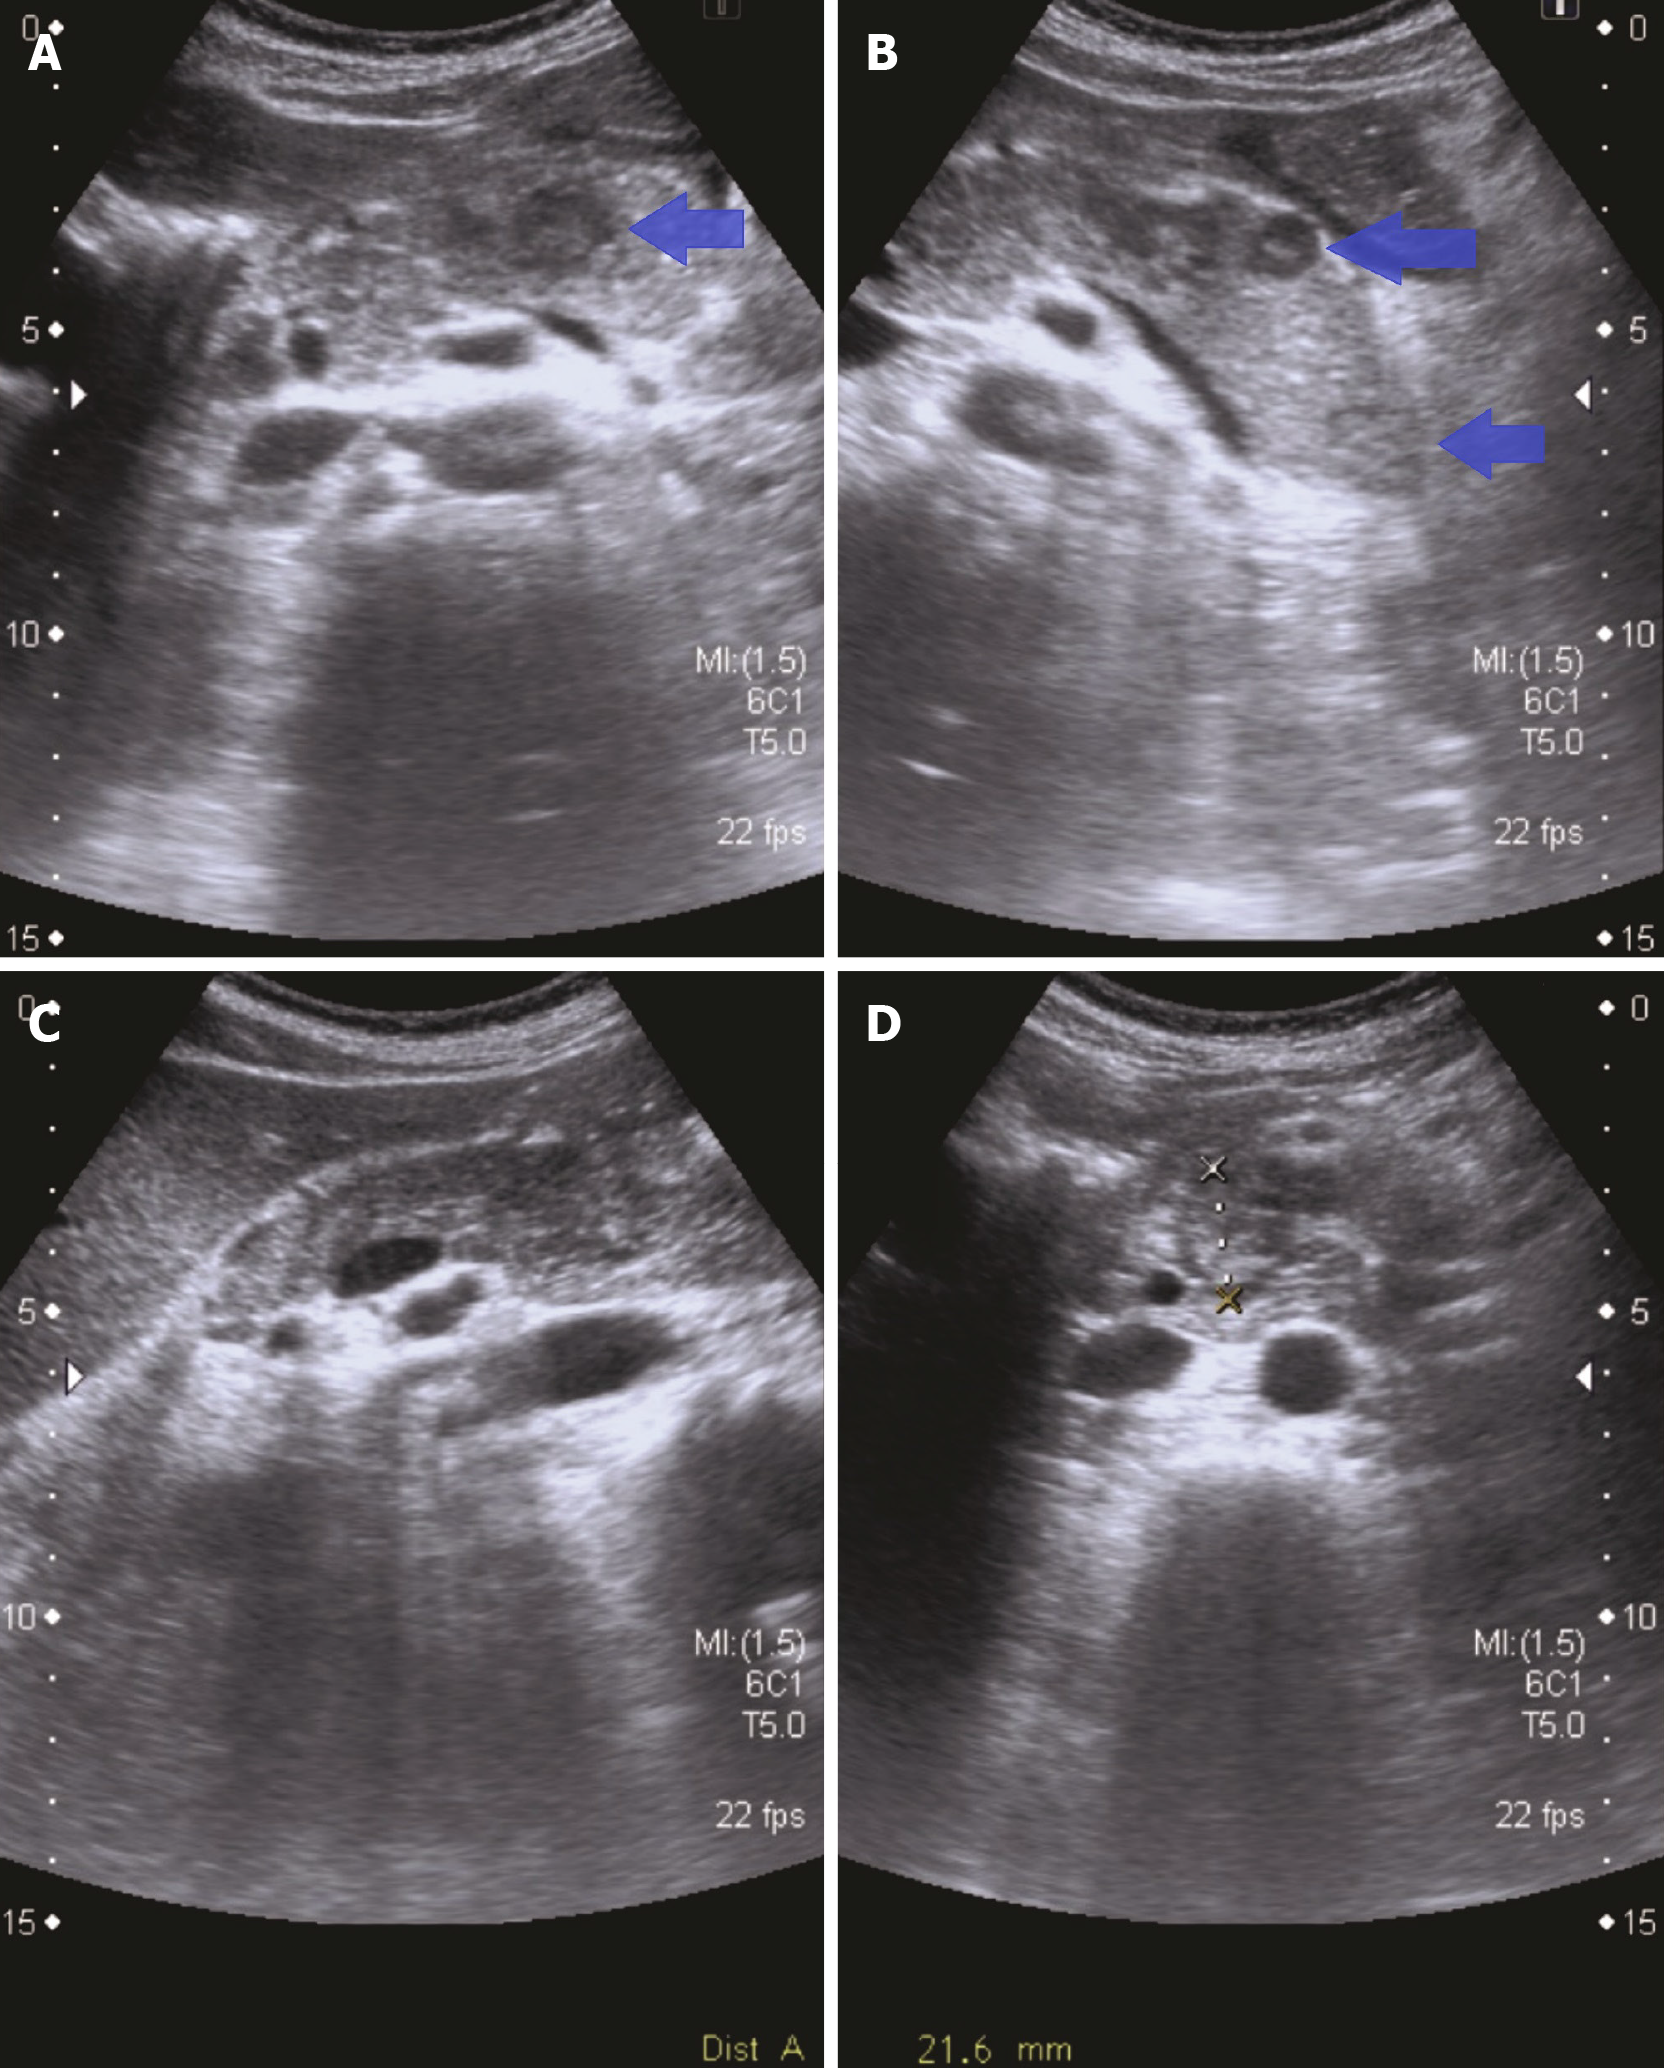
Figure 2 Ultrasound images showing some of the pancreatic metastases (arrows).
The largest one, measuring 21.6 mm, is highlighted. A: Metastatic lesion was identified in the distal pancreatic body; B: Additional lesions were noted in the pancreatic tail region; C: The main lesion, located in the pancreatic body prior to measurement; D: Measurement of the largest lesion (21.6 mm).
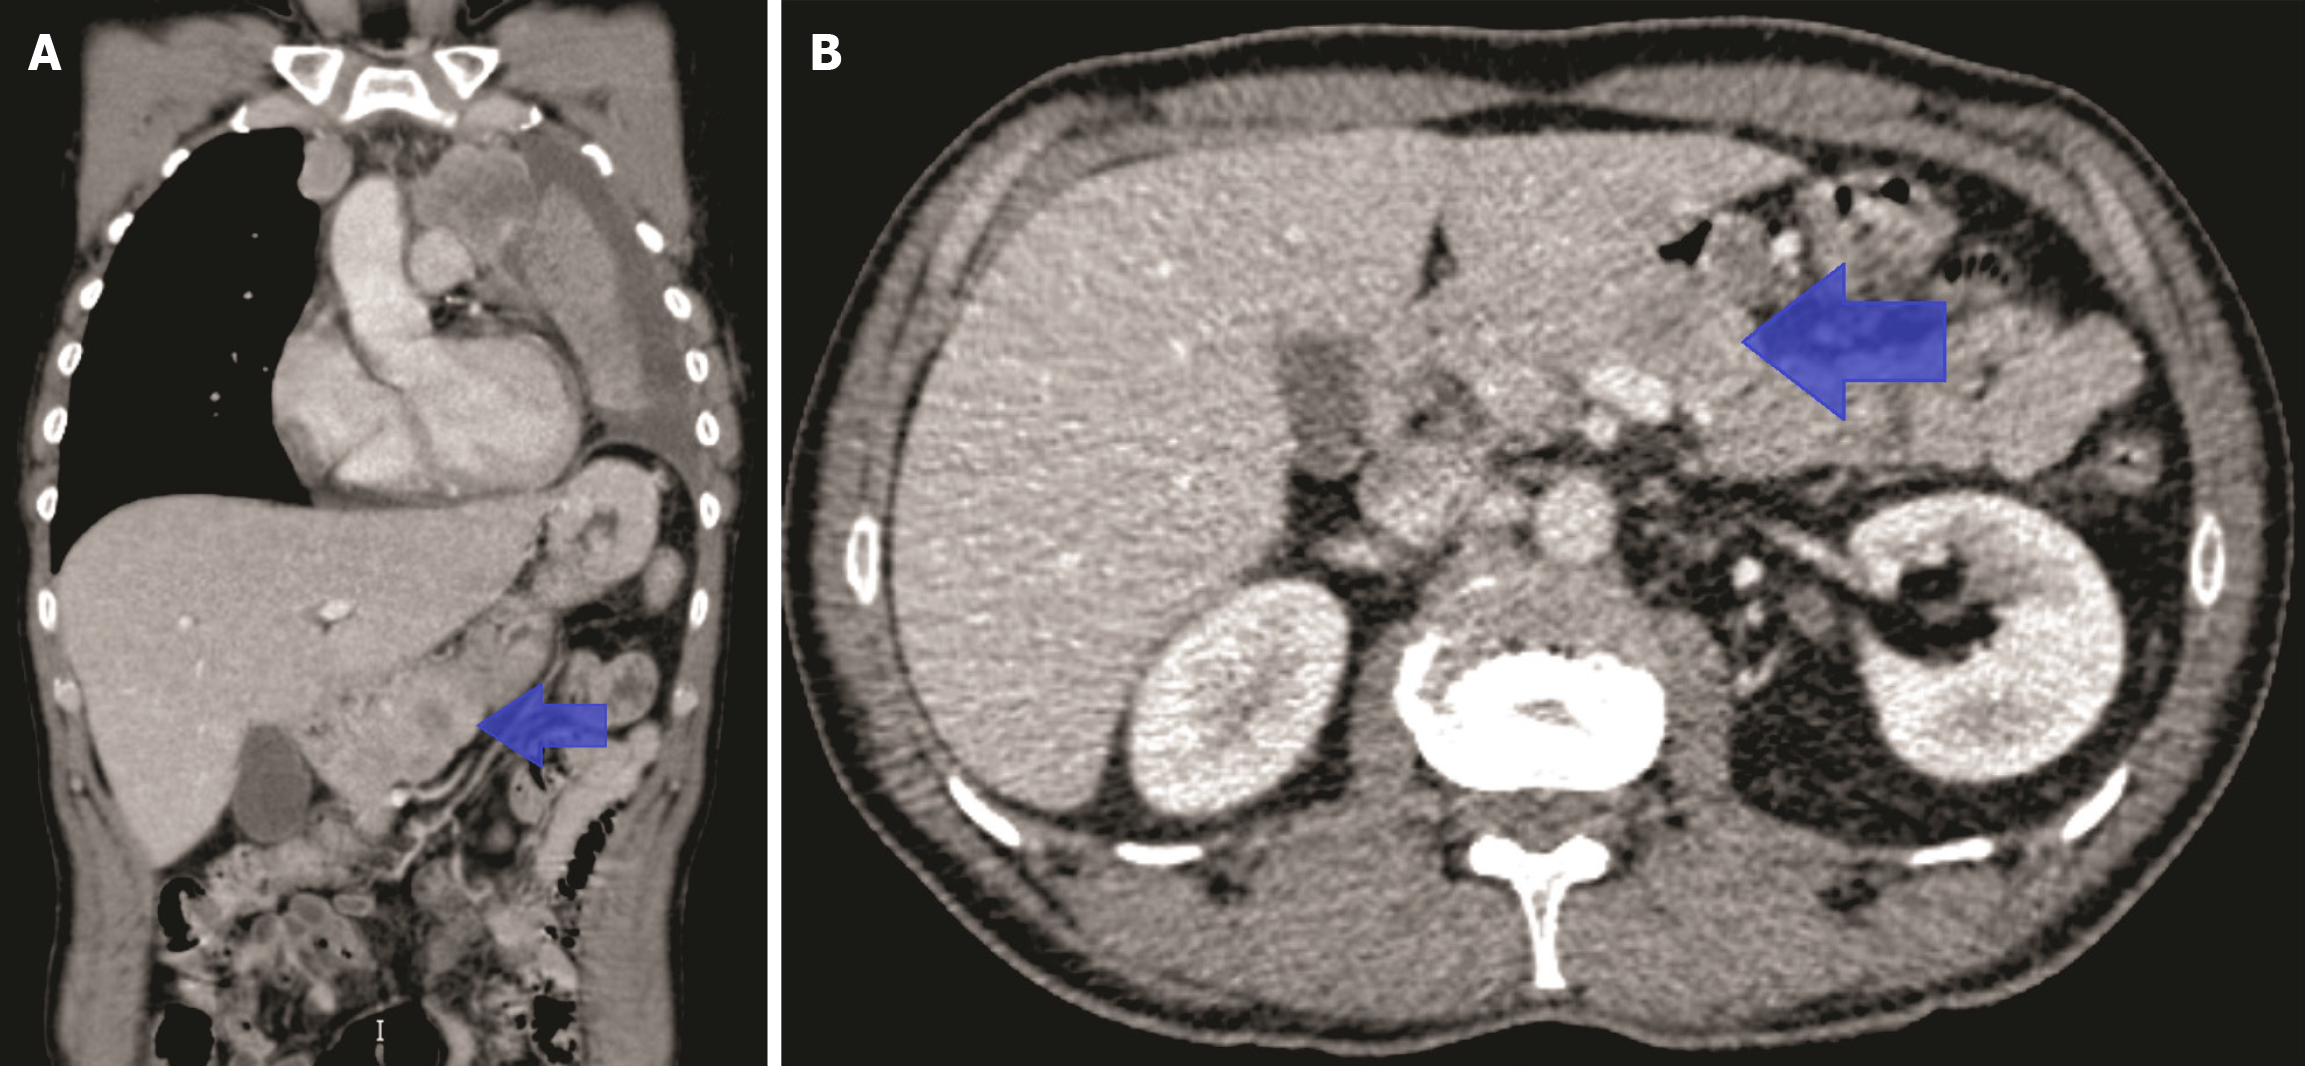
Figure 3 Images from computed tomography performed at the diagnosis of small cell lung cancer.
A: Coronal section, showing the hypodense lesion classified as nonspecific (arrow); B: Axial section displaying the same lesion in this plane (arrow).
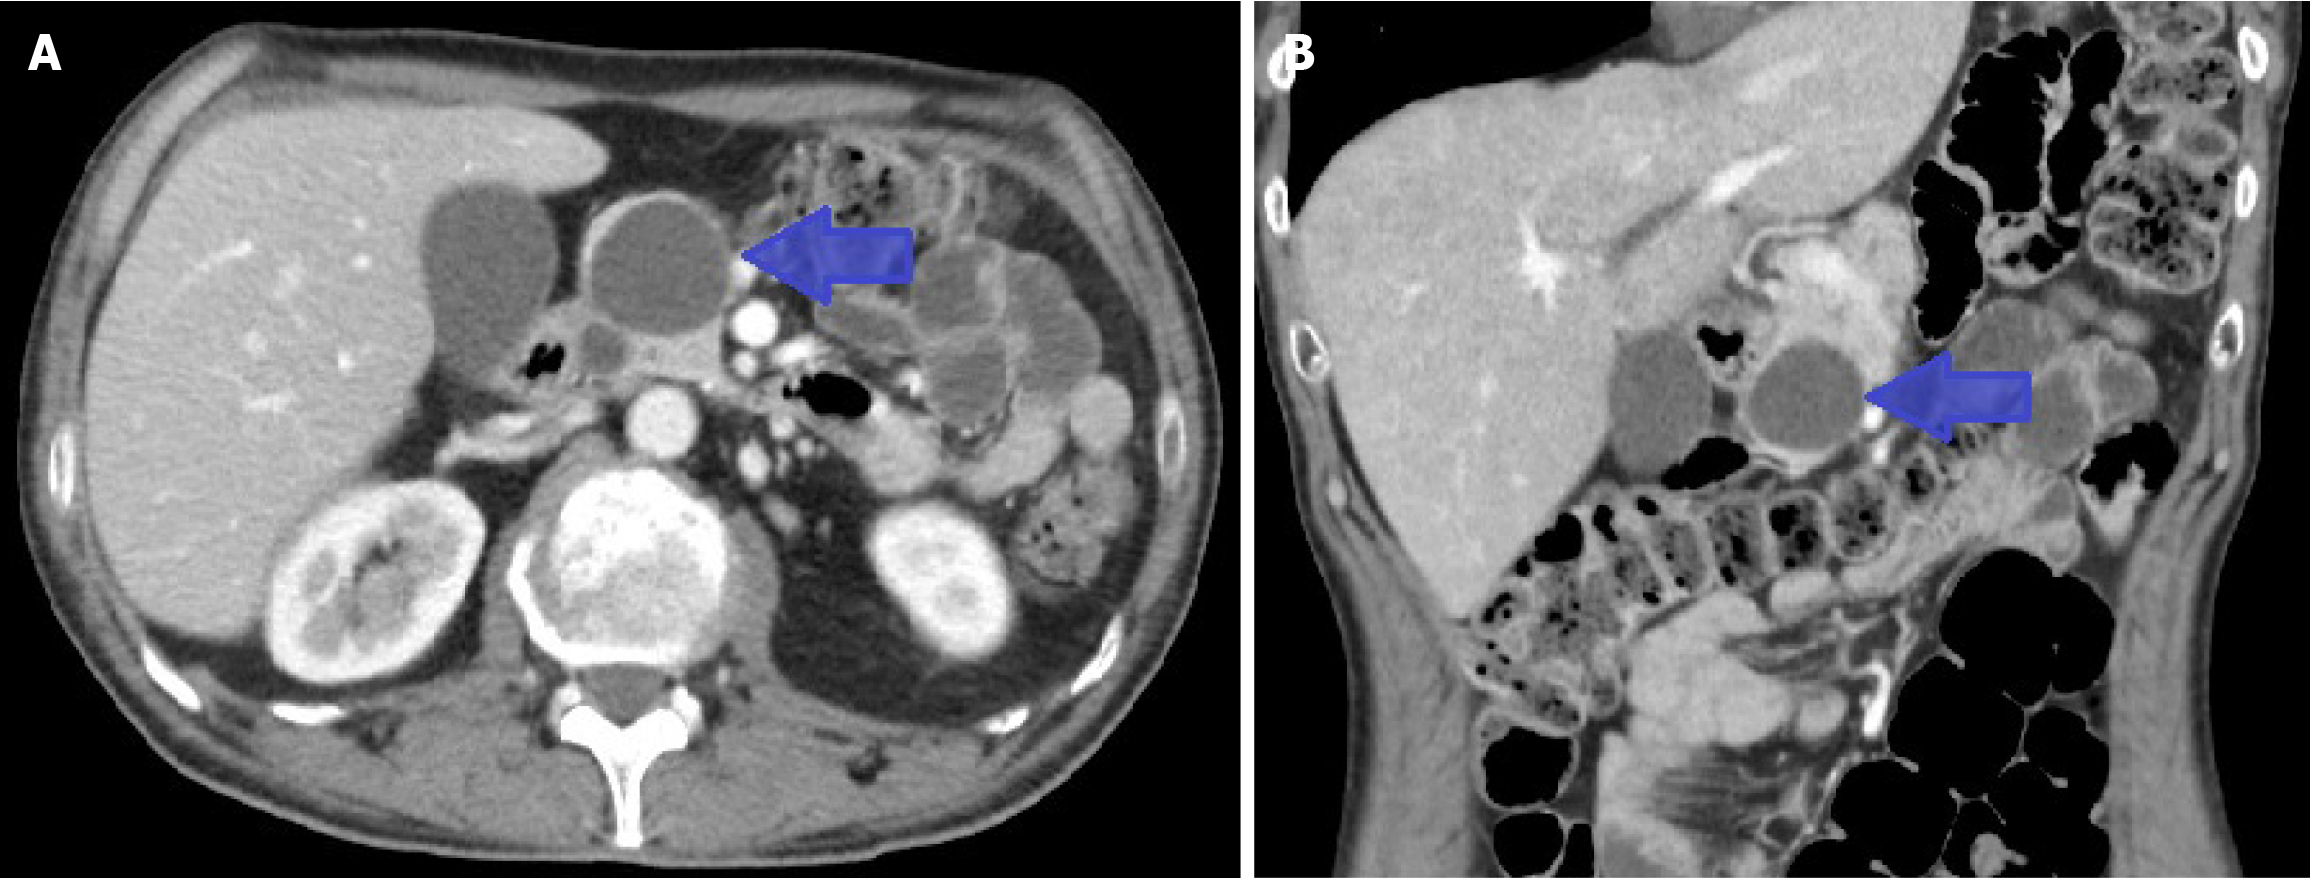
Figure 4 Follow-up computed tomography.
A cystic lesion at the level of the pancreatic head-uncinate process compatible with a pancreatic pseudocyst is observed. A: Axial view showing a cystic lesion; B: Coronal view showing a cystic lesion.
Figure 5 Timeline summarizing the most important events in clinical progression.
CT: Computed tomography.
- Citation: Suárez M, Simón S, Martínez R, Crespo J. Acute pancreatitis secondary to small-cell lung cancer metastasis: A case report and literature review. World J Clin Cases 2025; 13(27): 107805
- URL: https://www.wjgnet.com/2307-8960/full/v13/i27/107805.htm
- DOI: https://dx.doi.org/10.12998/wjcc.v13.i27.107805


