©The Author(s) 2025.
World J Clin Cases. Aug 26, 2025; 13(24): 105923
Published online Aug 26, 2025. doi: 10.12998/wjcc.v13.i24.105923
Published online Aug 26, 2025. doi: 10.12998/wjcc.v13.i24.105923
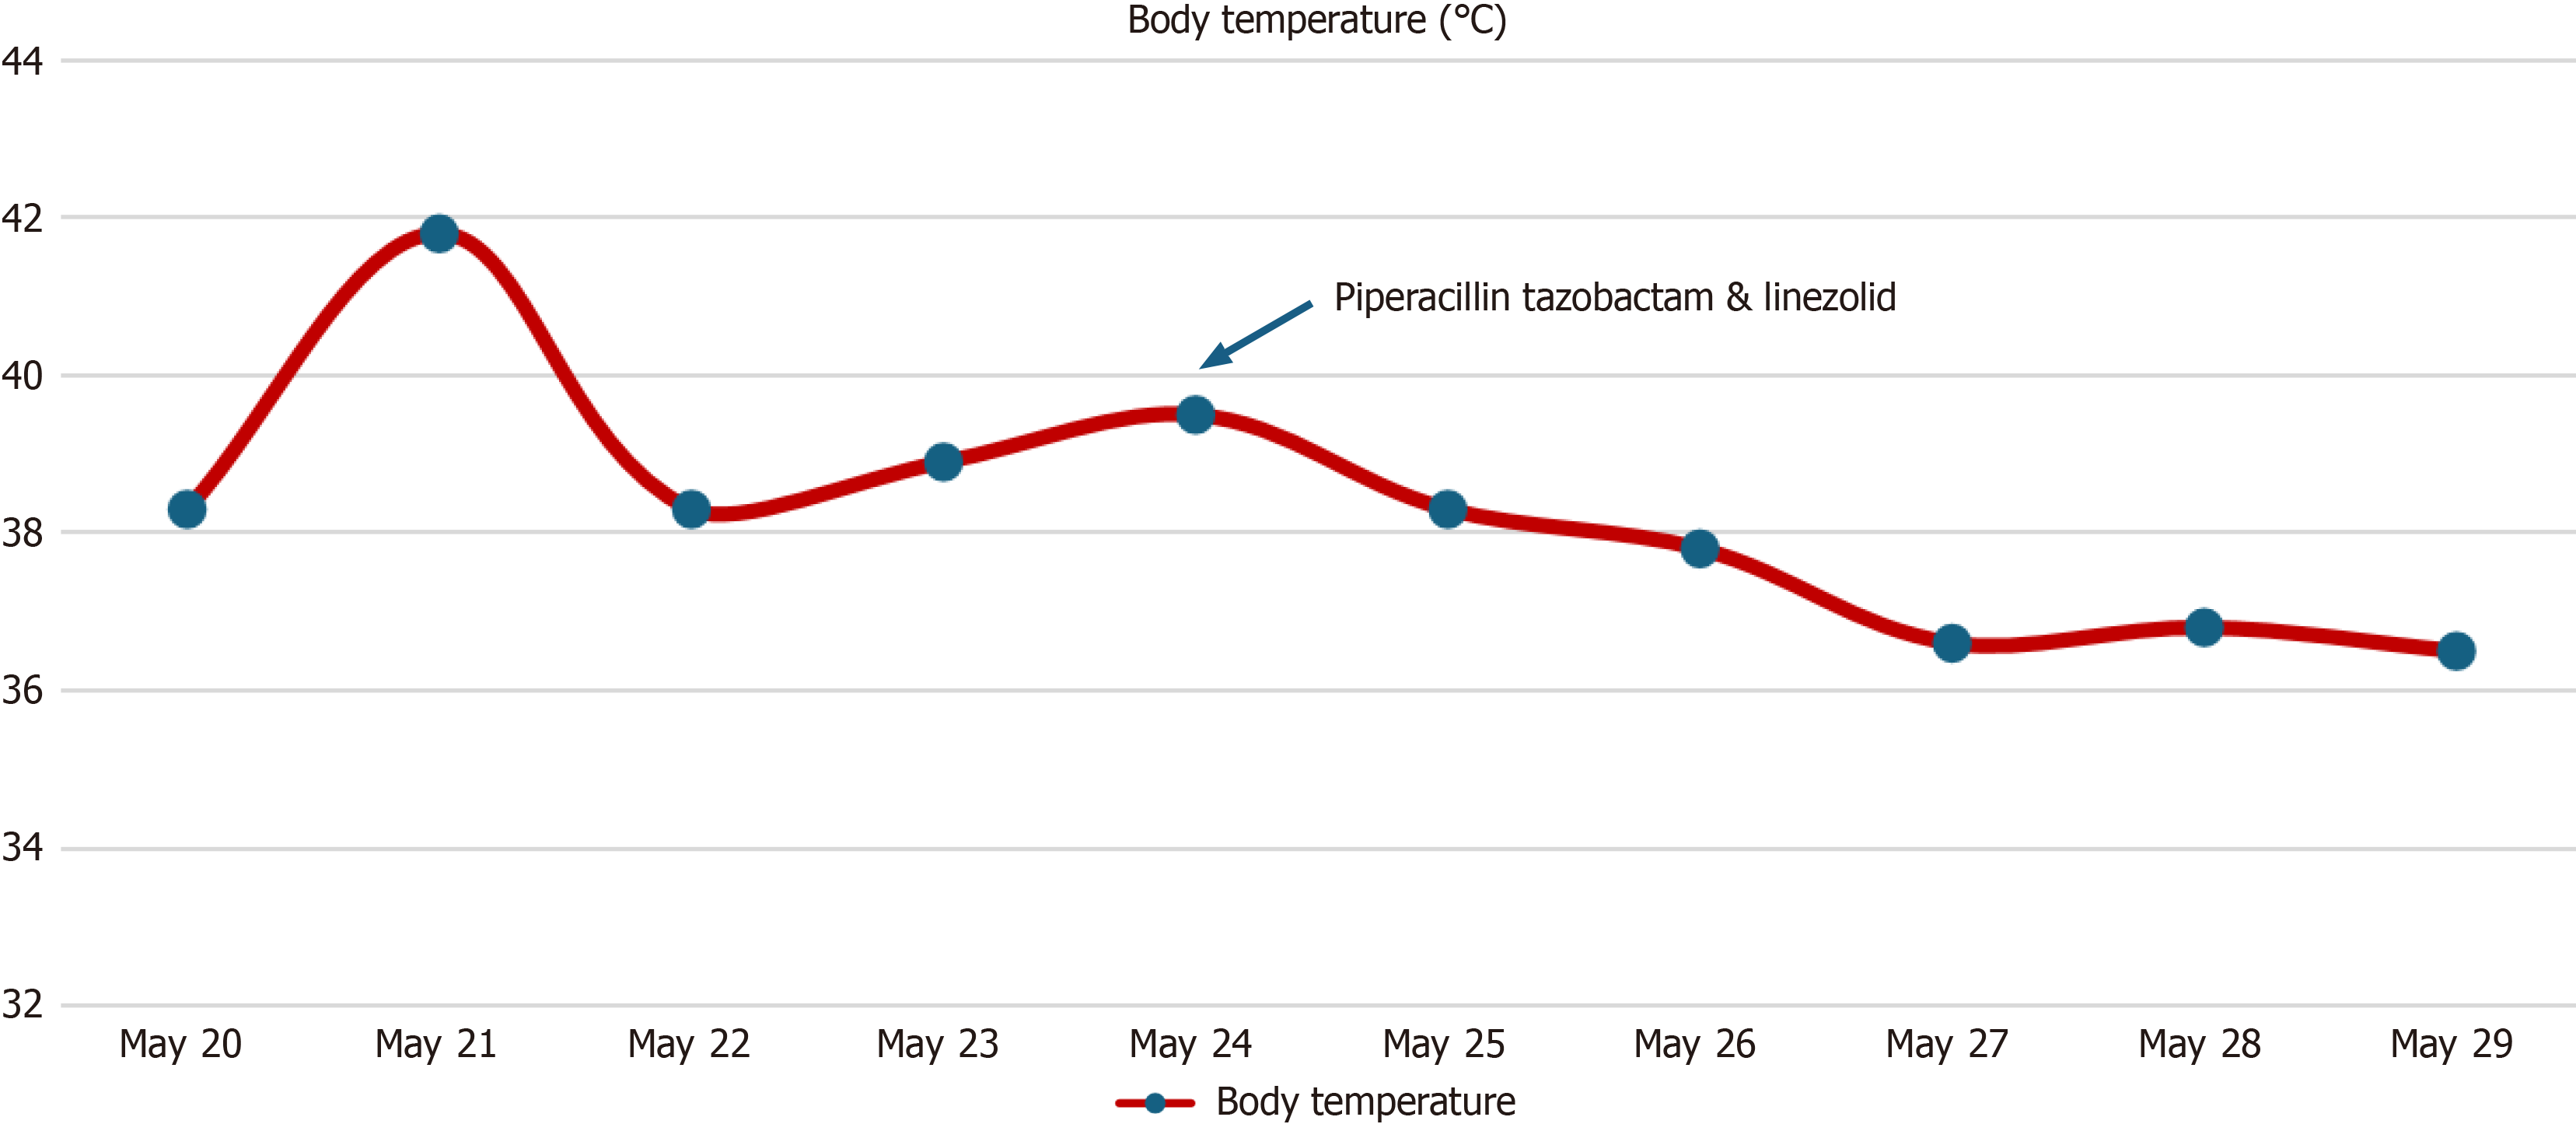
Figure 1 Temperature records (From May 20 to May 29).
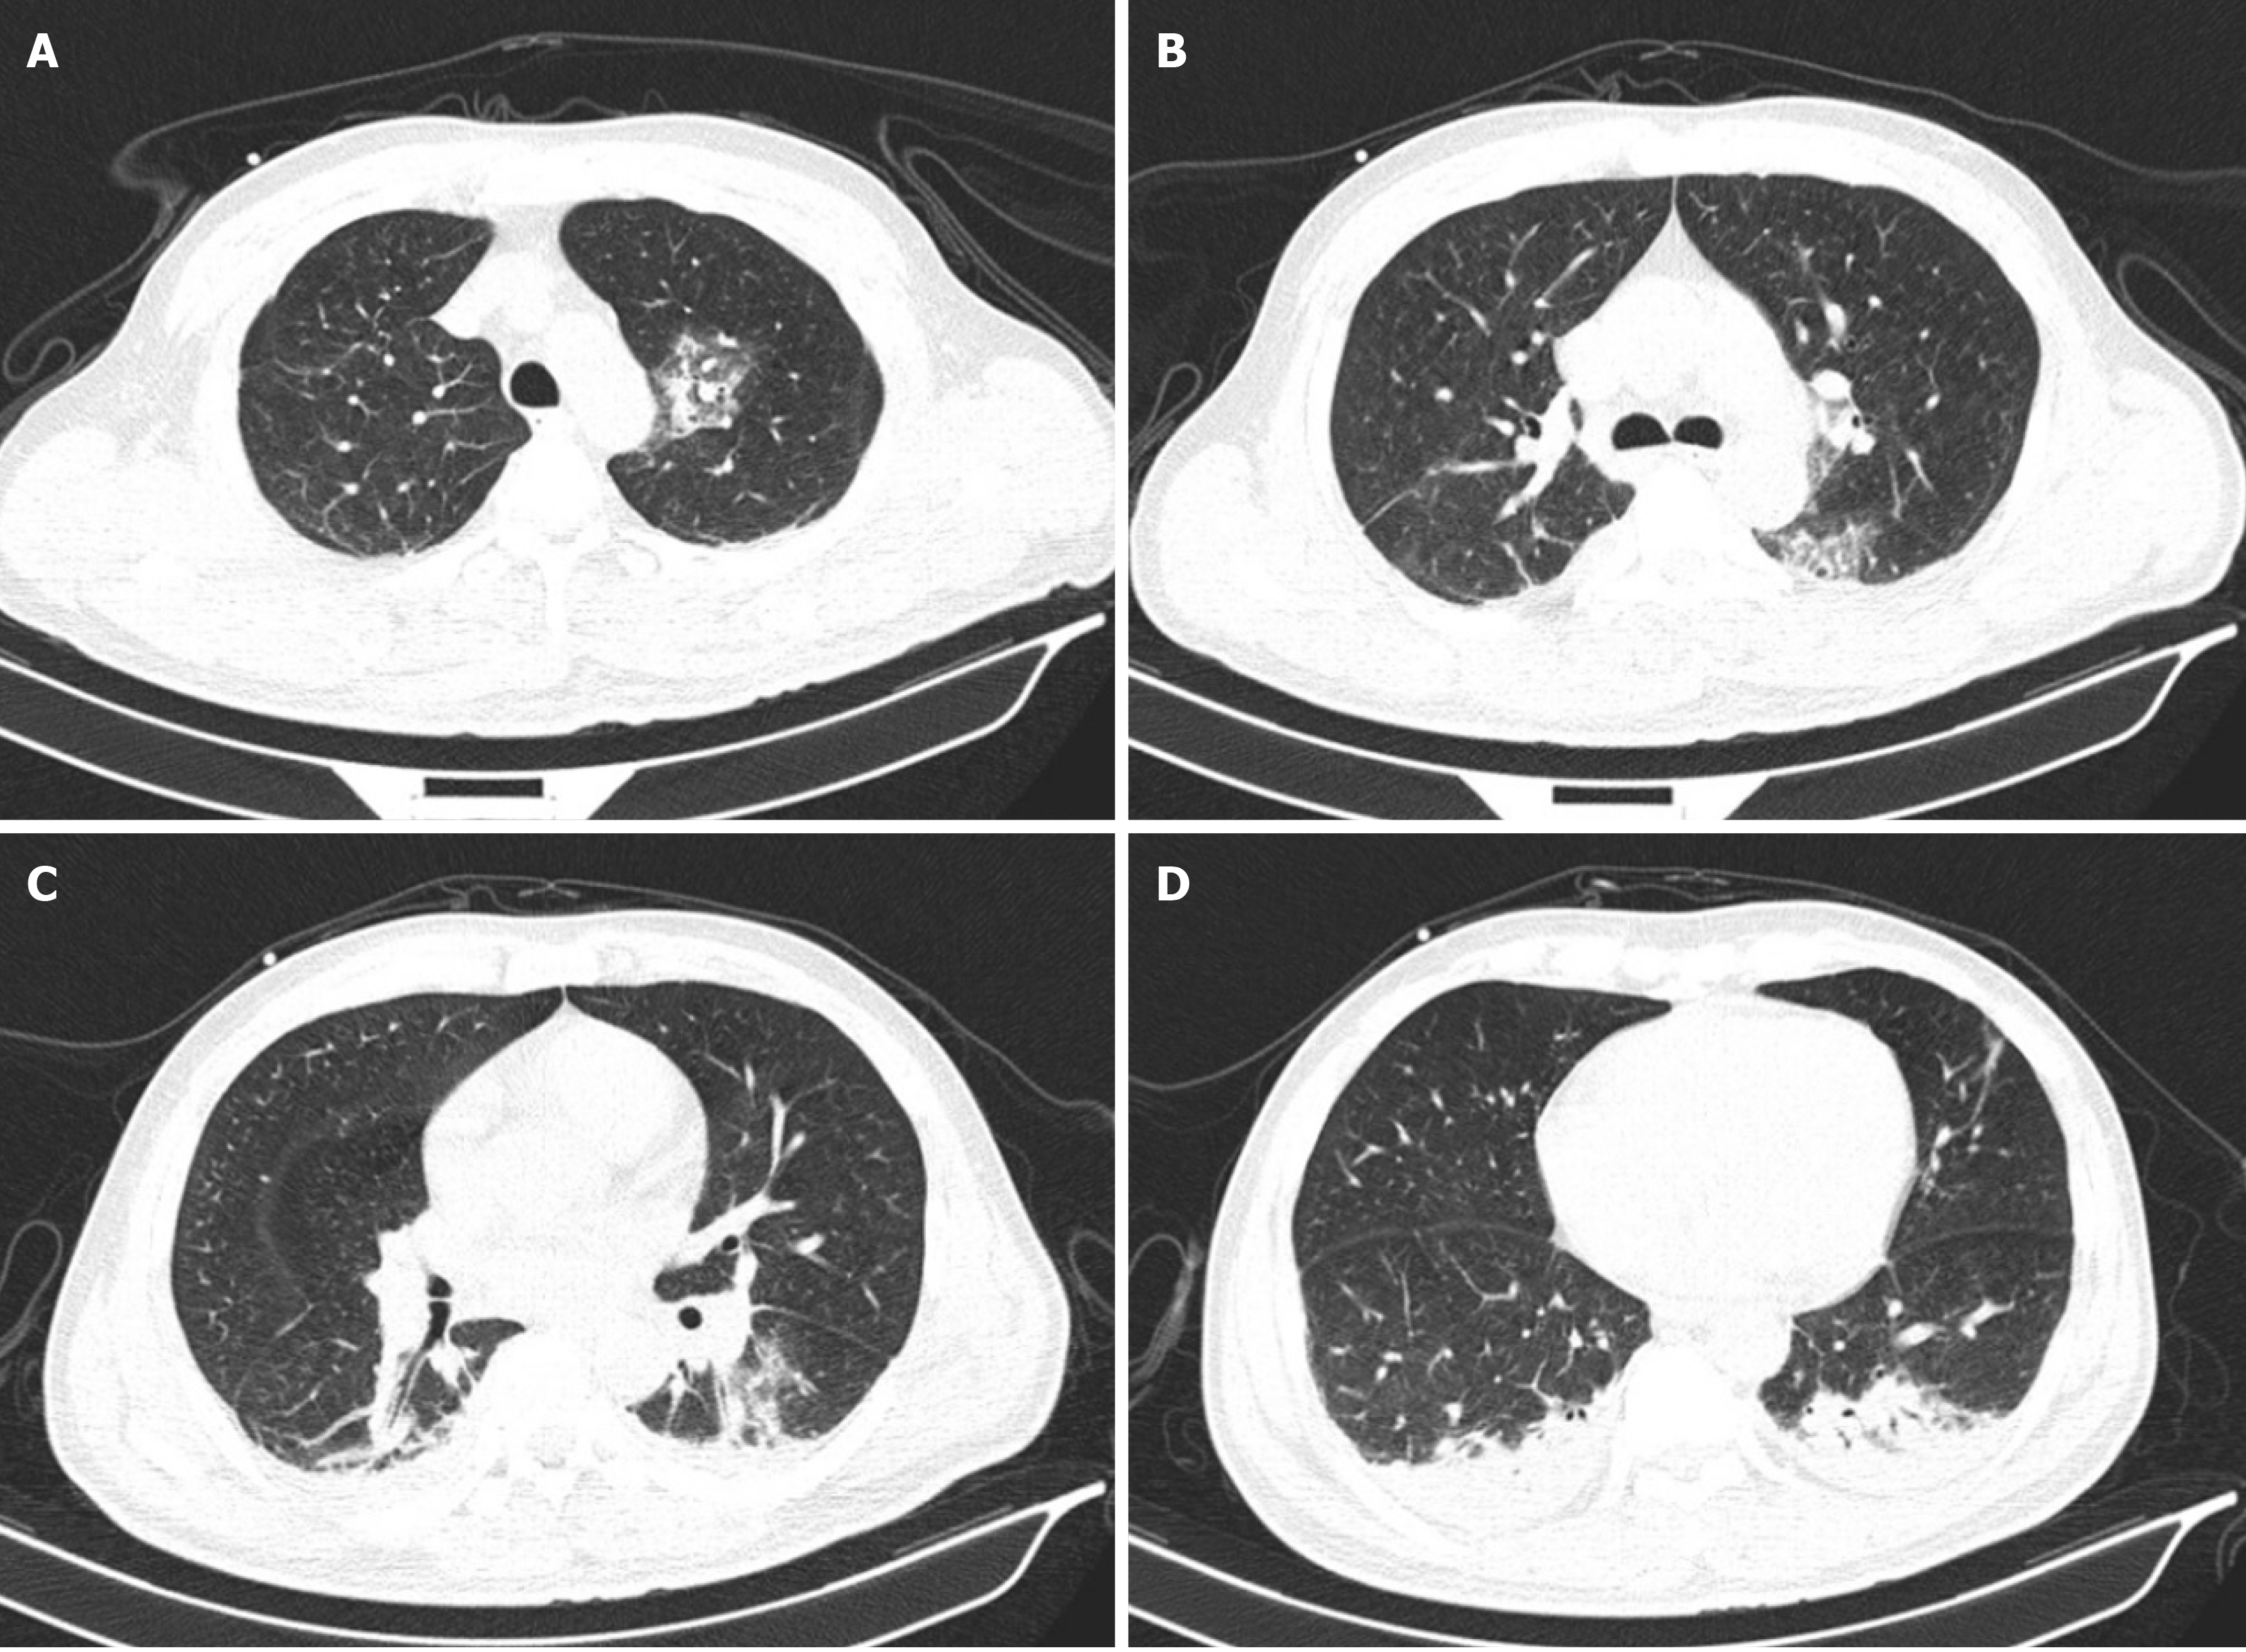
Figure 2 Lung computed tomography images before treatment (May 22).
A: Patchy high-density shadows in the upper lobe of left lung; B: Patchy high-density shadows in the subpleural region of the left lung; C and D: Consolidation shadows in the lower lobes of both lungs, pleural thickening.
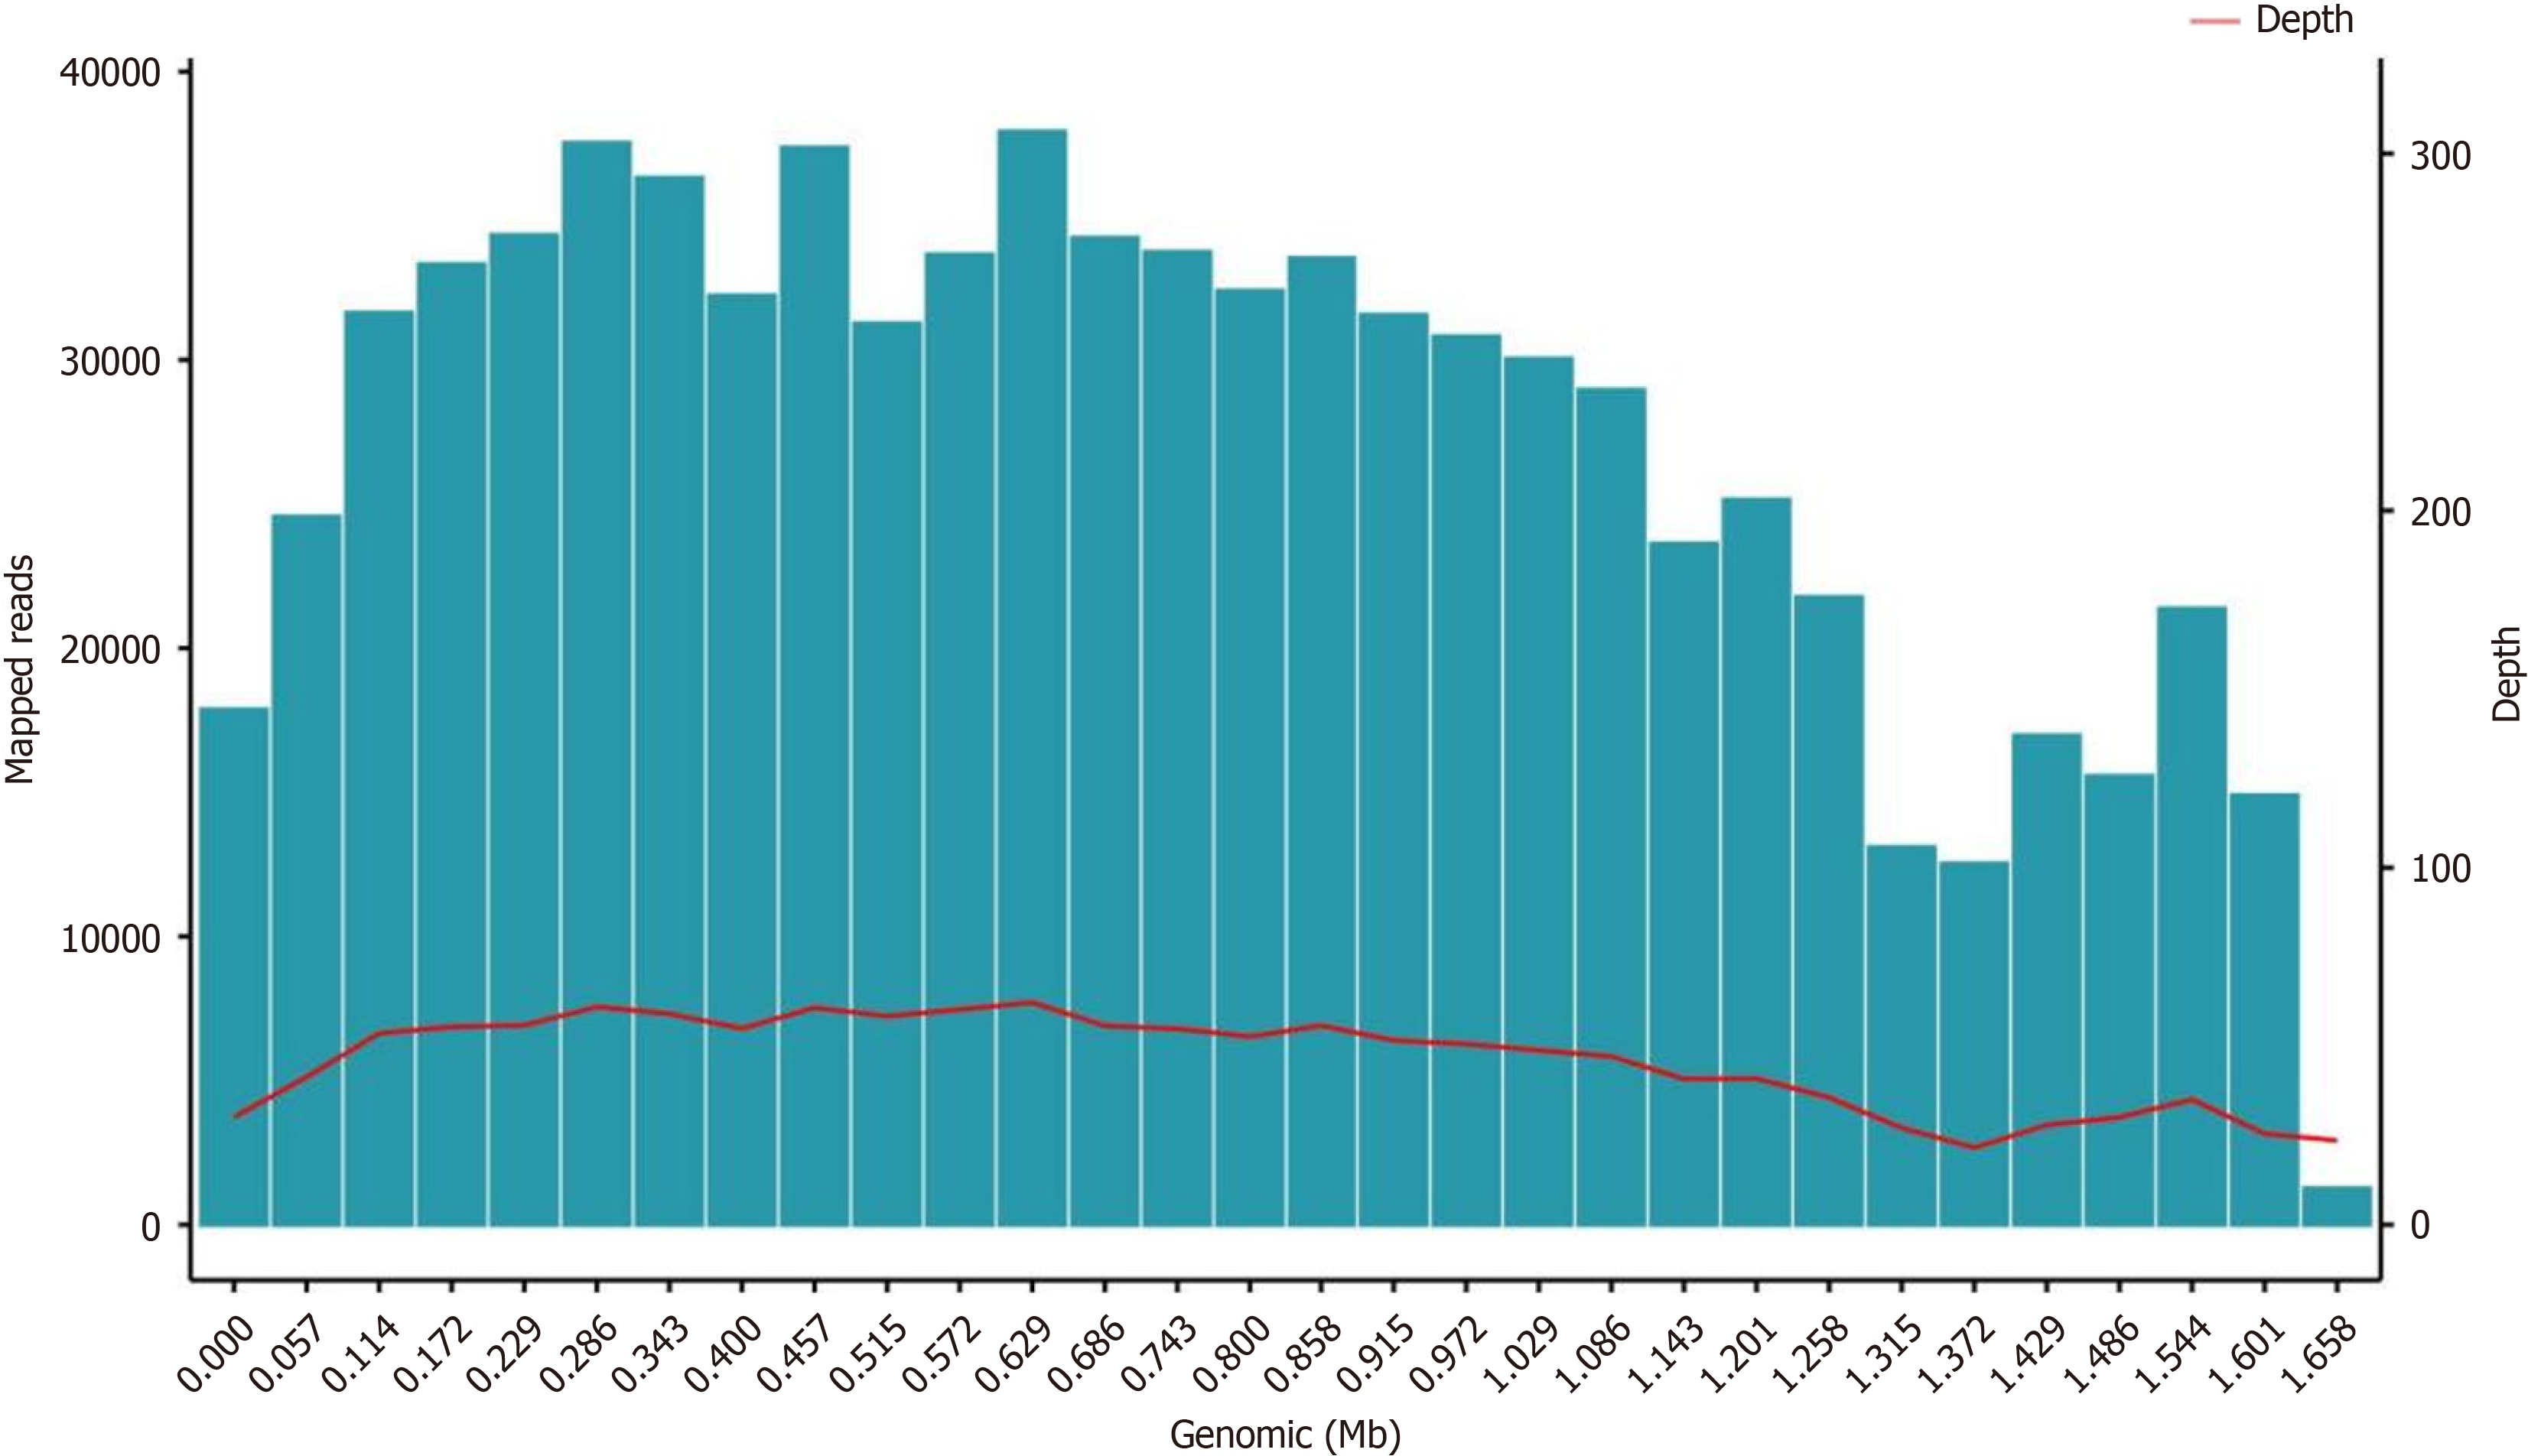
Figure 3 Next-generation sequencing test result.
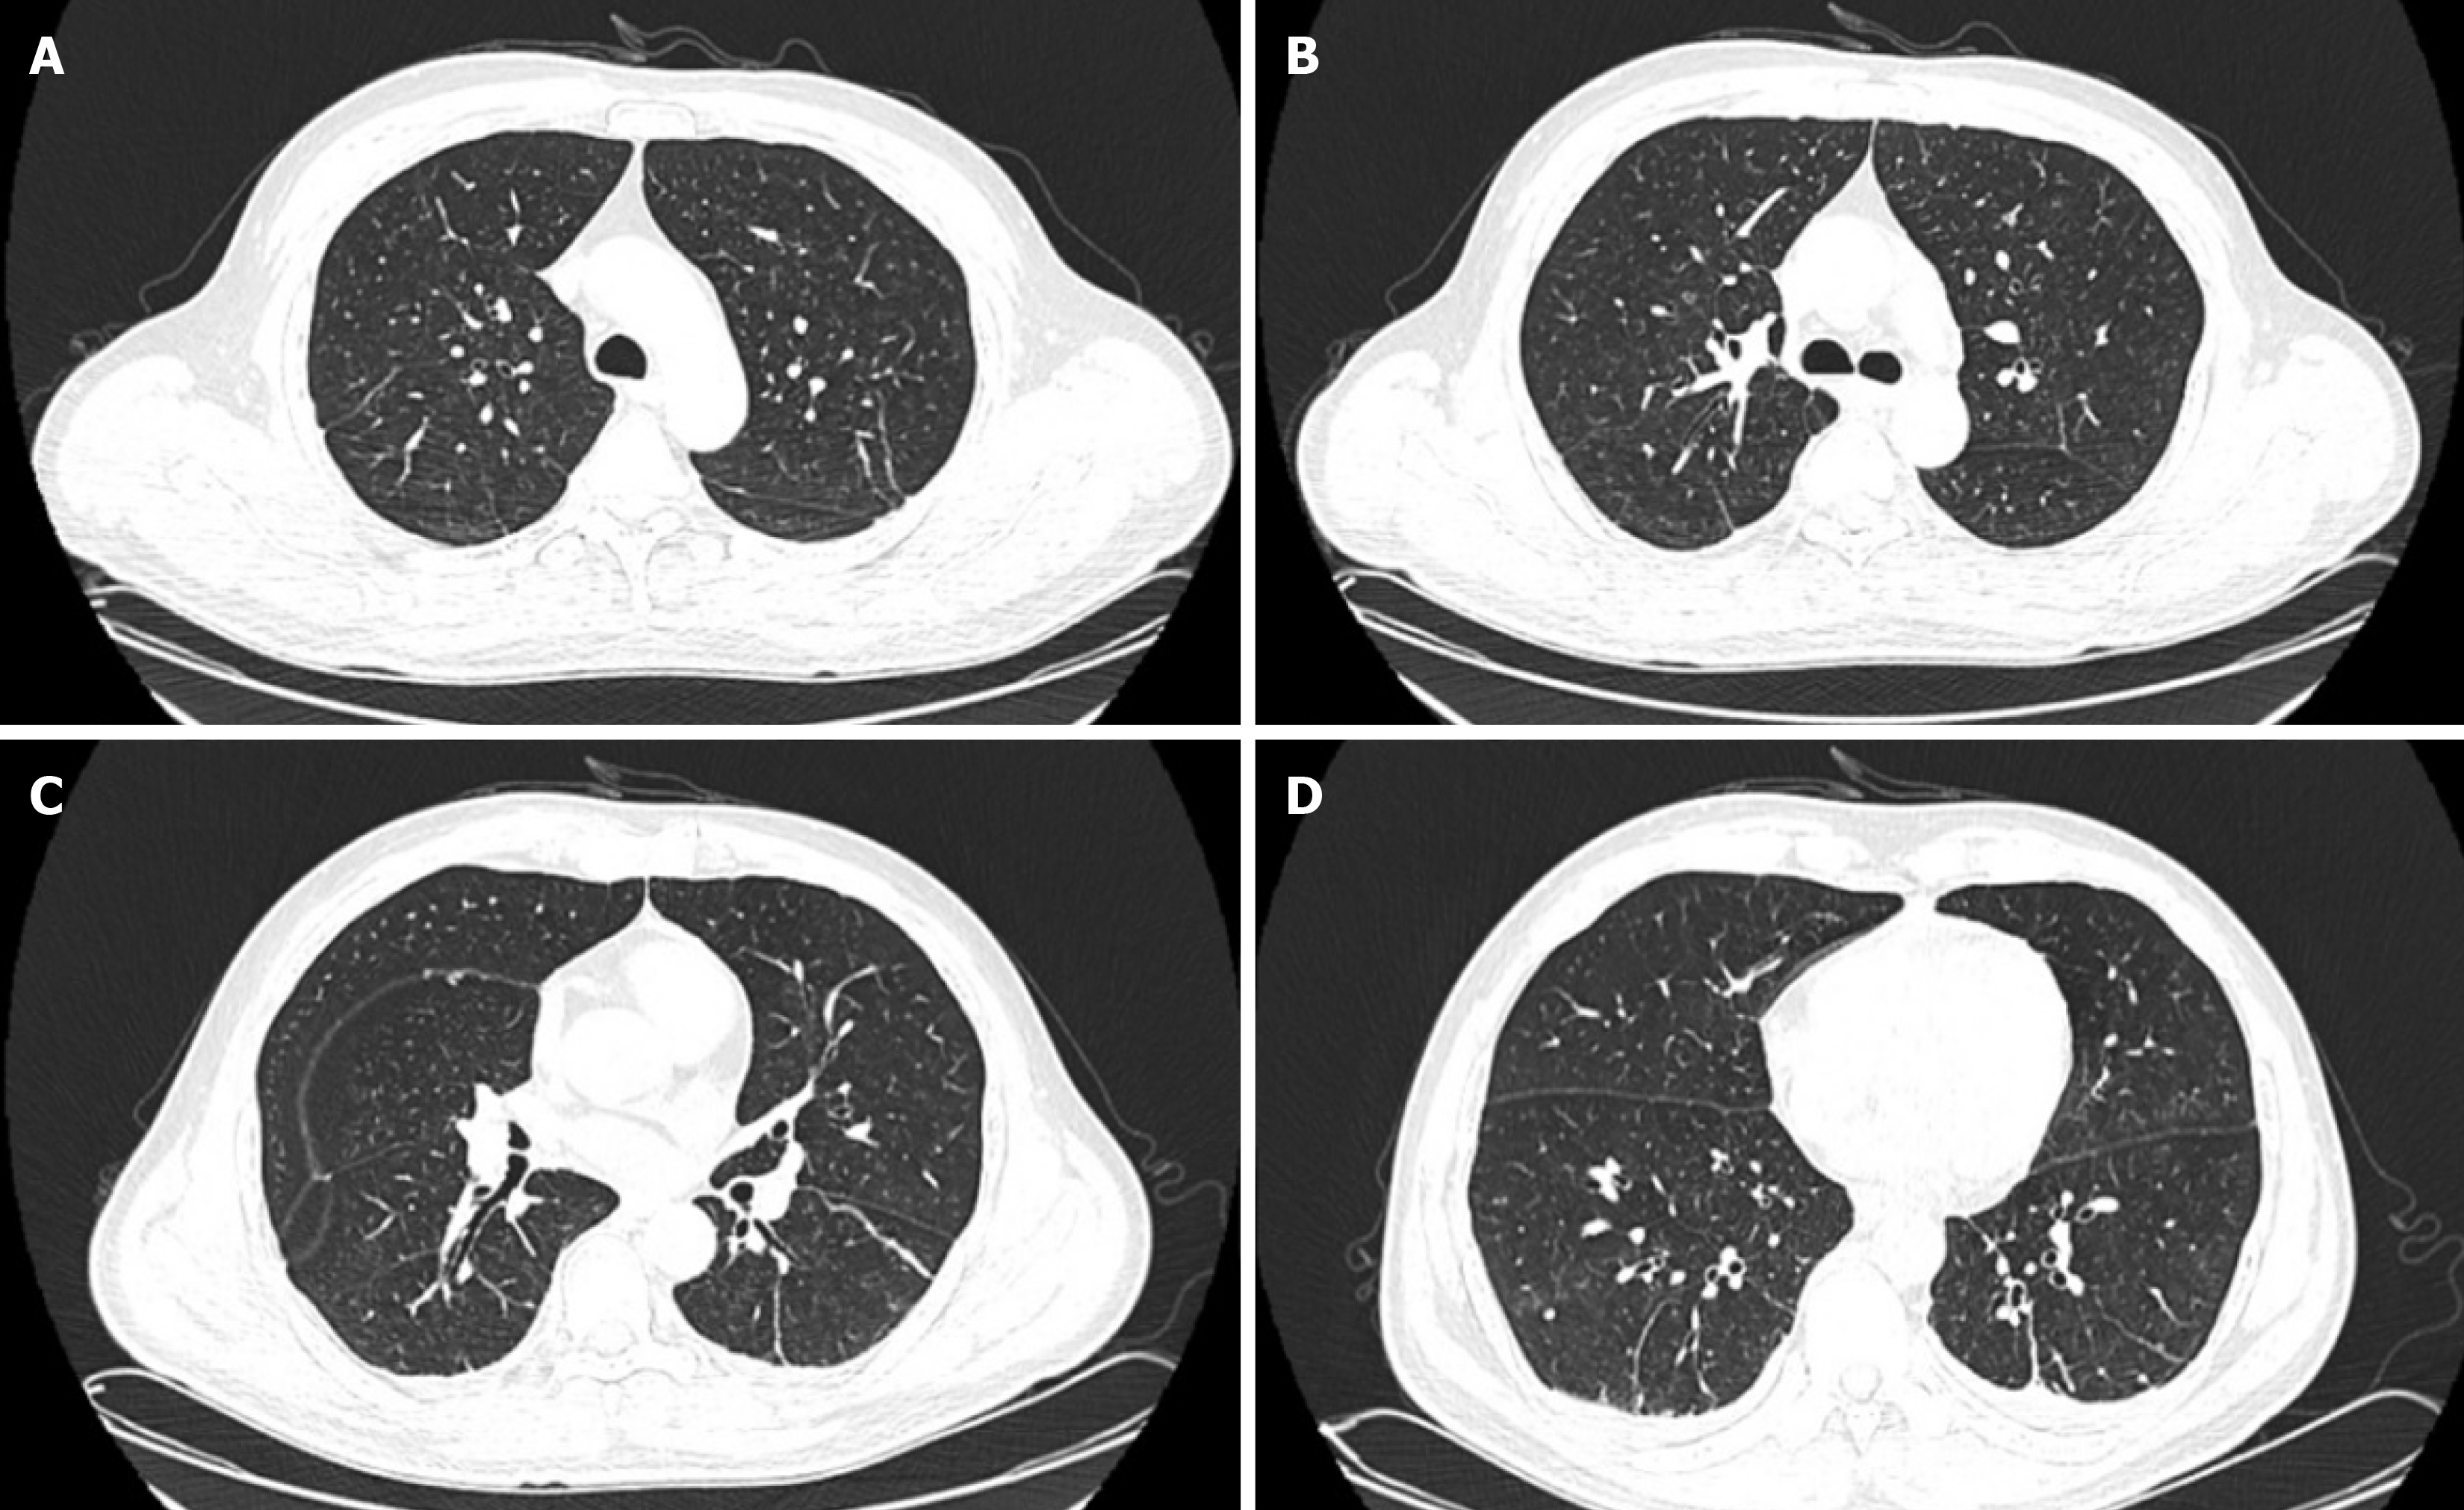
Figure 4 Lung computed tomography images after treatment (June 10).
A and B: Bilateral upper lobes of the lungs are normal; C: Bilateral pleural thickening with adhesions; D: Linear opacities in the inferior lobe of left lung.
- Citation: Zang DY, Li LG, Yang SG, Wang YY, Yu XQ. Combination of next-generation sequencing and traditional examinations for identifying Leuconostoc garlicum: A case report. World J Clin Cases 2025; 13(24): 105923
- URL: https://www.wjgnet.com/2307-8960/full/v13/i24/105923.htm
- DOI: https://dx.doi.org/10.12998/wjcc.v13.i24.105923


