Copyright
©The Author(s) 2024.
World J Clin Cases. Oct 16, 2024; 12(29): 6327-6334
Published online Oct 16, 2024. doi: 10.12998/wjcc.v12.i29.6327
Published online Oct 16, 2024. doi: 10.12998/wjcc.v12.i29.6327
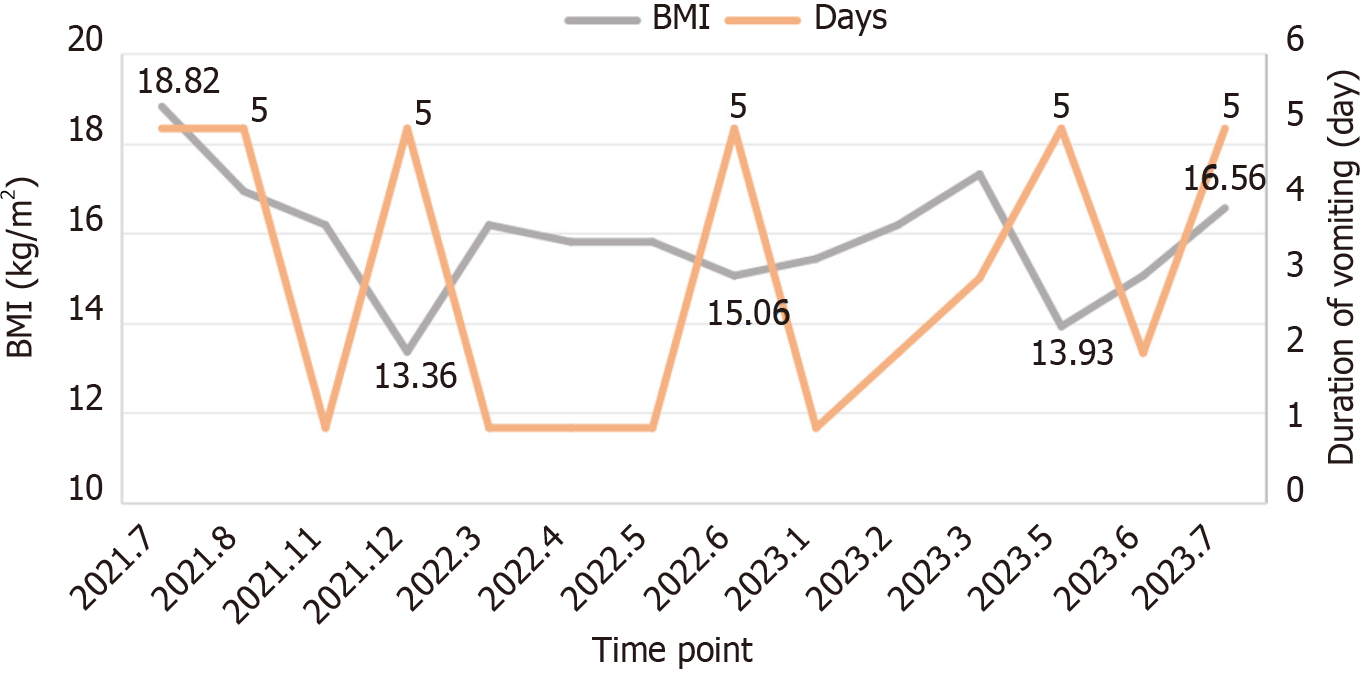
Figure 1 Body mass index and duration of vomiting on indicated time point during the course of the disease.
The gray or yellow line represents the changes in body mass index (BMI) or duration of vomiting, respectively. The lowest BMI was 13.36 kg/m2 and the longest duration of vomiting lasted 5 days. BMI: Body mass index.
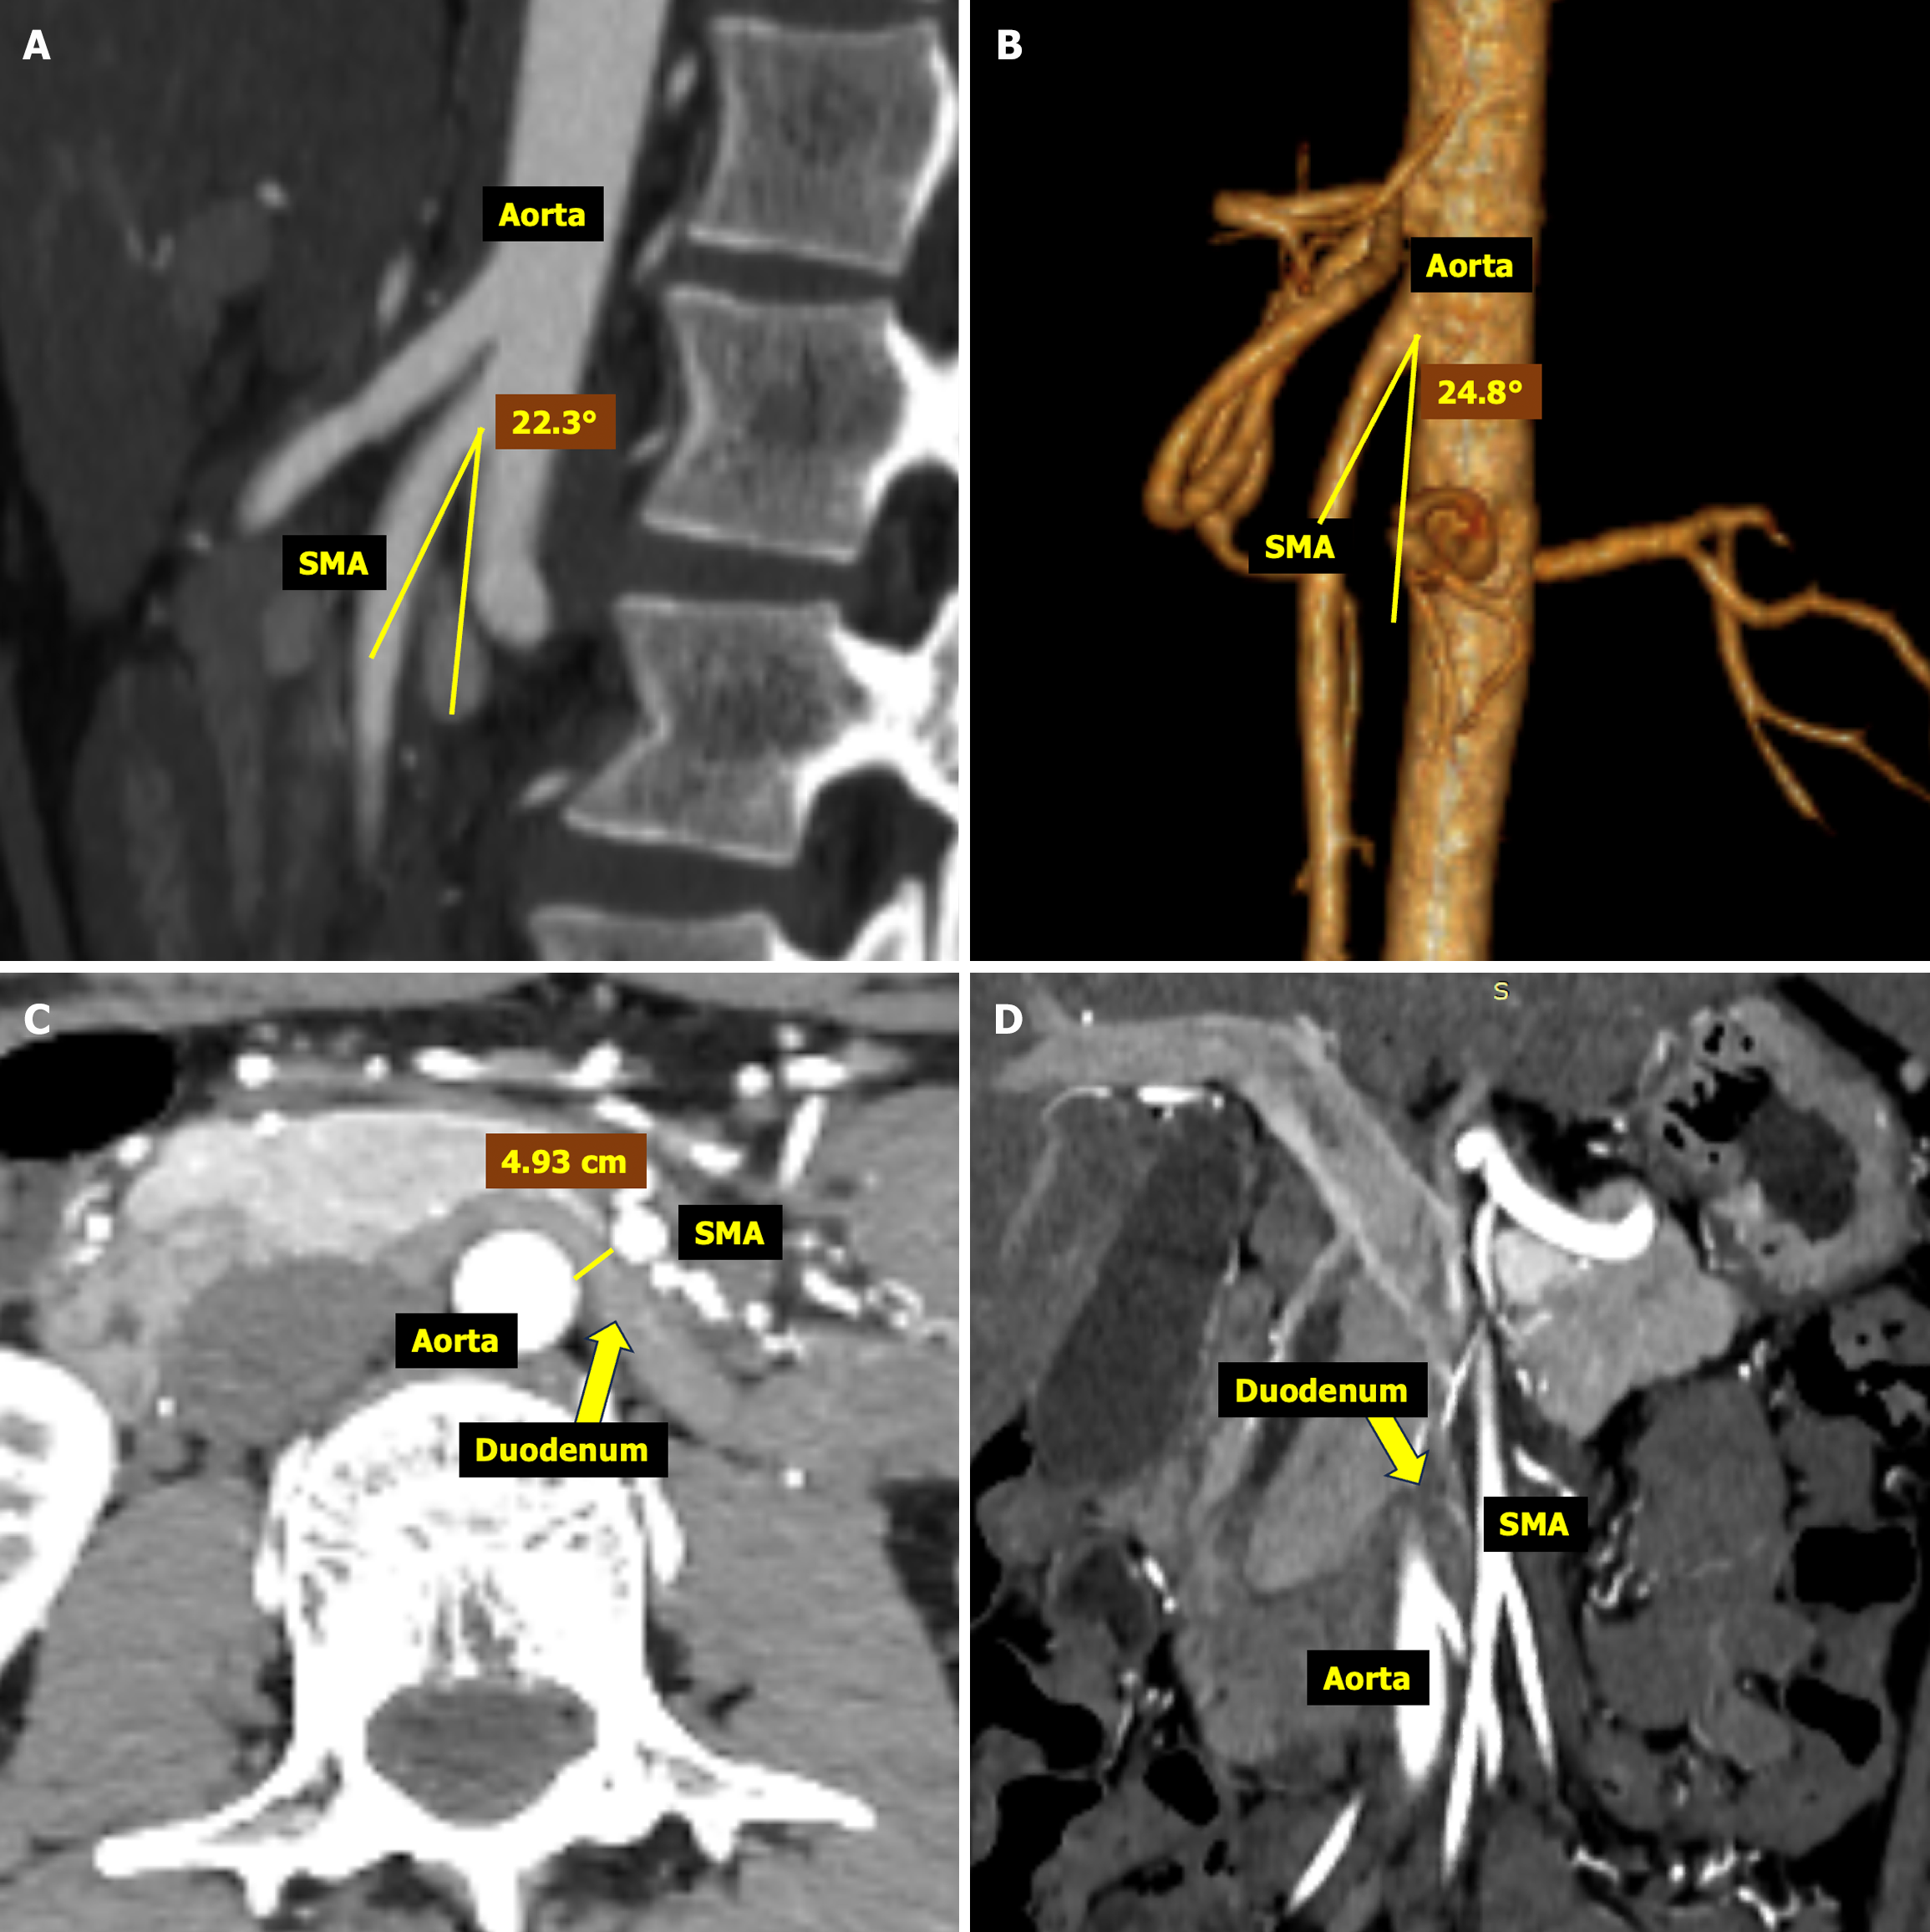
Figure 2 Follow-up abdominal computed tomography angiography examination.
A-D: Computed tomography angiography image (A) and the three-dimensional reconstruction of abdominal artery (B) showed the angle between the superior mesenteric artery (SMA) and the aorta; Axial (C) and coronal (D) images illustrate the distance between the horizontal plane of the aorta and SMA at the level of the duodenum. SMA: Superior mesenteric artery.
- Citation: Liu B, Sun H, Liu Y, Yuan ML, Zhu HR, Zhang W. Comprehensive interventions for adult cyclic vomiting syndrome complicated by superior mesenteric artery syndrome: A case report. World J Clin Cases 2024; 12(29): 6327-6334
- URL: https://www.wjgnet.com/2307-8960/full/v12/i29/6327.htm
- DOI: https://dx.doi.org/10.12998/wjcc.v12.i29.6327


