©The Author(s) 2024.
World J Clin Cases. Jul 16, 2024; 12(20): 4289-4300
Published online Jul 16, 2024. doi: 10.12998/wjcc.v12.i20.4289
Published online Jul 16, 2024. doi: 10.12998/wjcc.v12.i20.4289
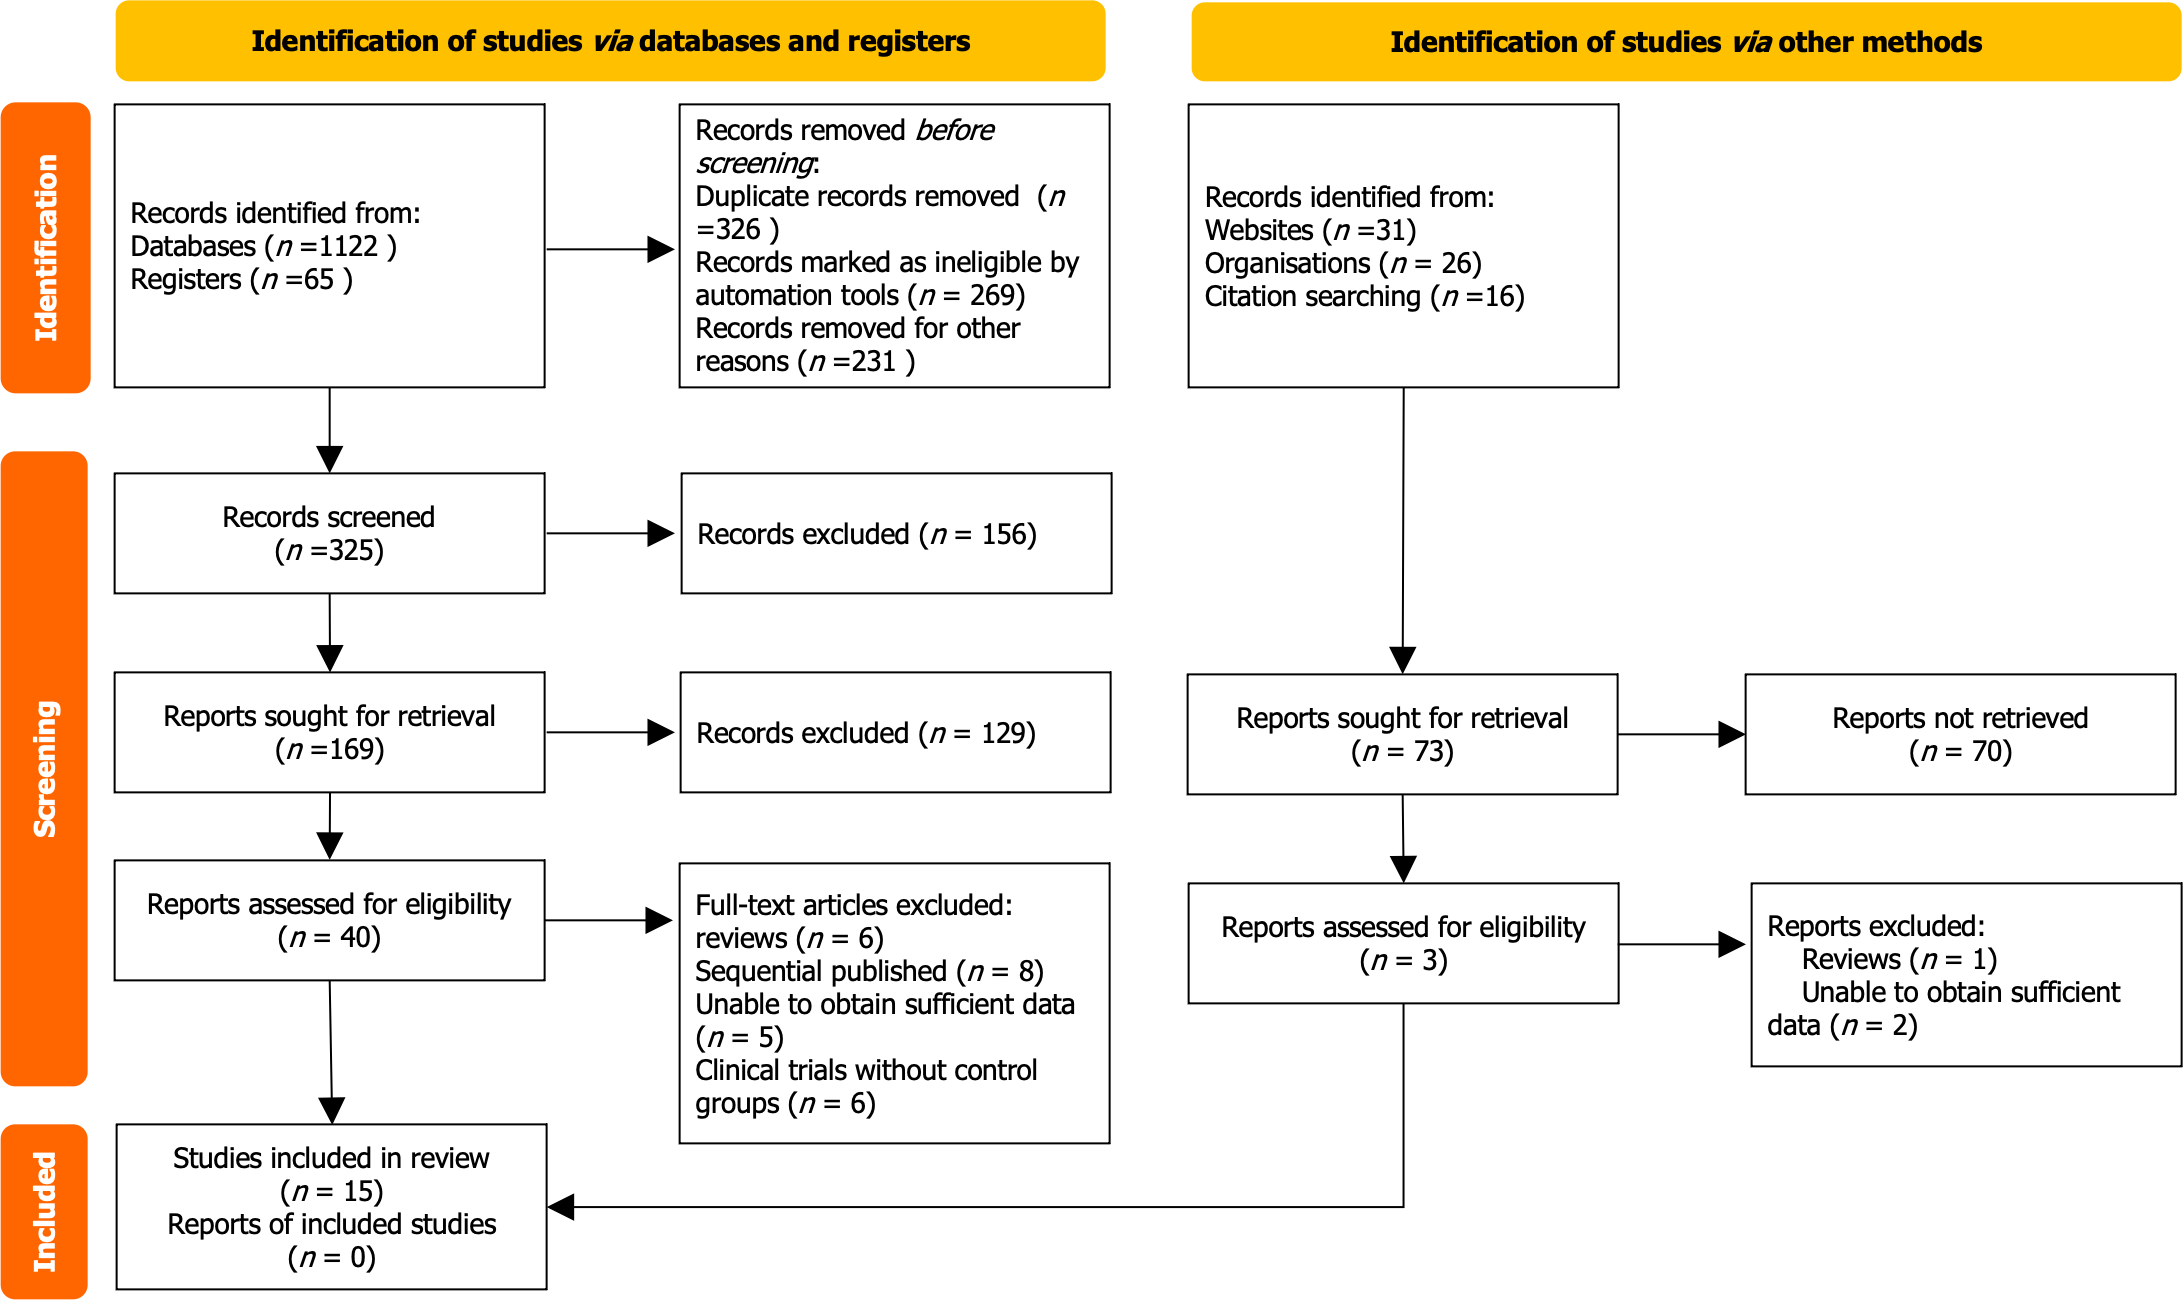
Figure 1 Flowchart depicting process of article selection for meta-analysis, illustrating stages of screening, eligibility assessment, and final inclusion.
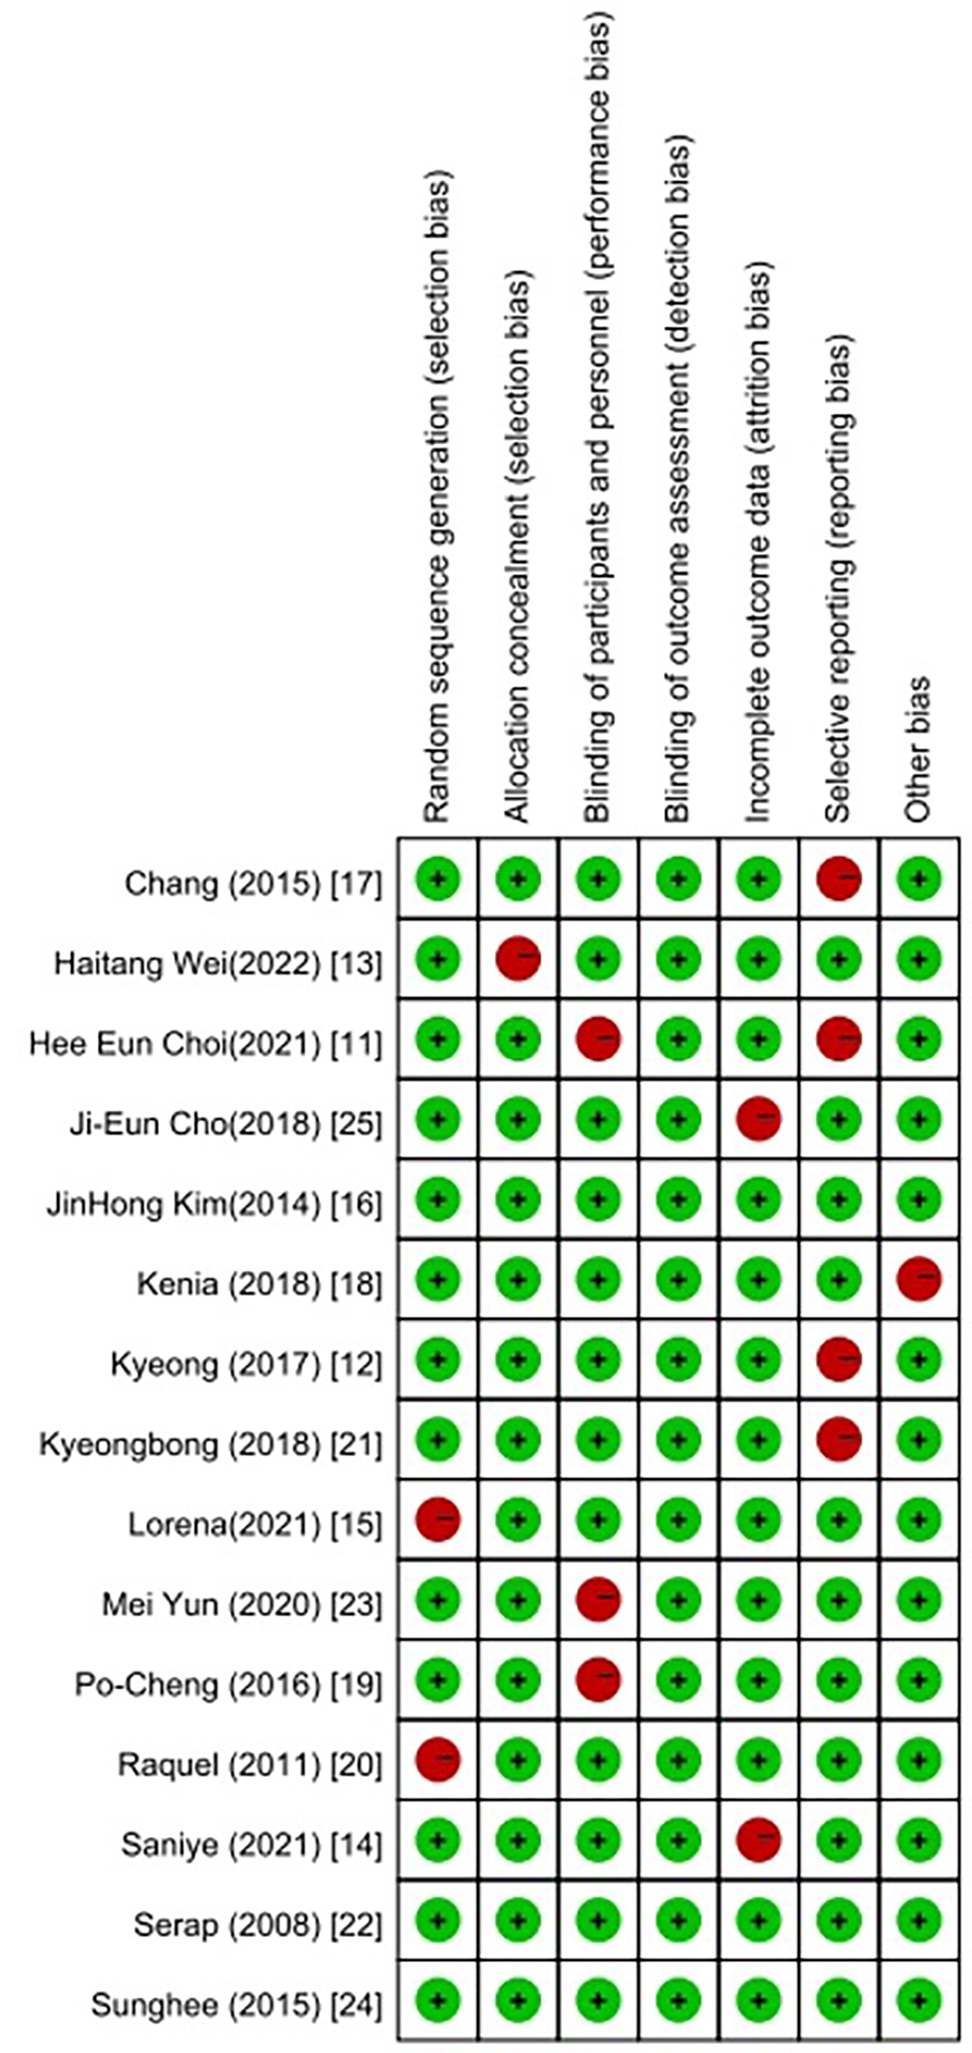
Figure 2 Graphical representation of quality assessment for included studies, based on the Cochrane Collaboration's risk of bias tool.
The color-coding indicates the level of risk: Red for high risk, yellow for unclear risk, and green for low risk.
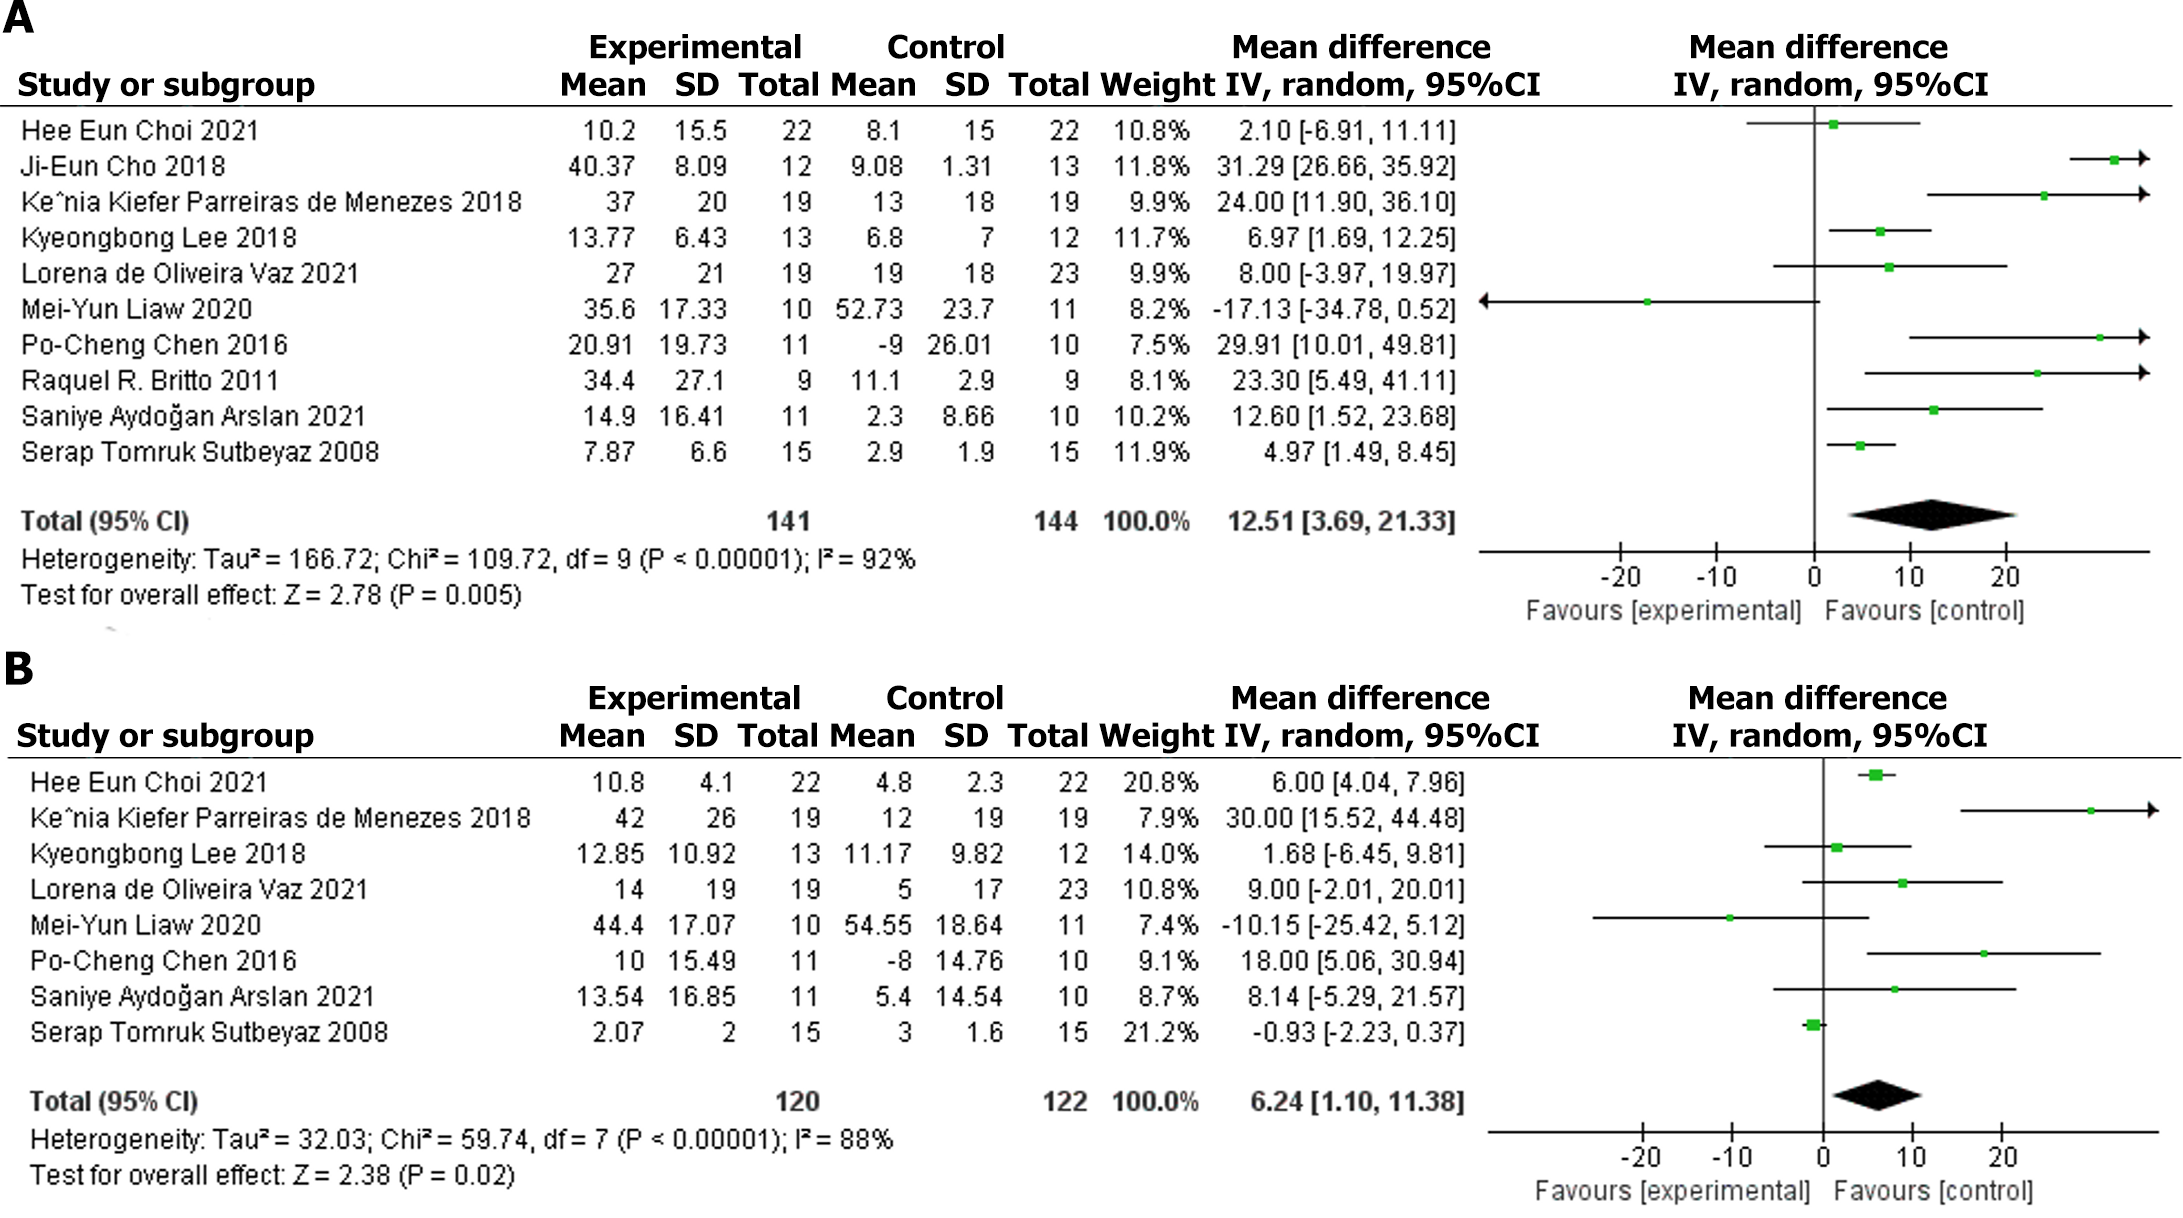
Figure 3 Graphs showing impact of respiratory muscle training on (A) maximal inspiratory pressure and (B) maximal expiratory pressure, indicating changes in inspiratory and expiratory muscle strength.
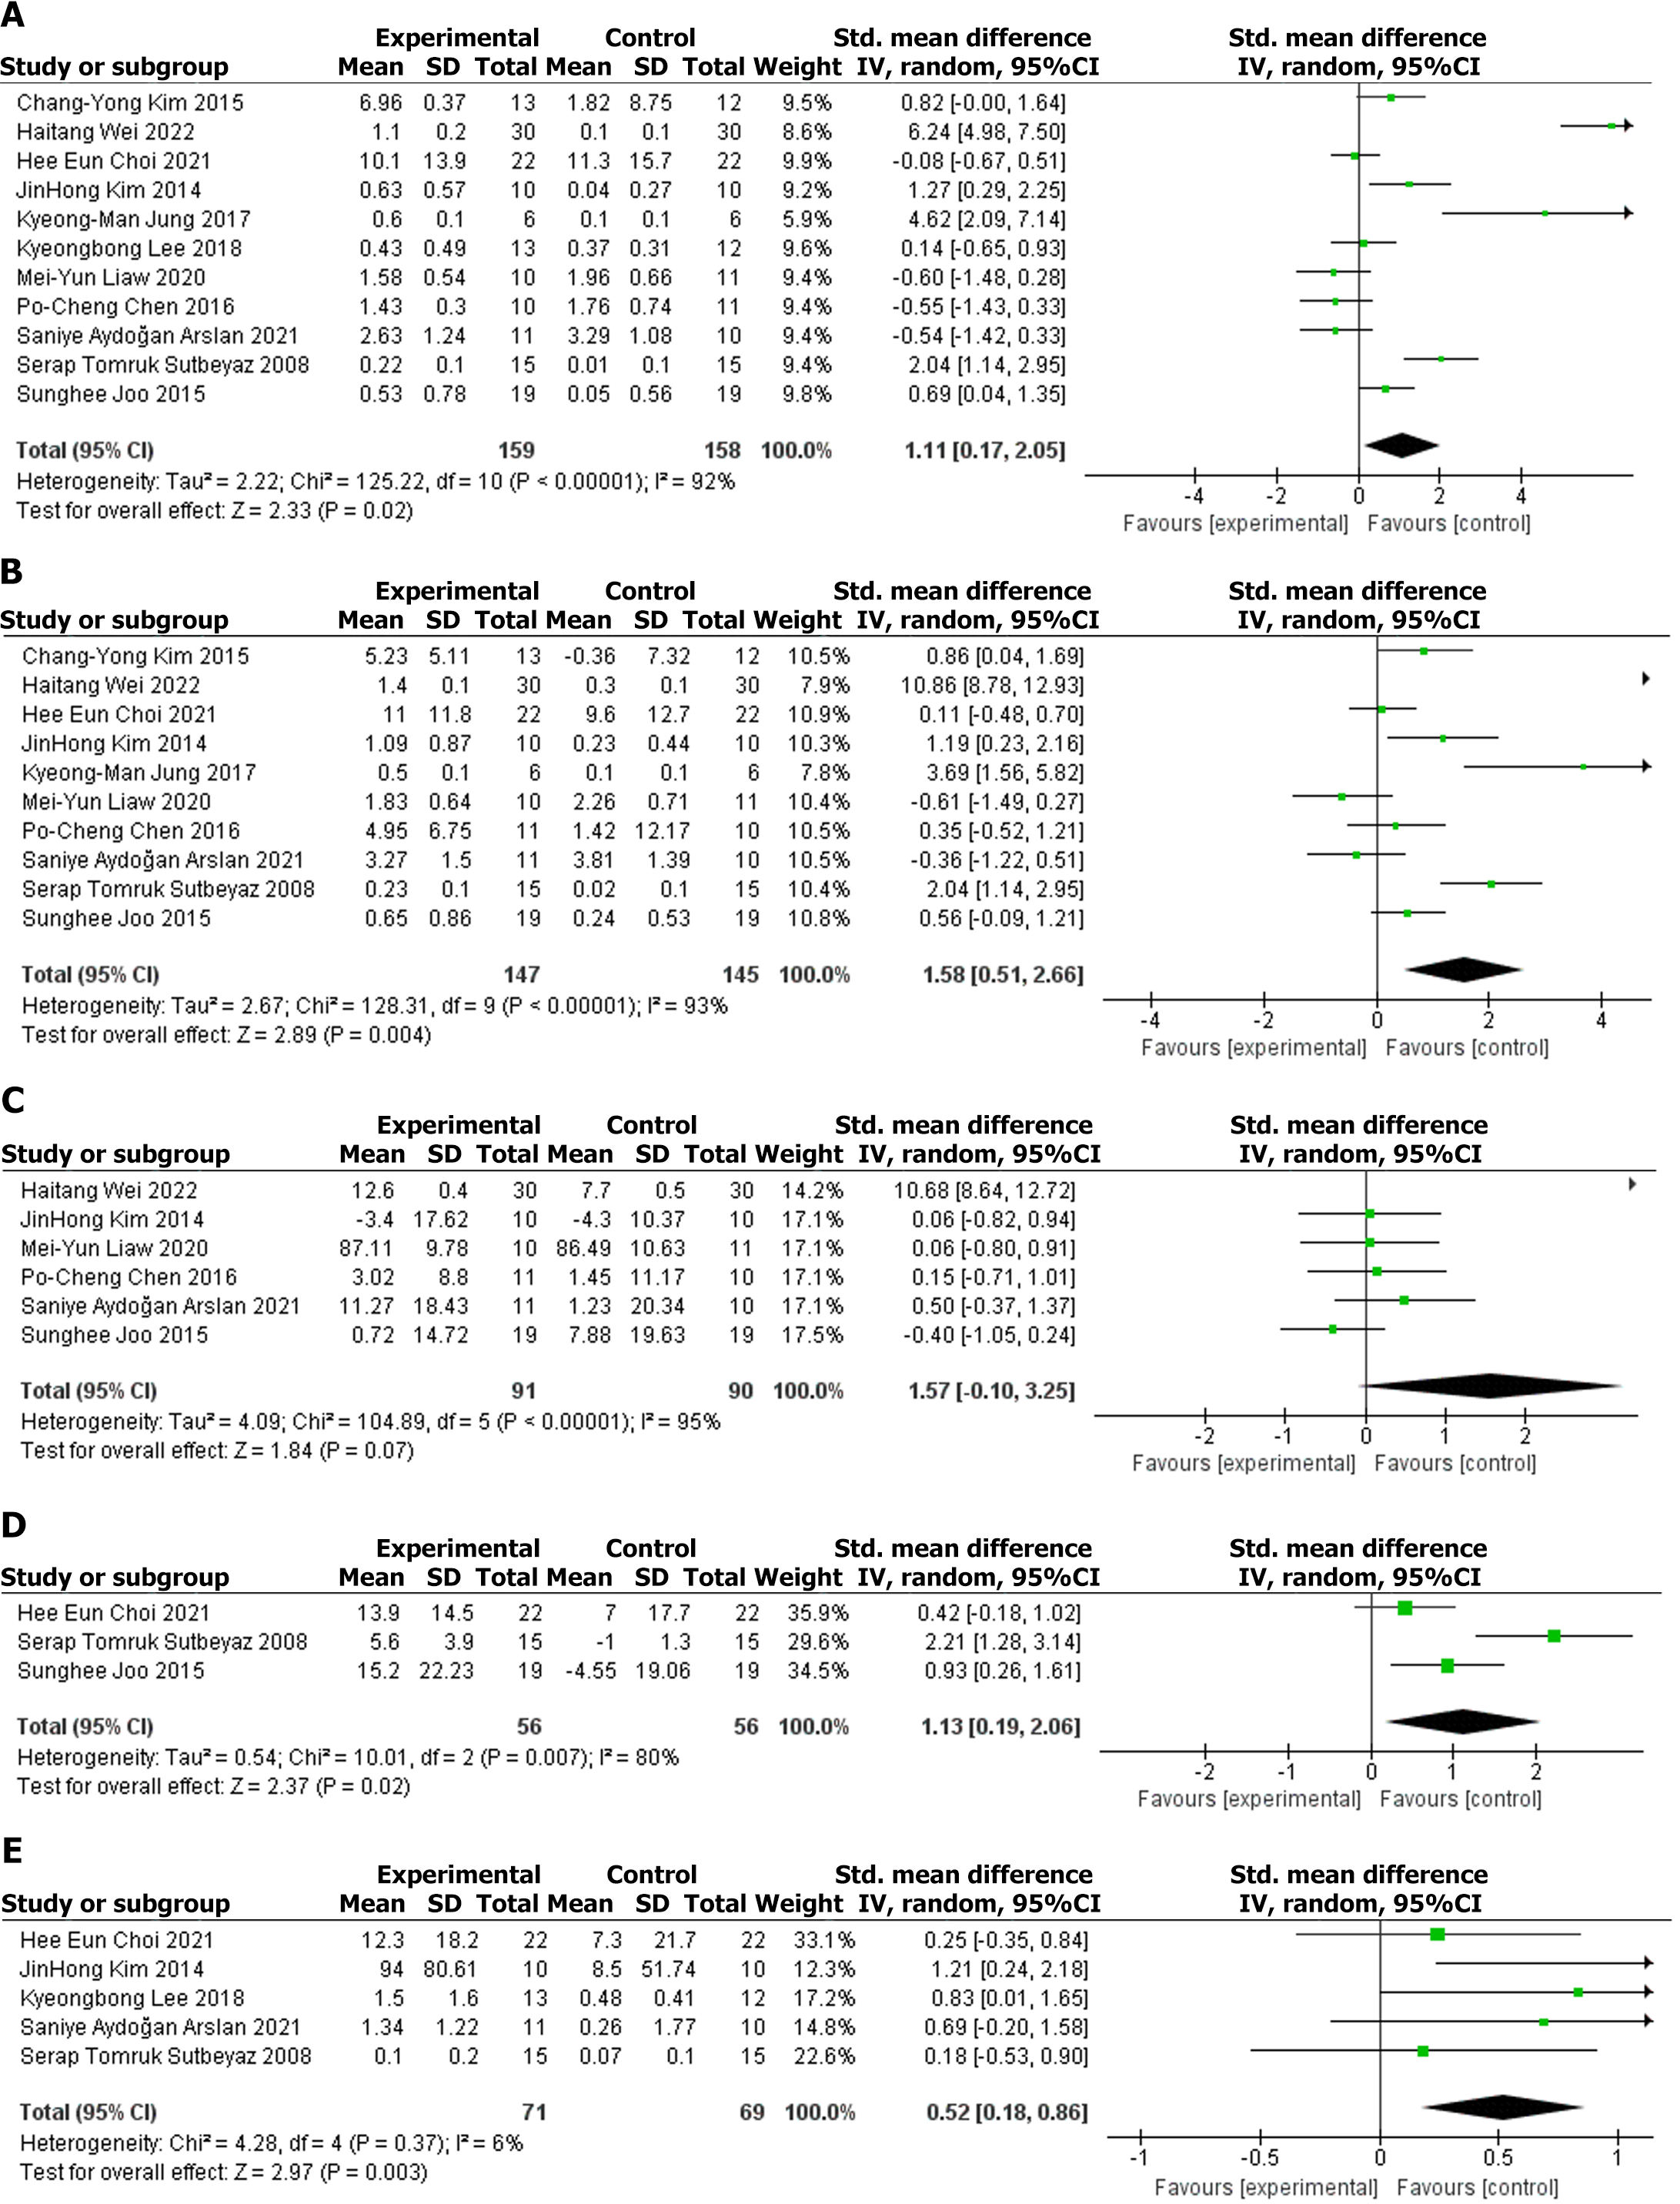
Figure 4 Series of charts illustrating effects of respiratory muscle training on various pulmonary function test outcomes.
A: Forced expiratory volume in the first second (FEV1); B: Forced vital capacity (FVC); C: FEV1/FVC ratio; D: Maximal voluntary ventilation; E: Peak expiratory flow.
Figure 5 Graph demonstrating influence of respiratory muscle training on exercise tolerance, measured by improvements in the 6-min walk test.
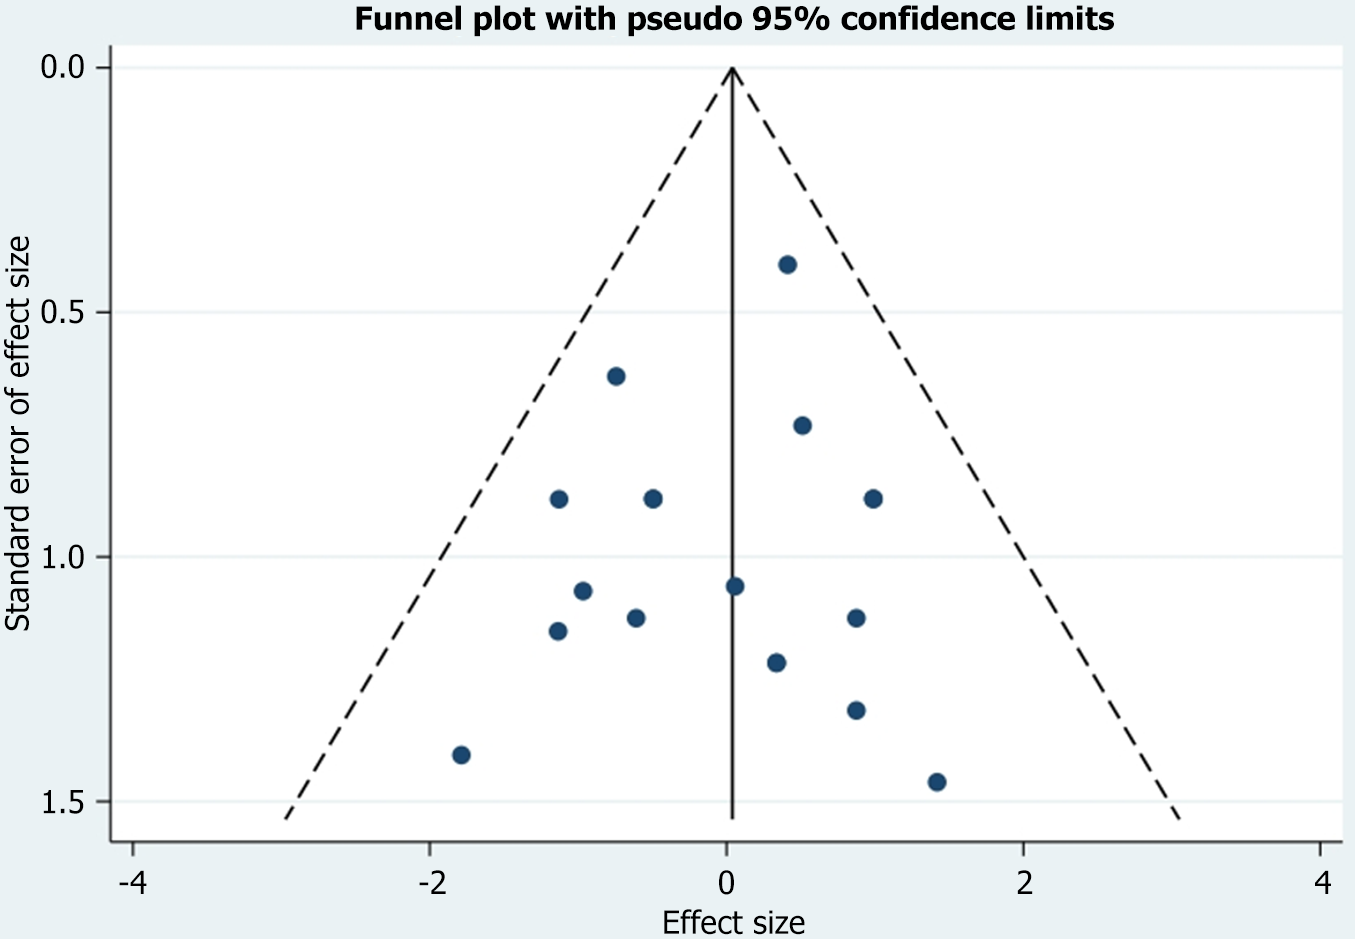
Figure 6 Funnel plot analyzing publication bias across all studies included in the meta-analysis, visually assessing the symmetry of data distribution.
- Citation: Liu YT, Liu XX, Liu YQ, Zhang L, Zhang LJ, Wang JH, Shi Y, Xie QF. Effects of respiratory muscle training on post-stroke rehabilitation: A systematic review and meta-analysis. World J Clin Cases 2024; 12(20): 4289-4300
- URL: https://www.wjgnet.com/2307-8960/full/v12/i20/4289.htm
- DOI: https://dx.doi.org/10.12998/wjcc.v12.i20.4289


