©The Author(s) 2023.
World J Clin Cases. Dec 16, 2023; 11(35): 8330-8342
Published online Dec 16, 2023. doi: 10.12998/wjcc.v11.i35.8330
Published online Dec 16, 2023. doi: 10.12998/wjcc.v11.i35.8330
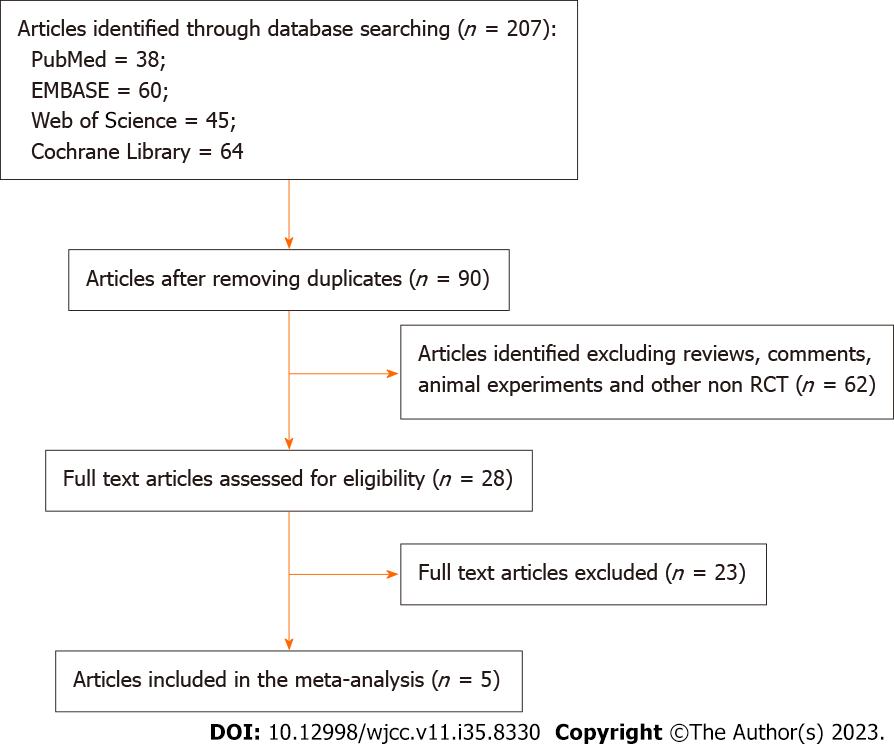
Figure 1 Flowchart of literature search and selection.
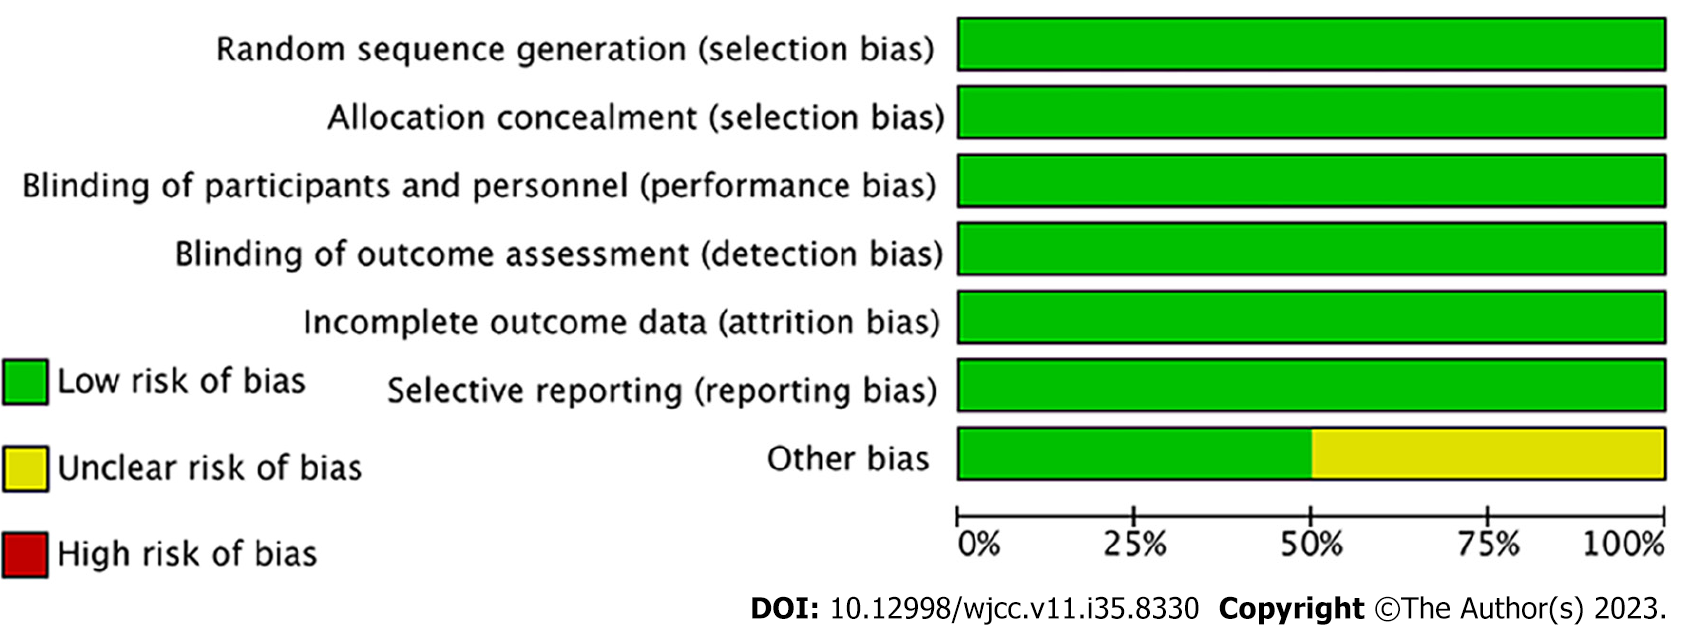
Figure 2 Risk of bias graph of the included studies.
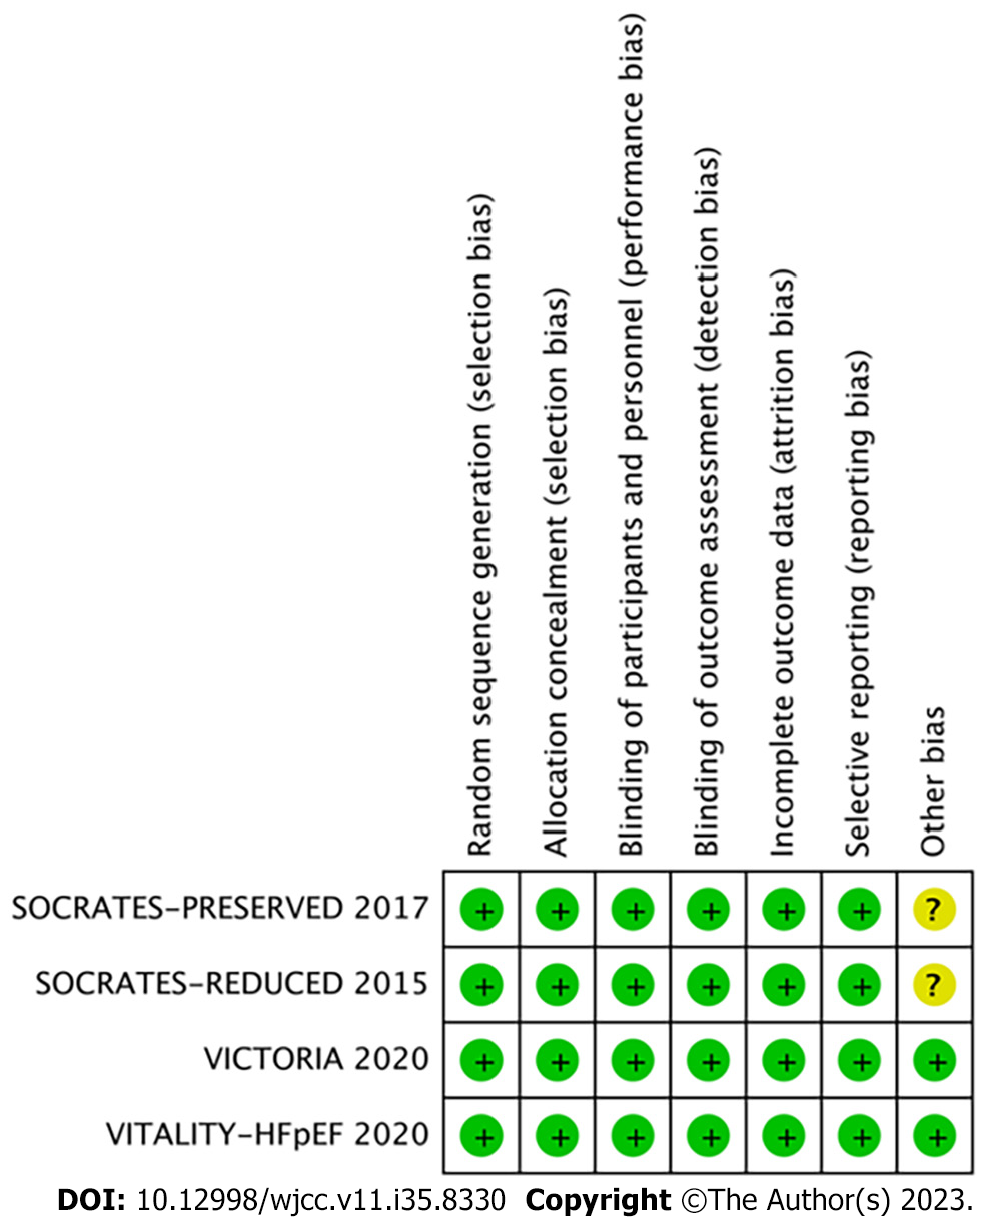
Figure 3 Risk of bias summary of the included studies.
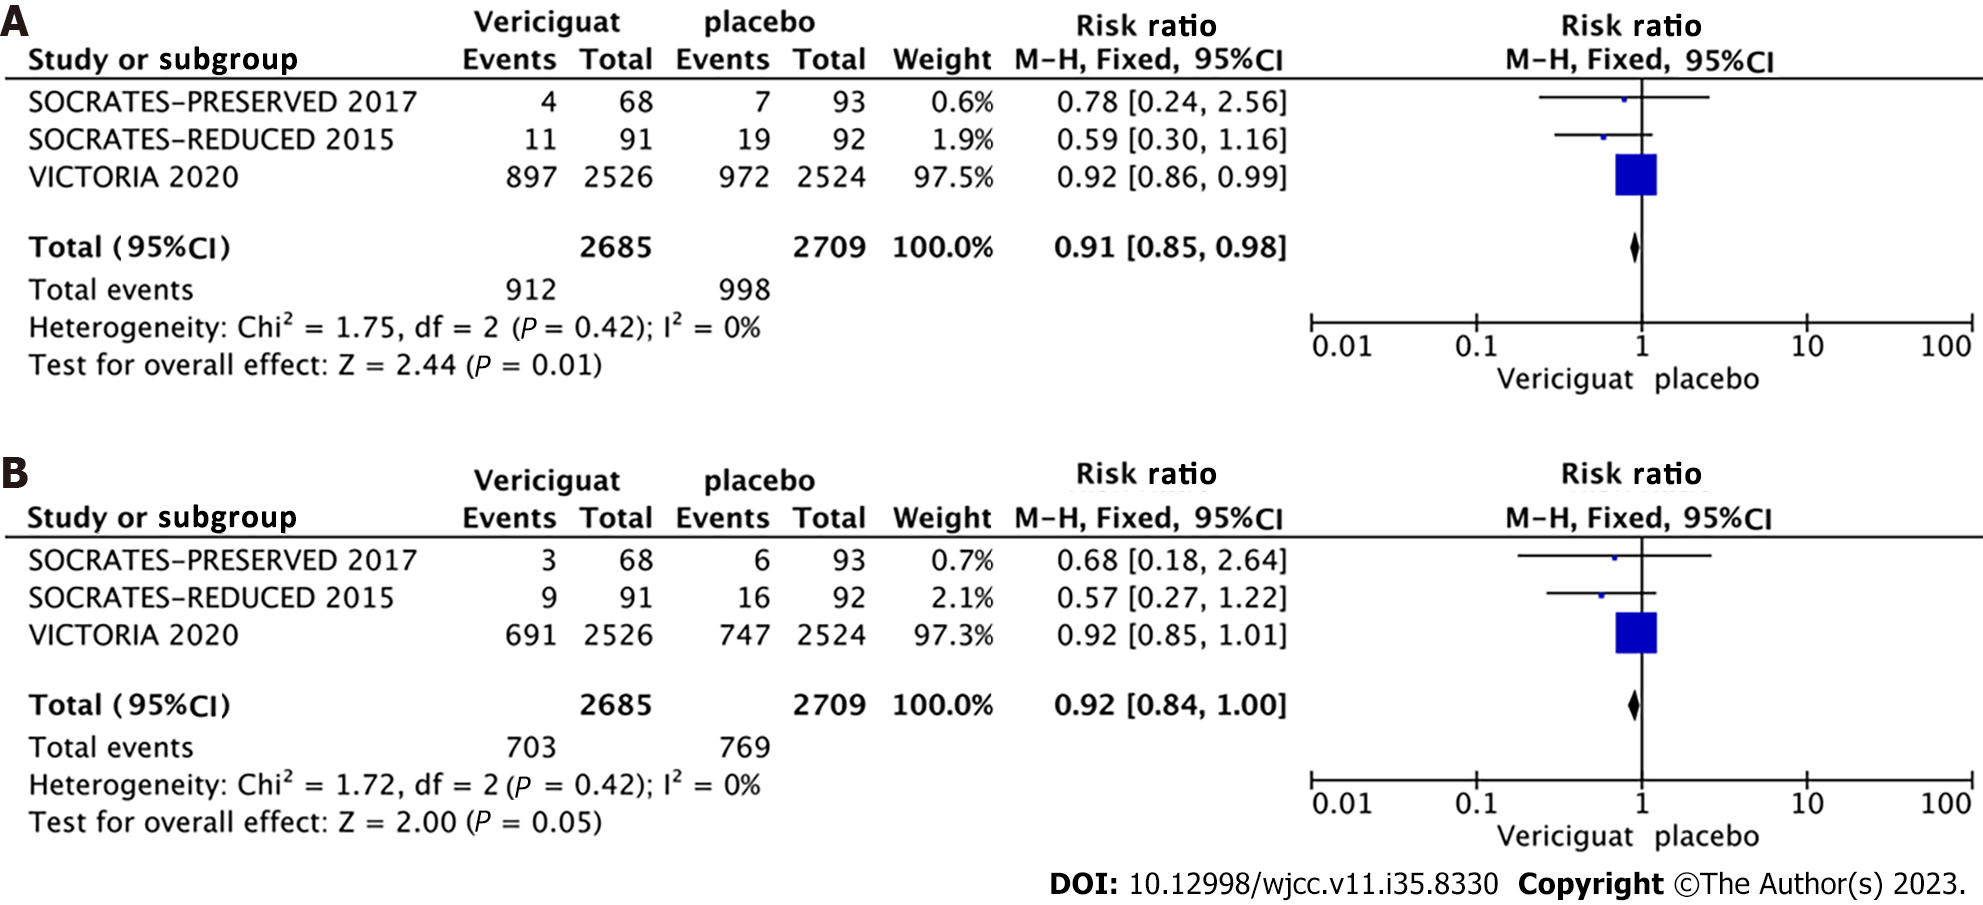
Figure 4 Forest plot of composite endpoint events and heart failure hospitalizations.
A: Composite endpoint event (cardiovascular death or first heart failure-related hospitalization); B: Hospitalizations for heart failure.
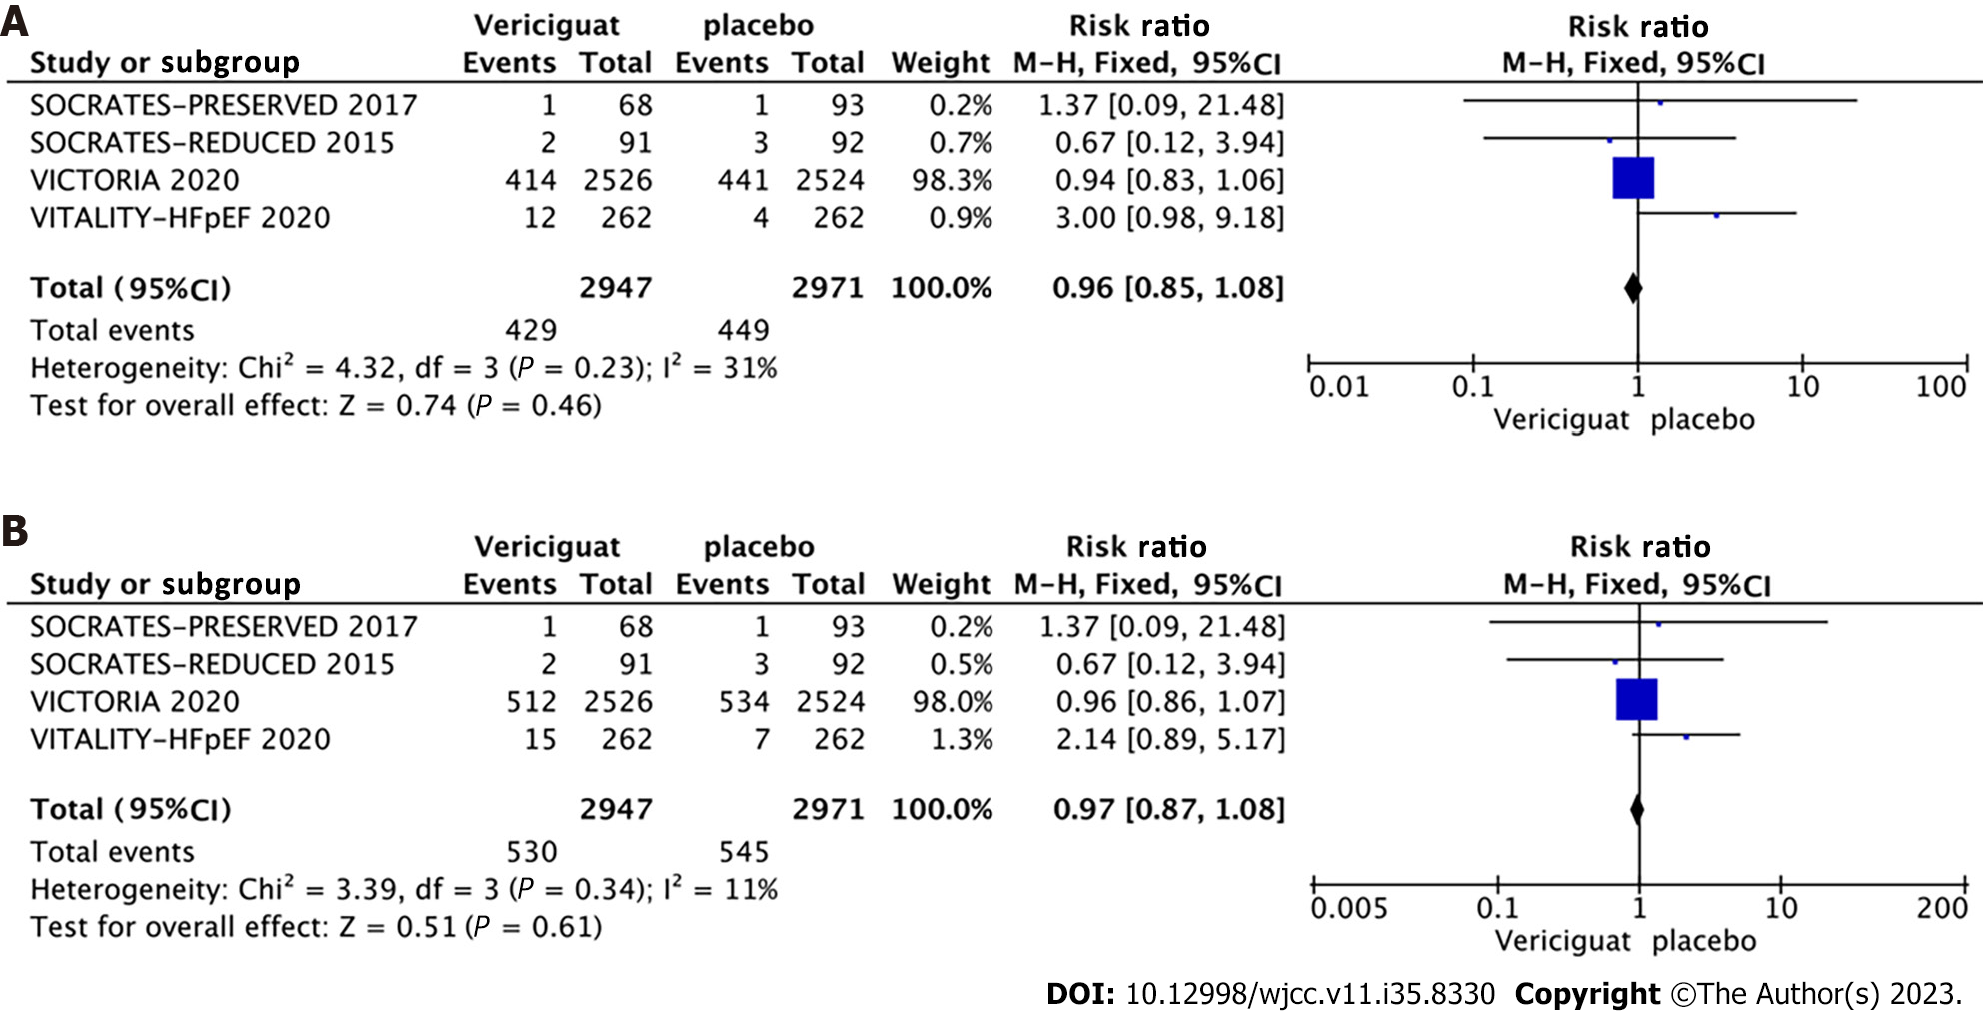
Figure 5 Forest plot of cardiovascular deaths and all-cause mortality events.
A: Cardiovascular death; B: All-cause mortality events.
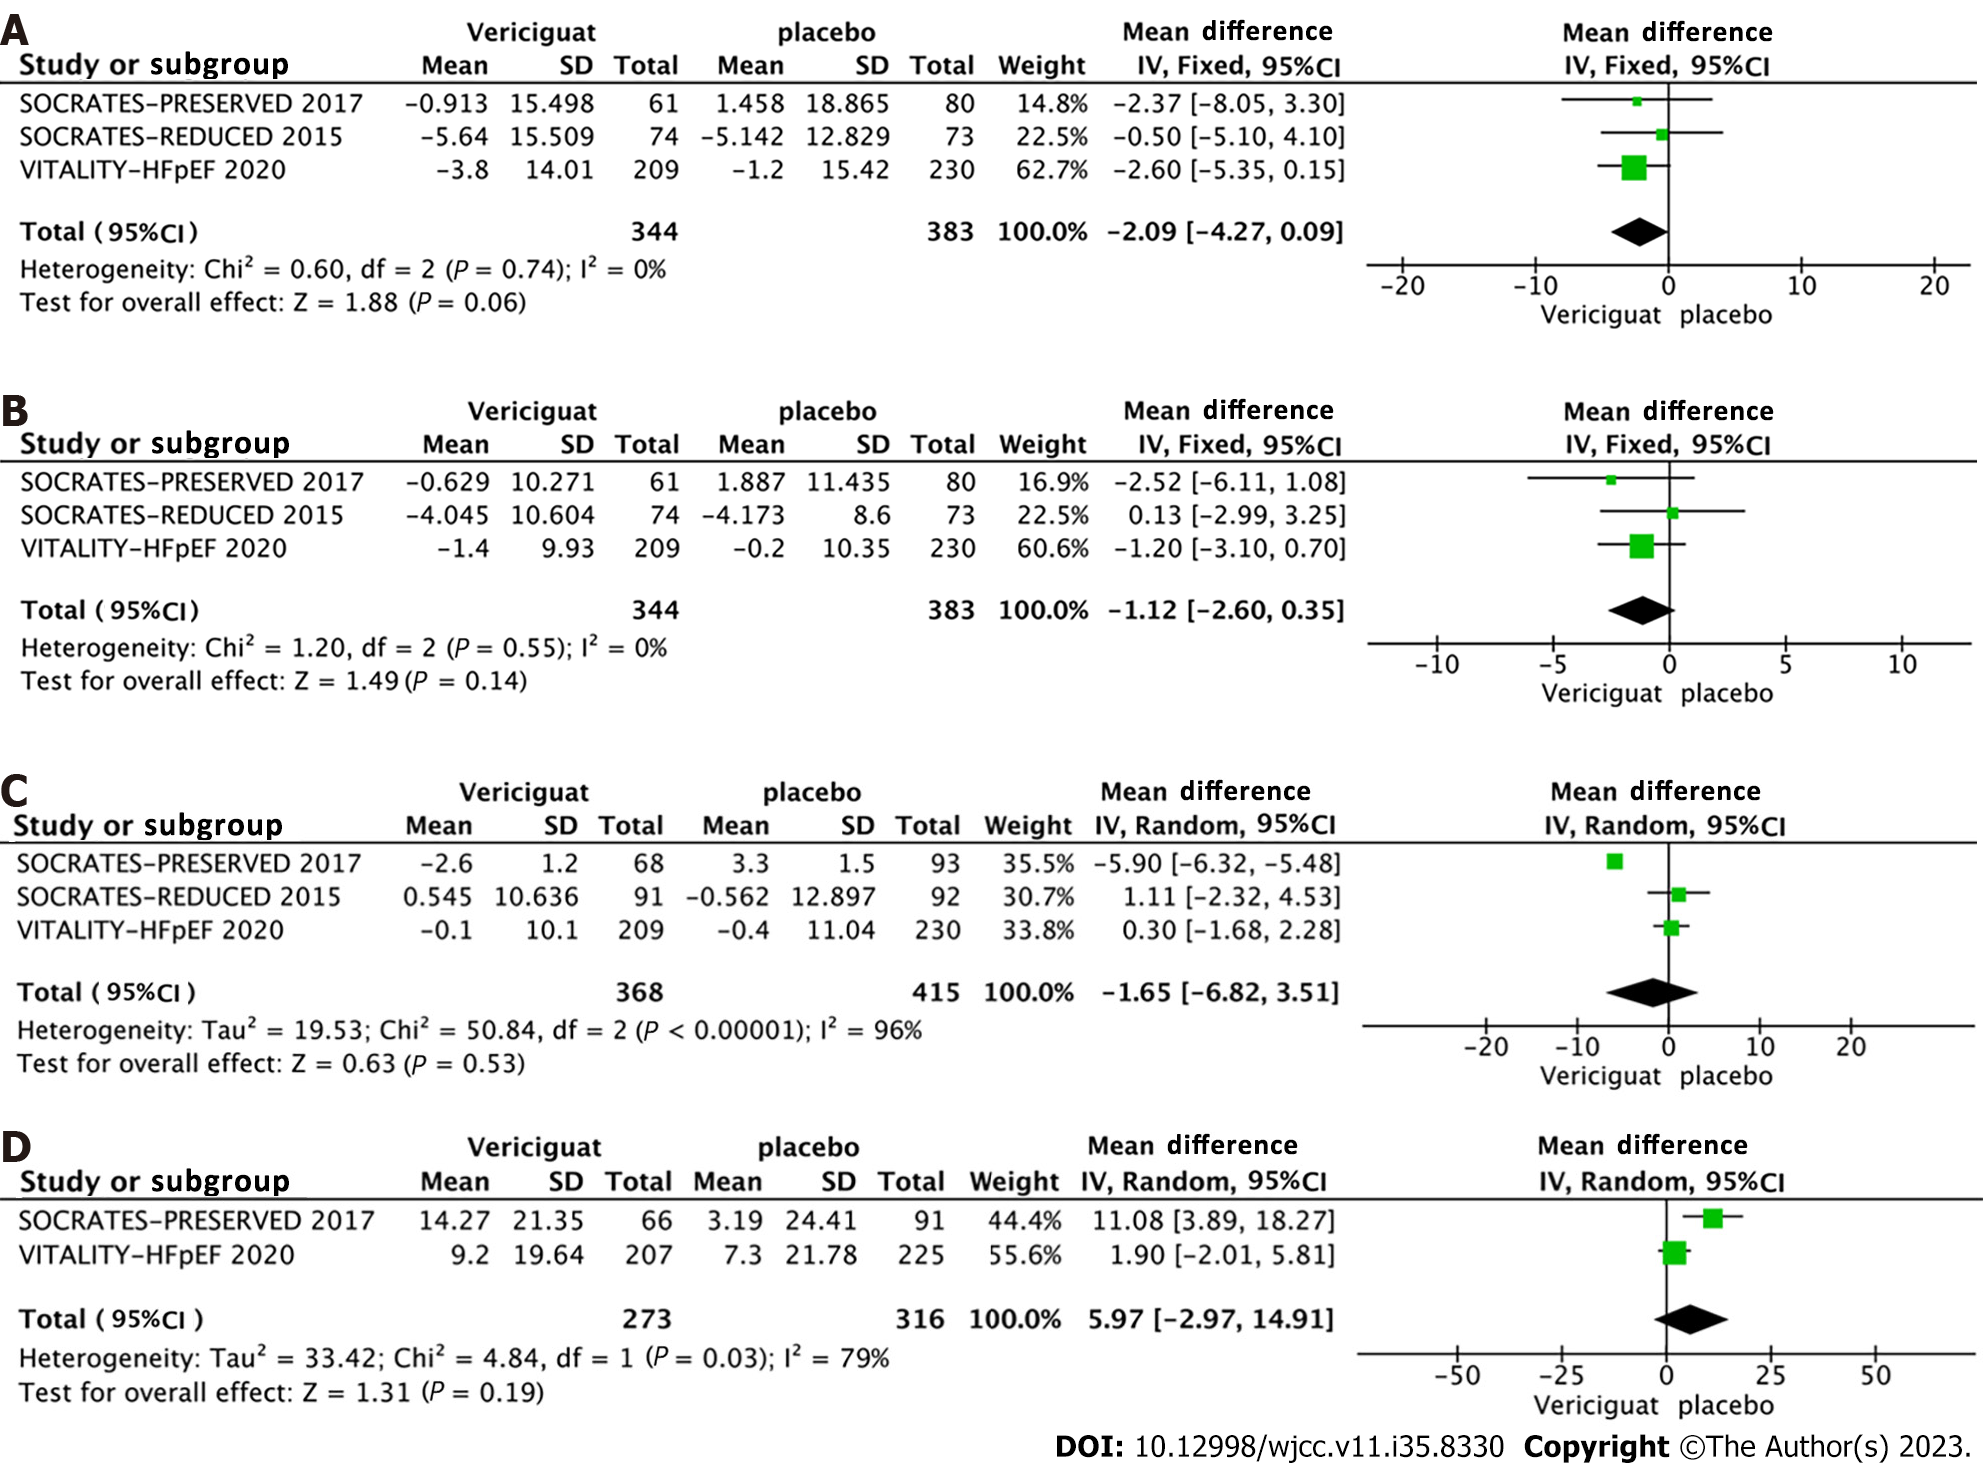
Figure 6 Forest plot of changes in blood pressure, heart rate, and Kansas Cardiomyopathy Questionnaire physical limitation score.
A: Systolic blood pressure; B: Diastolic blood pressure; C: Heart rate; D: Kansas Cardiomyopathy Questionnaire physical limitation score.
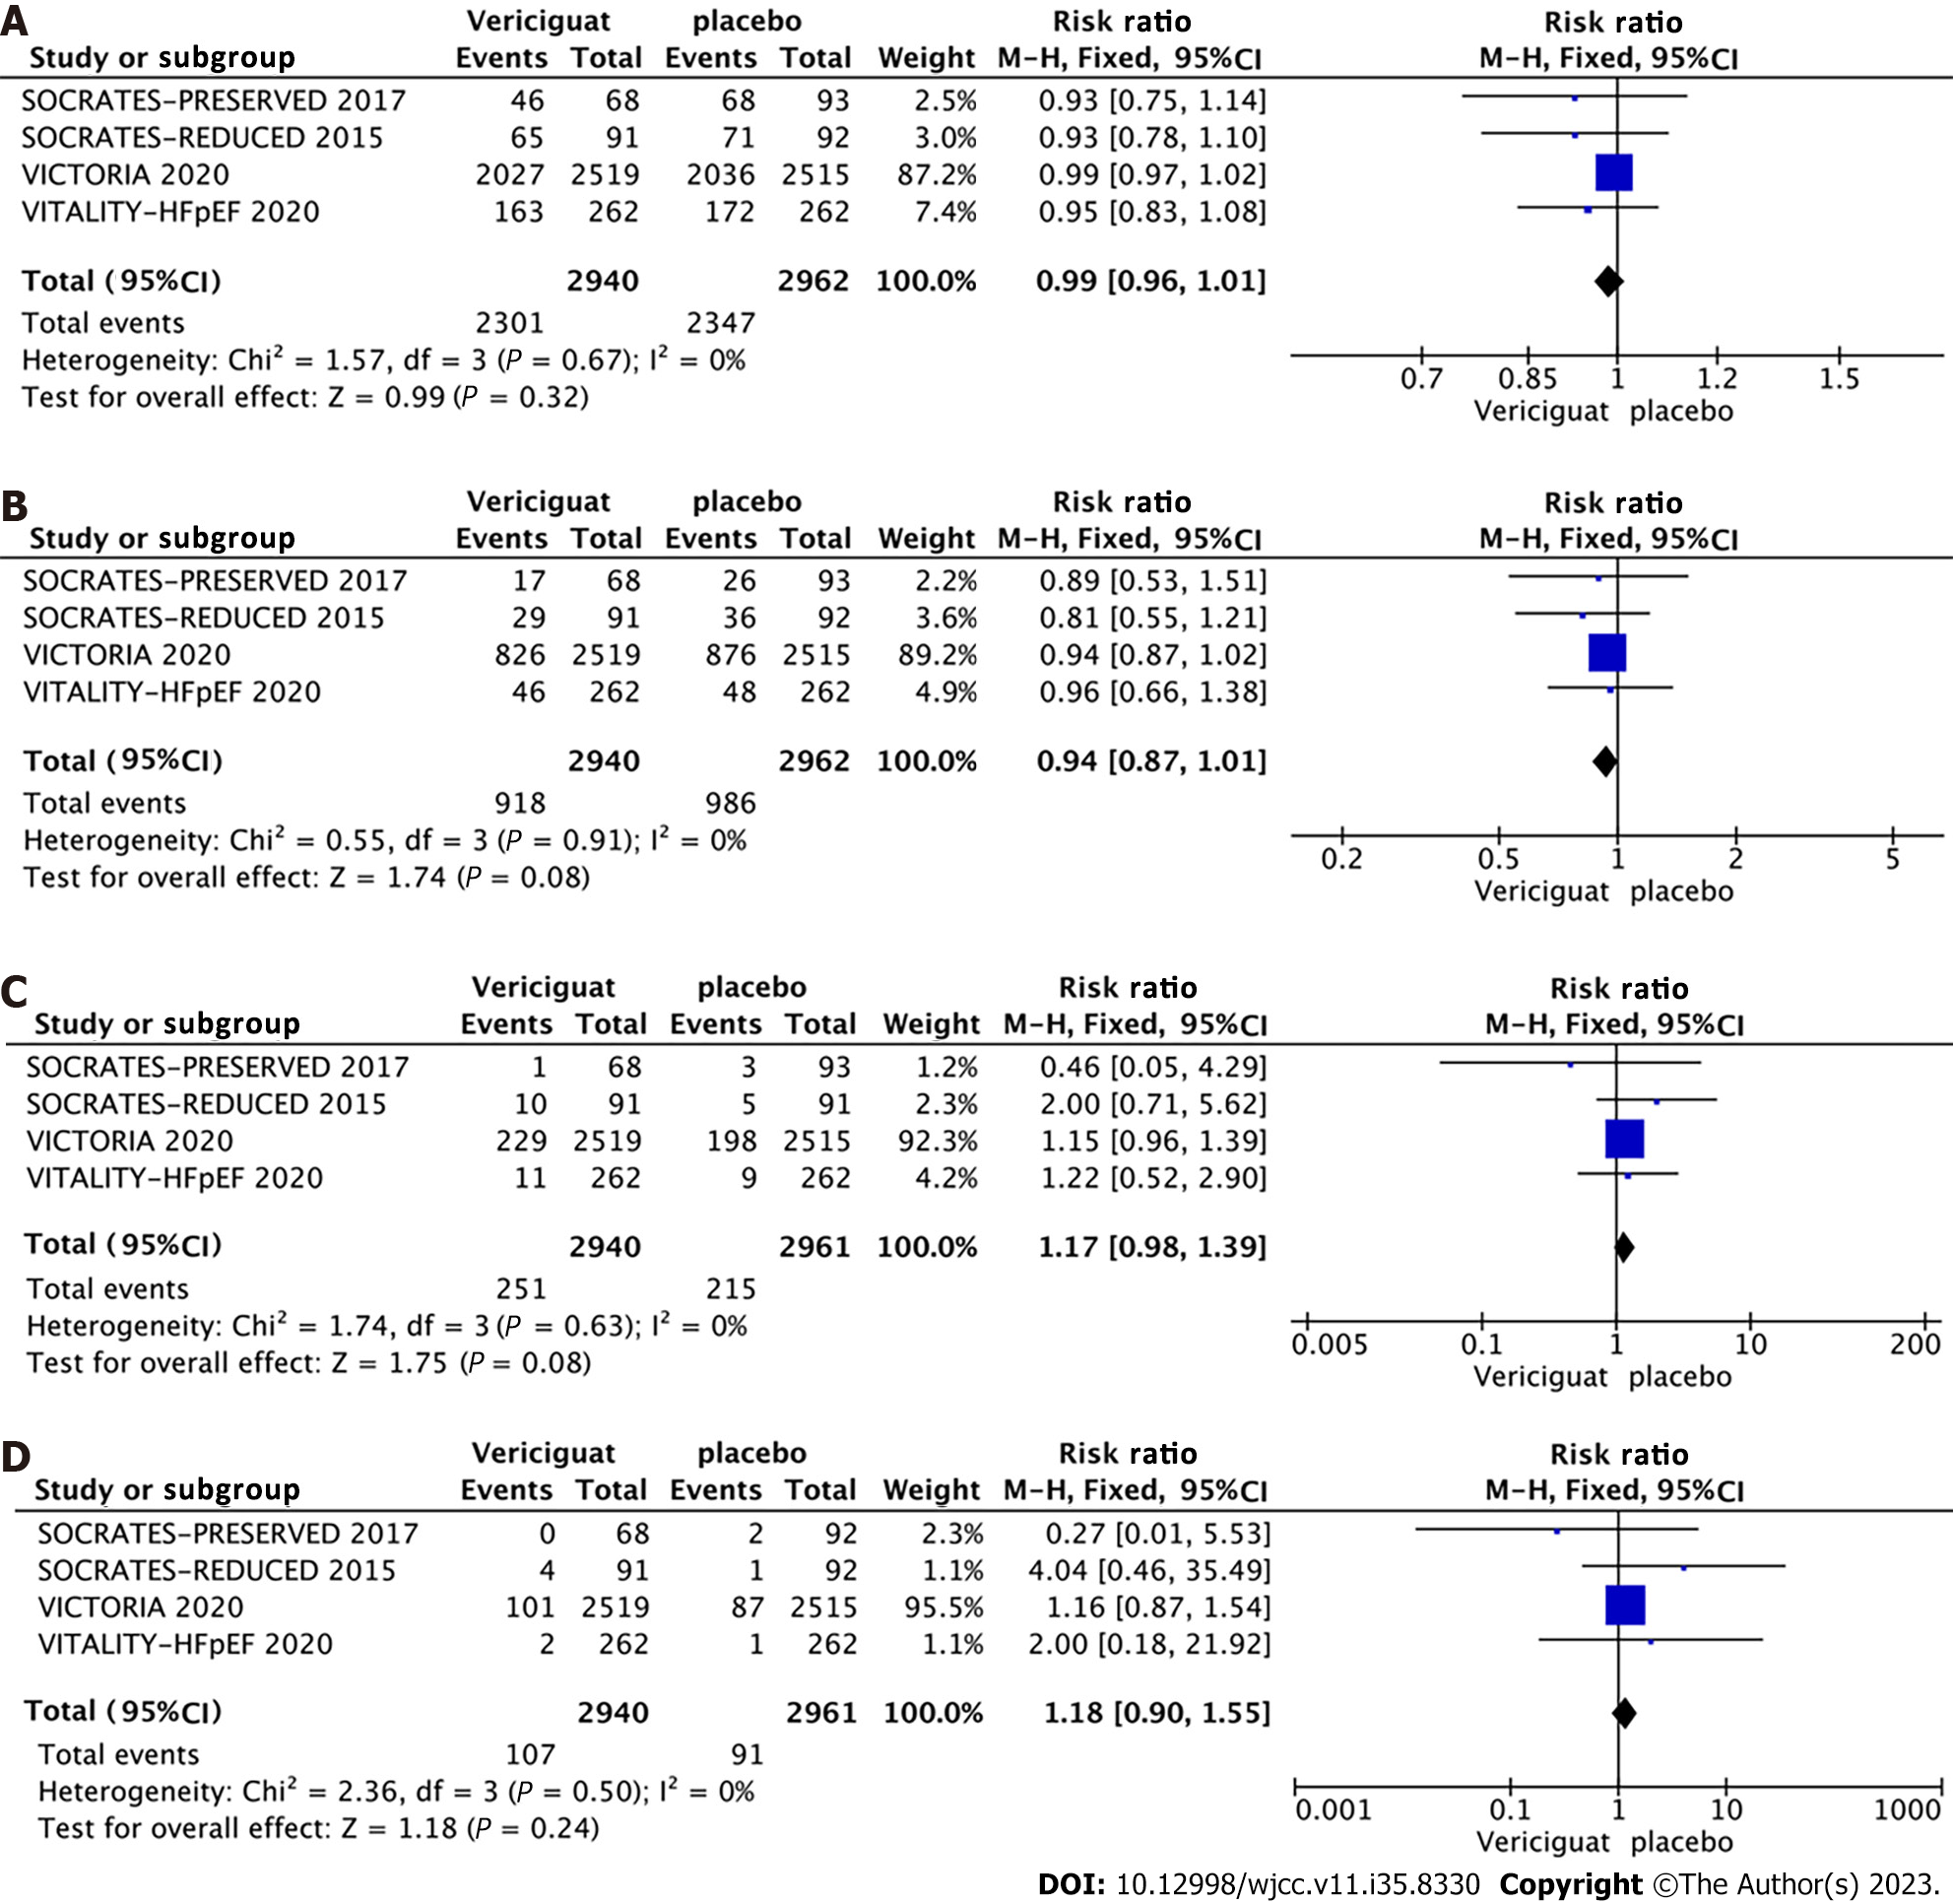
Figure 7 Forest plot of adverse events, serious adverse events, symptomatic hypotension, and syncopal events.
A: Adverse events; B: Serious adverse events; C: Symptomatic hypotension; D: Syncope.
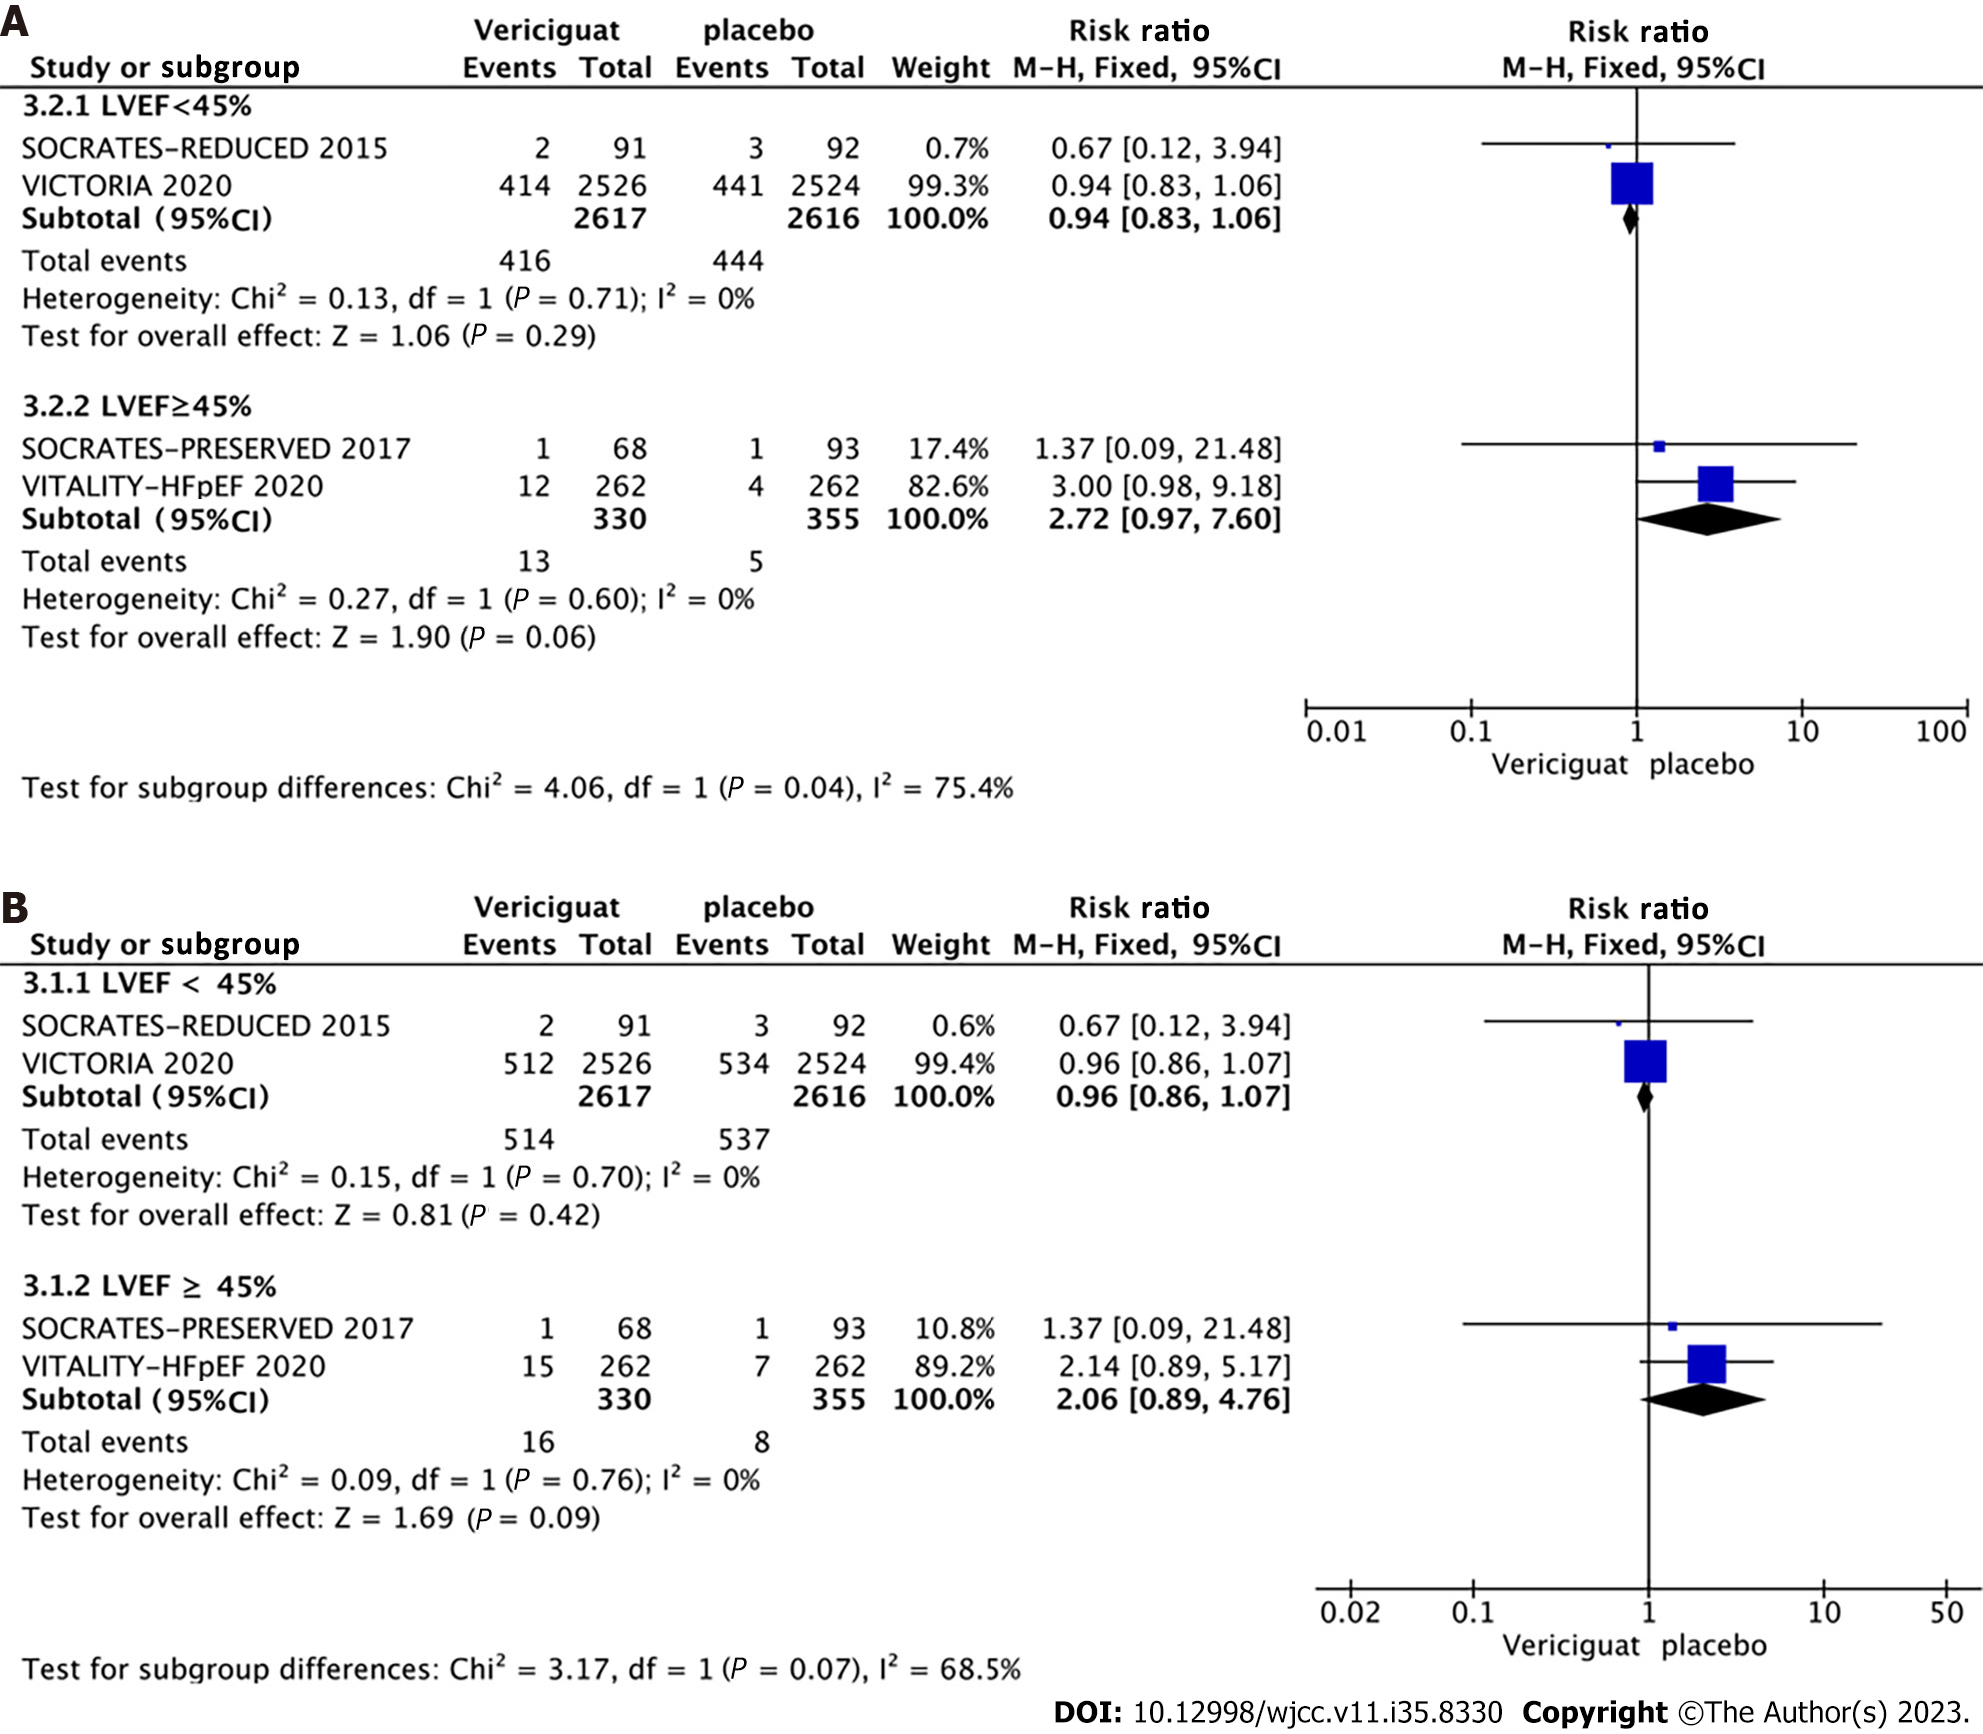
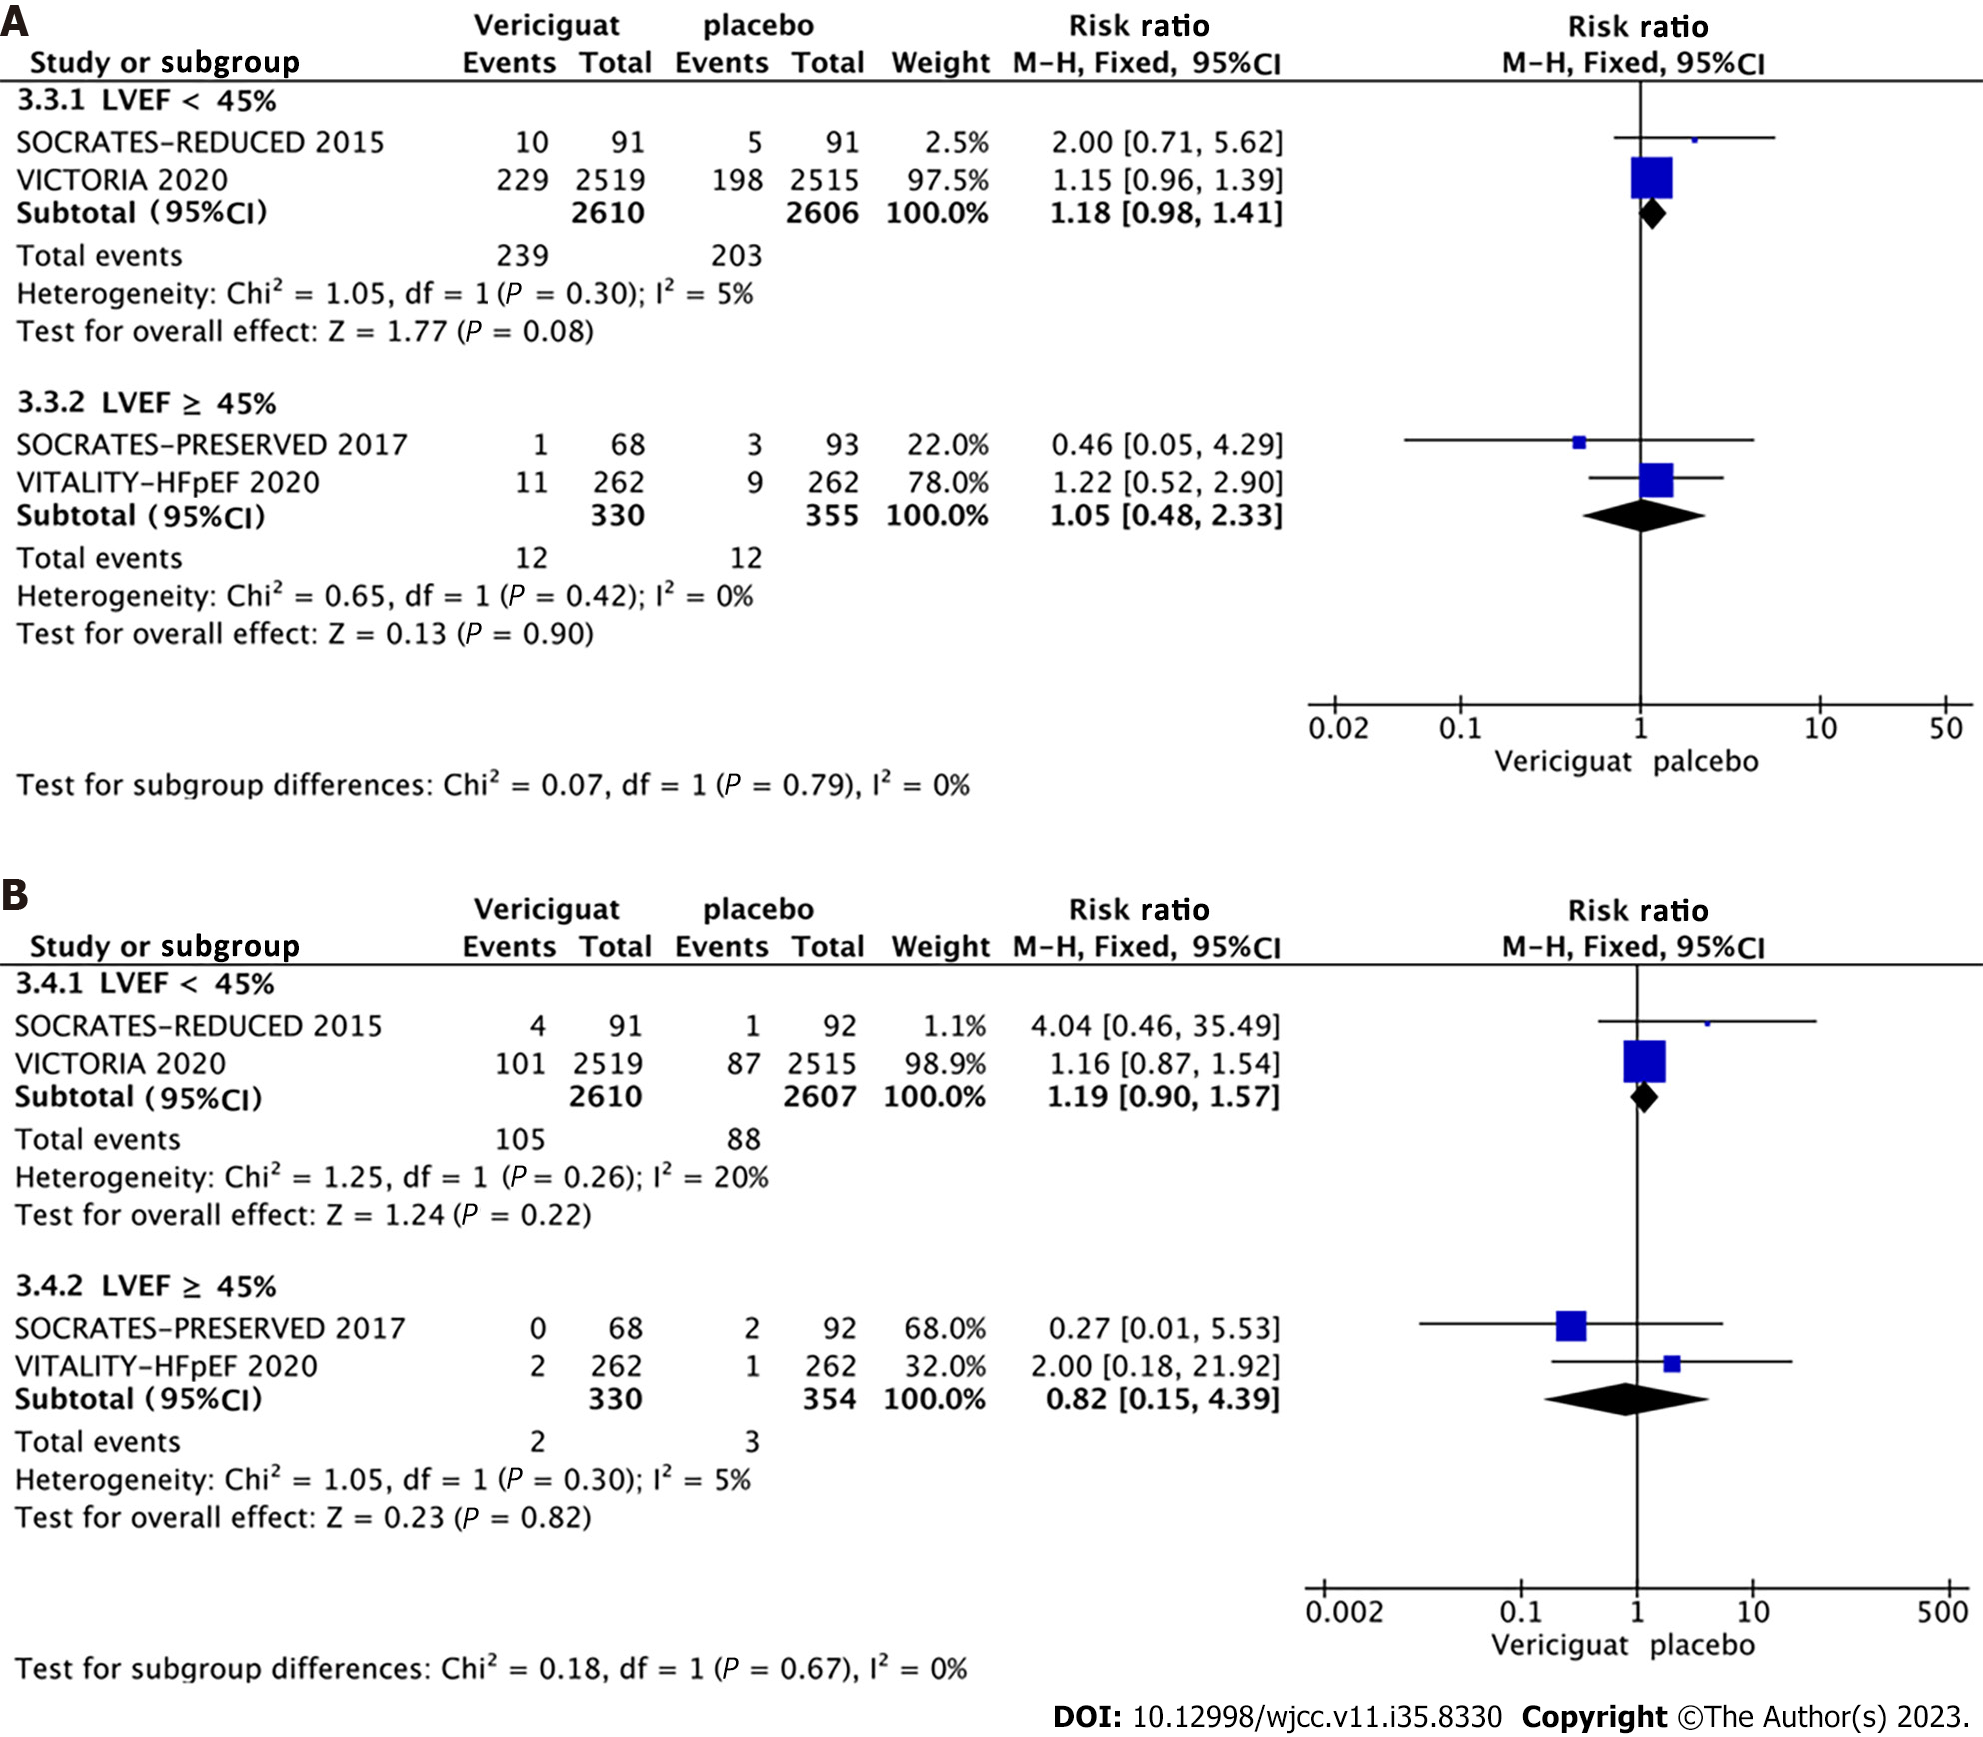
Figure 8 Forest plot of cardiovascular deaths and all-cause mortality events.
A: Cardiovascular deaths; B: All-cause mortality events.
Figure 9 Forest plot of symptomatic hypotension and syncopal events.
A: Symptomatic hypotension; B: Syncope.
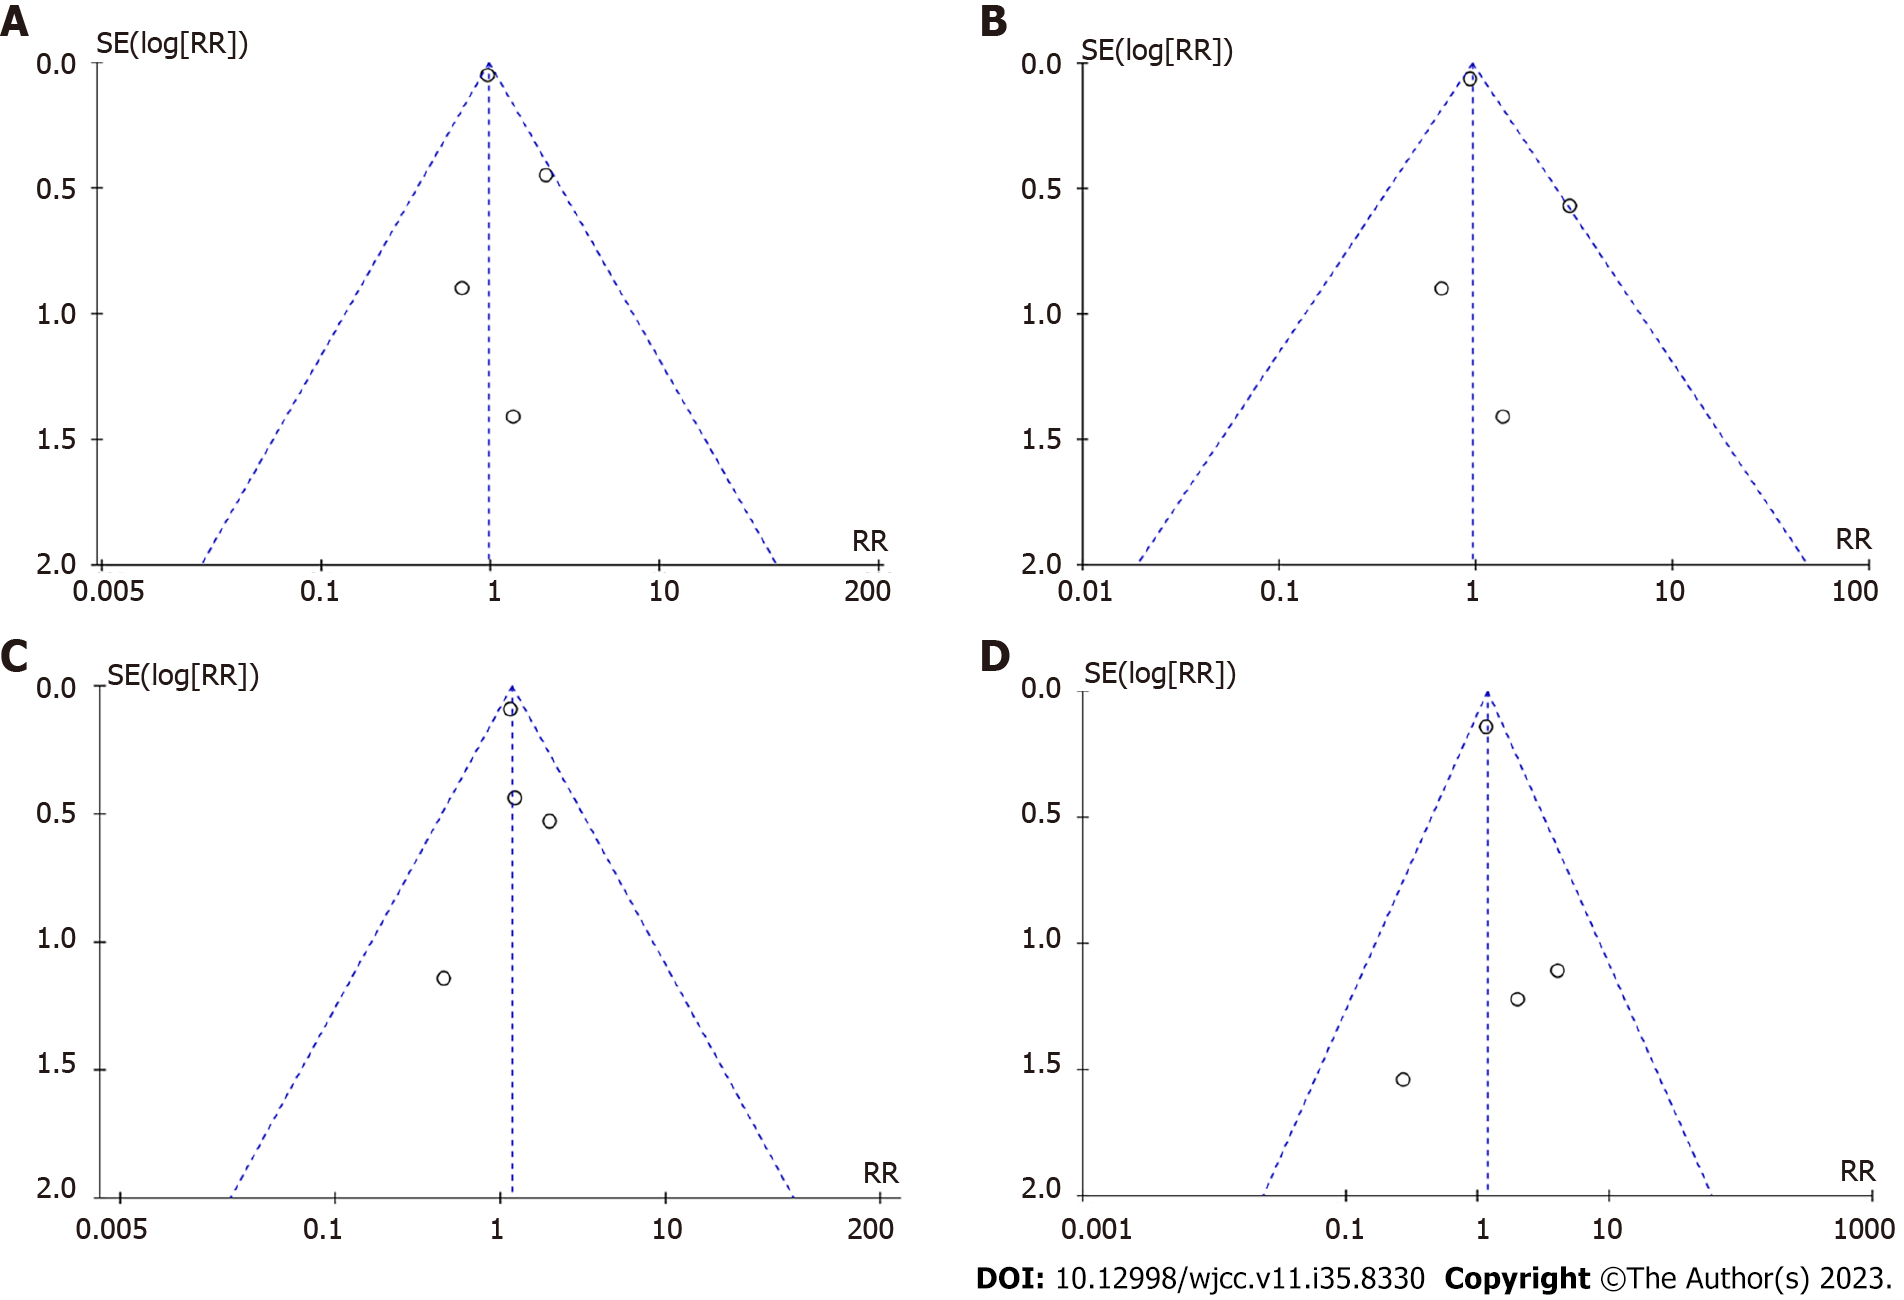
Figure 10 Funnel plot of cardiovascular deaths, all-cause deaths, symptomatic hypotension, and syncope.
A: Cardiovascular deaths; B: All-cause deaths; C: Symptomatic hypotension; D: Syncope.
- Citation: Yang H, Luo C, Lan WQ, Tang YH. Vericiguat treatment of heart failure: A systematic review and meta-analysis. World J Clin Cases 2023; 11(35): 8330-8342
- URL: https://www.wjgnet.com/2307-8960/full/v11/i35/8330.htm
- DOI: https://dx.doi.org/10.12998/wjcc.v11.i35.8330


